


The very big picture (a historical perspective): The CAPE is now at 34.05 – down this week -0.47% at the beginning of the month measured against April 1, 2024.
The long-term valuation of the market is commonly measured by the Cyclically Adjusted Price to Earnings ratio, or “CAPE”, which smooths-out shorter-term earnings swings in order to get a longer-term assessment of market valuation. In the past, the CAPE ratio has proved its importance in identifying potential bubbles and market crashes. An extremely high CAPE ratio means that a company’s stock price is substantially higher than the company’s earnings would indicate and, therefore, overvalued. It is generally expected that the market will eventually correct the company’s stock price by pushing it down to its true value. The historical average of the ratio for the S&P 500 Index is between 15-16, while the highest levels of the ratio have exceeded 30. The record-high levels occurred three times in the history of the U.S. financial markets. The first was in 1929 before the Wall Street crash that signaled the start of the Great Depression. The second was in the late 1990s before the Dotcom Crash, and the third came in 2007 before the 2007-2008 Financial Crisis. https://www.multpl.com/shiller-pe
HISTORY OF THE CAPE VALUE FROM 1871 TO PRESENT
Note: We do not use CAPE as an official input into our methods. However, we think history serves as a guide and that it’s good to know where we are on the historic continuum. https://www.multpl.com/shiller-pe
The big picture: The ‘big picture’ is the (typically) years-long timeframe, the same timeframe in which Cyclical Bulls and Bears operate. The Sherman Portfolios DELTA-V Indicator measuring the Bull/Bear cycle finished the week in BULL status at 69.14, down 2.07% from the prior week’s 70.60. We’ve been in a cyclical Bull Market since April 21, 2023.
The shorter term picture: GALACTIC SHIELD — POSITIVE entering April 2024 (Q2)indicating positive prospects for equities in the second quarter of 2024. This indicator is based on the combination of U.S. and International Equities trend statuses at the start of each quarter. STARFLUX— POSITIVE since Nov 16, 2023 and ended the week of 5/3/24 at 2.62 (up 0.81). This short-term indicator measures U.S. Equities. STARPATH — POSITIVE since November 21, 2023. This indicator measures the interplay on dual timeframes of our Type 1s + the Russell 3000 + our four most ‘pro-cyclical’ Type 3s, vs. Cash.
The complete picture (four indicators across three timeframes): When all four of the Sherman Portfolios indicators are in a POSITIVE status, we read the market as being in a CYCLICAL BULL MARKET.
1. DELTA-V — Positive
2. GALACTIC SHIELD — Positive
3. STARFLUX— Positive
4. STARPATH — Positive
THIS WEEK IN THE MARKETS
U.S. Markets: LATE RALLY LIFTS SMALL-CAPS BACK INTO POSITIVE TERRITORY FOR 2024. Stocks ended higher following a volatile week featuring a raft of economic and earnings data. Growth stocks outperformed value shares, which were flat overall for the week. Small-caps outpaced large-caps, helping lift the small-cap Russell 2000 Index back into slightly positive territory for the year-to-date period.
It was the second-busiest week of first-quarter earnings reports, and a positive reception to Apple’s earnings release after the close of trading on Thursday seemed to help drive a rebound in overall sentiment. The company beat consensus revenue expectations, but investors also appeared enthused by Apple’s announcement that it would buy back USD 110 billion of its own shares, the largest such repurchase in history. Another notable mover for the week was Tesla, which surged over 15% on Monday after founder Elon Musk made a surprise appearance in China following news of the government’s tentative approval of the self-driving technology the company has under development.
Looking at the US Indexes: Indexes continued to see positive momentum this week, albeit a lighter growth week vs the end of April. Small-cap led the way this week closing in on 2% gains and is now back above negative YTD territory.

The Dow Jones Industrial Average (DJIA) is the oldest continuing U.S. market index with over 100 years of history and is made up of 30 highly reputable “blue-chip” U.S. stocks (e.g. Coca-Cola Co., Microsoft). The Dow continued its upward trend this week with over 1% growth – more than last week’s lifts. By market-close this week, the DJIA, gained 1.14%, ending the week of May 3 at 38,675.68 vs the prior week of 38,239.66, now sitting at +2.62% YTD.
The Nasdaq Composite Index tracks most of the stocks listed on the Nasdaq Stock Market – the second-largest stock exchange in the world. Over half of all stocks on the NASDAQ are tech stocks. The tech-driven Nasdaq, enjoyed steady gains of 1.43%, closing at 16,156.33 vs. the prior week of 15,927.90.
The S&P 500 large-cap index is a market-capitalization-weighted index of 500 leading publicly traded companies in the U.S. The S&P 500 is regarded as one of the best gauges of prominent American equities’ performance, and by extension, that of the stock market overall. The large-cap S&P 500 was the lightest growth this week with gains of 0.55%, closing at 5,127.79 vs last week’s close of 5,099.69 landing at 7.50% growth YTD.
The S&P 400 mid-cap index is the benchmark index made up of 400 stocks that broadly represent companies with midrange market capitalization between $3.6 billion and $13.1 billion. It is used by investors as a gauge for market performance and directional trends in U.S. stocks. The S&P 400 mid-cap continued steady growth with the index gaining 1.46% by market close ending at 2,929.04 vs last week’s 2,886.89.
he Russell 2000 (RUT) small-cap index measures the performance of the 2,000 smaller companies included in the Russell 3000 Index. The Russell 2000 is managed by London’s FTSE Russell Group and is widely regarded as a leading indicator of the U.S. economy because of its focus on smaller companies that focus on the U.S. market. The Russel 2000 lead the indexes this week in growth – something it desperately needed to exit the negative YTD territory. RUT gained 1.68% closing at 2,035.75 vs last week’s close of 2,002.00 bring the small-cap index to a now-positive YTD growth of 0.43%.
U.S. Commodities/Futures: A continued decline for all 4 commodities tracked below. Gold and Silver both dropped closer to 2% with Copper joining the negative momentum this week. Crude Oil was the biggest change this week after a positive gain last week.
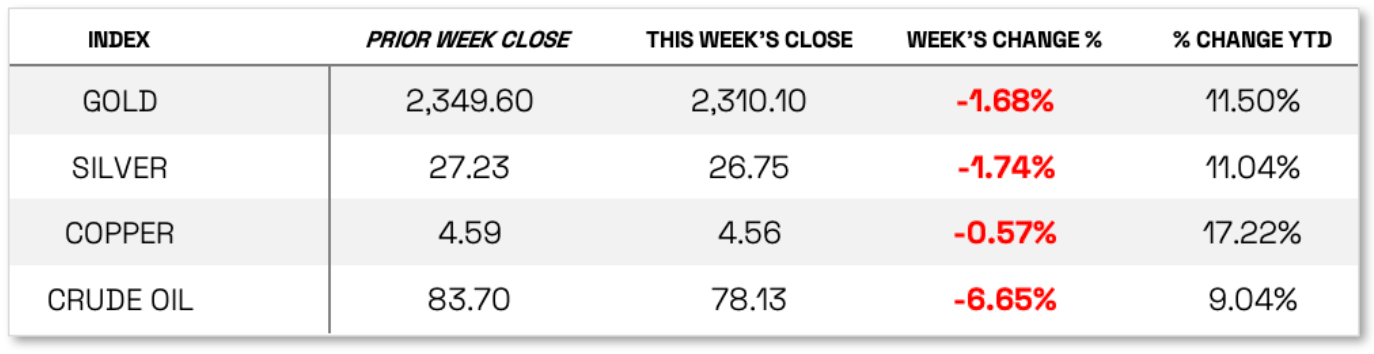
VIX closed at 13.49 this week, a 10.52% decrease over last week’s close of 15.03.
International Markets:
THIS WEEK’S ECONOMIC NEWS
U.S. Economic News: STOCKS RALLY ON SIGNS THAT WAGE PRESSURES ARE EASING. The main driver of the week’s gains appeared to be Friday morning’s nonfarm payrolls report, which showed that employers added 175,000 jobs in April, less than expected and the lowest number since November. While the miss signaled a cooldown in the labor market, and thus lower inflationary pressures, investors may have been more pleased by a surprise slowdown in monthly wage increases, from 0.3% in March to 0.2% in April. The year-over-year gain fell to 3.9%, the slowest increase in almost two years. Similarly, average weekly hours worked fell back slightly, while the unemployment rate climbed slightly to 3.9%.
The news may have been particularly welcome because it followed some upside inflation and (more distinct) downward growth surprises earlier in the week—a combination that added to recent worries over emerging “stagflation” trends. Stocks fell sharply on Tuesday after the Labor Department reported that employment costs rose 1.2% in the first quarter—or an annual rate of nearly 5%—which was above expectations and the fastest pace in a year. A separate report showed home prices rising in February at their fastest pace in eight months.
Meanwhile, a gauge of business activity in the Chicago area fell to its lowest level since November 2022, and the Conference Board’s measure of consumer confidence declined in April to its lowest point in nearly two years. The Labor Department’s tally of March job openings, reported Wednesday, fell more than expected to 8.5 million, the lowest level in over three years. On Friday, the Institute for Supply Management reported that its gauge of services sector activity had fallen back into contraction territory for the first time since December 2022.
POWELL PUSHES BACK ON STAGFLATION WORRIES. Investors seemed to take some encouragement the following day from Federal Reserve Chair Jerome Powell’s response to the data. In his press conference following the Fed’s two-day policy meeting, Powell pushed back against stagflation worries, stating that “I don’t really understand where that’s coming from” and citing current growth and inflation rates of around 3%. Powell also stressed that while policymakers were not prepared to cut rates—and rates were left steady at the meeting, as was widely expected—neither did they see the need to increase rates given the “sufficiently restrictive” current stance of monetary policy.
The evidence of a cooling jobs market helped push the yield on the benchmark 10-year U.S. Treasury note to an intraday low of around 4.45% on Friday morning, its lowest level in nearly a month. (Bond prices and yields move in opposite directions.) A subdued primary calendar further helped returns in the tax-exempt municipal bond market.
Issuance was relatively light in the investment-grade corporate bond market, and all issues were oversubscribed. Traders reported that, following a somewhat mixed start to the week, high yield bonds traded higher alongside equities in response to Powell’s relatively dovish press conference. Meanwhile, earnings reports continued to play a role in returns, while new deals that came to the market were generally met with solid demand.
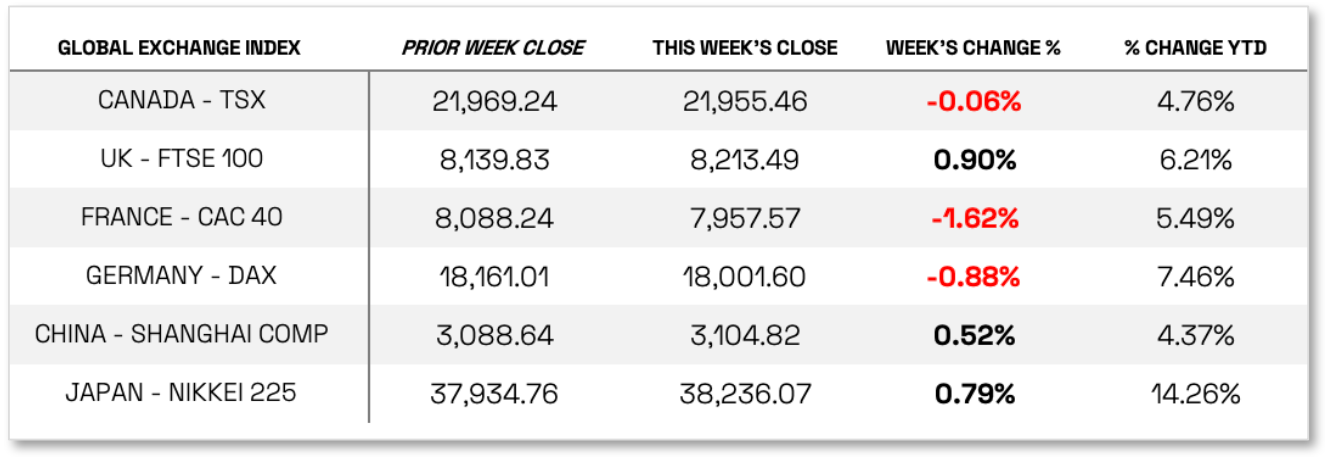
International Economic News: In local currency terms, the pan-European STOXX Europe 600 Index ended 0.48% lower. Investors appeared to become more cautious amid mixed corporate earnings and uncertainty surrounding the outlook for interest rates after June. Major stock indexes were mixed. Germany’s DAX weakened 0.88%, France’s CAC 40 Index lost 1.62%, and Italy’s FTSE MIB declined 1.81%. The UK’s FTSE 100 Index, however, added 0.90%, driven to a fresh high by strength in mining and energy stocks.
European government bond yields generally declined, as policymakers downplayed growing concerns about the potential further interest rate increases by major central banks. The yield on the German 10-year government bond fell toward 2.5%, while the yield on 10-year UK government bonds also eased.
EUROZONE ECONOMY PICKS UP FROM RECESSION; CORE INFLATION SLOWS. Eurozone gross domestic product surprised to the upside, expanding 0.3% in the first quarter, after shrinking 0.1% in the final three months of 2023. The contraction registered in the fourth quarter of 2023 was a downward revision from 0.0%, meaning that the economy fell into a technical recession in the second half of last year. Meanwhile, annual consumer price growth was steady in April at 2.4%, but core inflation—which excludes energy and food prices—slowed to 2.7% from 2.9%.
European Central Bank (ECB) policymaker and Bank of France Governor François Villeroy de Galhau said that the latest data strengthened confidence that inflation would return to the 2% target by next year, suggesting that the ECB should be able to start lowering borrowing costs in June.
UK HOUSING MARKET RECOVERY SLOWS. Mortgage lenders in the UK approved 61,325 mortgages in March, up from 60,497 in February, according to the Bank of England. The increase to an 18-month high provided further evidence that the housing market began to recover this year. Still, the Nationwide Building Society’s house price index for April fell 0.4% sequentially, the second consecutive monthly decline and a sign that activity may be moderating.
NORGES BANK KEEPS RATES UNCHANGED. The Norwegian central bank held its key interest rate at 4.50%, saying it might have to keep borrowing costs higher for longer than previously envisaged to quell inflation.
JAPAN: As perceptions grew that Japanese authorities had intervened in the foreign exchange markets twice during the week to prop up the yen, Japanese stocks generated positive returns, with the Nikkei 225 Index rising 0.8% and the broader TOPIX Index gaining 1.6%. Changes in the Bank of Japan’s (BoJ’s) accounts suggested that such interventions had taken place, although the authorities refrained from confirming that they had finally acted with a view to halting the Japanese currency’s historic slump. The yen strengthened to around JPY 153 against the USD, from about JPY 158 at the end of the previous week.
Despite some intraweek volatility, the yield on the 10-year Japanese government bond finished the week broadly unchanged at the 0.9% level, near a six-month high. This was within the context of strong U.S. wage data raising concerns that the Federal Reserve will keep interest rates higher for longer. In March, the BoJ lifted interest rates from negative territory for the first time in seven years—with many now anticipating two further rate hikes within roughly a one-year period. Nevertheless, Japan’s monetary policy remains among the most accommodative in the world, and financial conditions are expected to remain accommodative also, for the time being.
CORPORATE EARNINGS BENEFIT FROM WEAK YEN, PRICE HIKES, TOURISM STRENGTH. On the corporate news front, the latest earnings season saw more than two-thirds of Japan’s large public companies report higher profits, according to an analysis of company earnings releases by the Nikkei news organization. Generally, solid profit growth was attributable to a range of factors including yen weakness, price hikes, and a rebound in inbound tourism. Many companies also felt the positive impact of developments relating to generative artificial intelligence (AI). However, some companies faced headwinds in the form of increased competition, particularly in China, and the negative effects of currency depreciation.
CHINA: Chinese stocks rose in a holiday-shortened week on hopes that the government will ramp up support. The Shanghai Composite Index gained 0.52%, while the blue chip CSI 300 edged up 0.56%. In Hong Kong, the benchmark Hang Seng Index added 4.67%, according to FactSet. Markets in mainland China were closed from Wednesday for the Labor Day Holiday and will reopen on Monday, May 6. Hong Kong markets were closed Wednesday but reopened Thursday.
China’s top decision-making body, the 24-member Politburo, pledged to implement prudent monetary and fiscal support to shore up demand at its April meeting last Tuesday. Officials stated that China would make flexible use of monetary policy tools to restore growth, including possible cuts to interest rates and the reserve requirement ratio, which sets the amount of cash that banks must set aside in reserve.
MANUFACTURING CONTINUES TO EXPAND. The official manufacturing Purchasing Managers’ Index (PMI) was a better-than-expected reading of 50.4 in April, down from March’s 50.8, marking the second straight monthly expansion. The nonmanufacturing PMI reached a below-consensus 51.2, easing from 53 in March, as new orders and services activity stalled from the prior month. Separately, the private Caixin/S&P Global survey of manufacturing activity edged up to a better-than-expected 51.4 in April, marking its 16th month of expansion.
Slowing industrial profits growth pointed to deflationary pressures that continue to weigh on China’s economy. Profits at industrial firms declined in March and advanced 4.3% in the first quarter of 2024 year over year, slowing from a 10.2% gain in the January to February period, according to the National Bureau of Statistics.
PROPERTY CRISIS PERSISTS. The value of new home sales by the country’s top 100 developers slumped 45% in April from the prior-year period, in line with March’s decline, according to the China Real Estate Information Corp. Transactions fell by 13% from the previous month. China’s housing downturn, now in its fourth year, remains a significant drag on the economy, as it has made consumers reluctant to spend and left developers with a massive supply of unfinished apartments.
Sources: All index and returns data from Norgate Data and Commodity Systems Incorporated and Wall Street Journal. News from Reuters, Barron’s, Wall St. Journal, Bloomberg.com, ft.com, guggenheimpartners.com, zerohedge.com, ritholtz.com, markit.com, financialpost.com, Eurostat, Statistics Canada, Yahoo! Finance, stocksandnews.com, marketwatch.com, visualcapitalist.com, wantchinatimes.com, BBC, 361capital.com, pensionpartners.com, cnbc.com, FactSet, Morningstar/Ibbotson Associates, Corporate Finance Institute. Commentary from T Rowe Price Global markets weekly update — https://www.troweprice.com/personal-investing/resources/insights/global-markets-weekly-update
Disclosures: This material is provided for informational purposes only and is not intended to be investment advice or a recommendation to take any action. Past performance cannot guarantee future results.
