


The very big picture (a historical perspective): The CAPE is now at 34.70 – UP this week 1.91% versus the beginning of May, 2024.
The long-term valuation of the market is commonly measured by the Cyclically Adjusted Price to Earnings ratio, or “CAPE”, which smooths-out shorter-term earnings swings in order to get a longer-term assessment of market valuation. In the past, the CAPE ratio has proved its importance in identifying potential bubbles and market crashes. An extremely high CAPE ratio means that a company’s stock price is substantially higher than the company’s earnings would indicate and, therefore, overvalued. It is generally expected that the market will eventually correct the company’s stock price by pushing it down to its true value. The historical average of the ratio for the S&P 500 Index is between 15-16, while the highest levels of the ratio have exceeded 30. The record-high levels occurred three times in the history of the U.S. financial markets. The first was in 1929 before the Wall Street crash that signaled the start of the Great Depression. The second was in the late 1990s before the Dotcom Crash, and the third came in 2007 before the 2007-2008 Financial Crisis. https://www.multpl.com/shiller-pe
HISTORY OF THE CAPE VALUE FROM 1871 TO PRESENT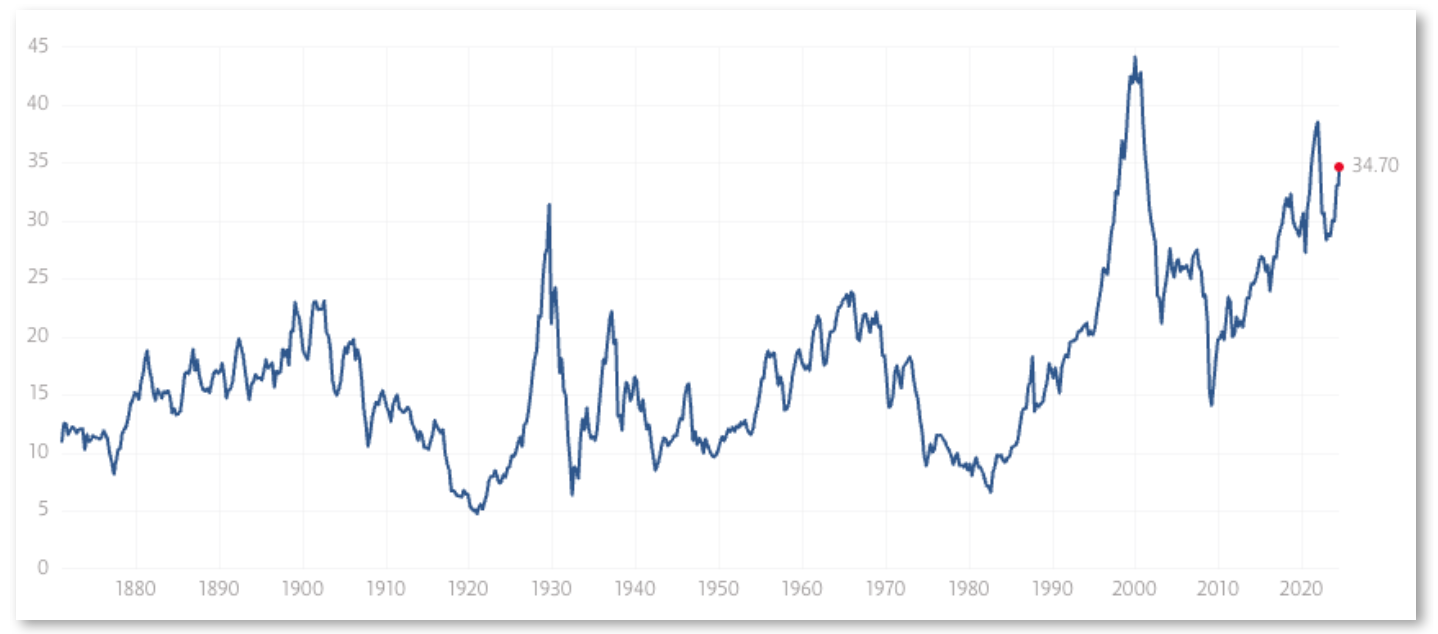
Note: We do not use CAPE as an official input into our methods. However, we think history serves as a guide and that it’s good to know where we are on the historic continuum. https://www.multpl.com/shiller-pe
The big picture: The ‘big picture’ is the (typically) years-long timeframe, the same timeframe in which Cyclical Bulls and Bears operate. The Sherman Portfolios DELTA-V Indicator measuring the Bull/Bear cycle finished the week in BULL status at 73.20, UP 2.19% from the prior week’s 71.63. We’ve been in a cyclical Bull Market since April 21, 2023. The shorter term picture: GALACTIC SHIELD — POSITIVE entering April 2024 (Q2) indicating positive prospects for equities in the second quarter of 2024. This indicator is based on the combination of U.S. and International Equities trend statuses at the start of each quarter. STARFLUX— POSITIVE since Nov 16, 2023 and ended the week of 5/17/24 at 8.25 (down 0.42). This short-term indicator measures U.S. Equities. STARPATH — POSITIVE since November 21, 2023. This indicator measures the interplay on dual timeframes of our Type 1s + the Russell 3000 + our four most ‘pro-cyclical’ Type 3s, vs. Cash.
The complete picture (four indicators across three timeframes): When all four of the Sherman Portfolios indicators are in a POSITIVE status, we read the market as being in a CYCLICAL BULL MARKET.
1. DELTA-V — Positive
2. GALACTIC SHIELD — Positive
3. STARFLUX— Positive
4. STARPATH — Positive
THIS WEEK IN THE MARKETS
U.S. Markets: LARGE-CAP INDEXES MOVE BACK TO RECORD HIGHS. The Dow Jones Industrial Average, S&P 500 Index, and Nasdaq Composite climbed to record highs during the week, with the Dow crossing the 40,000 threshold for the first time. As inflation and interest rate worries appeared to dissipate, growth stocks outperformed, perhaps due in part to the lower implied discount placed on future earnings.
INFLATION BREAKS STREAK OF UPSIDE SURPRISES. The major factor supporting sentiment appeared to be Wednesday’s release of the Labor Department’s April consumer price index (CPI), which came in at or modestly below expectations, in contrast to hotter-than-expected prints over the preceding three months. Headline prices rose 0.3% in April, a tick below expectations, while core (less food and energy) prices rose 0.3%, as expected. Inflation remained concentrated in services prices, especially transportation services costs, which rose 0.9% over the month and 11.2% over the past year.
Thursday’s retail sales figure also appeared to impress investors—if through the lens of bad news for the economy being treated as good news for stocks and inflation. The Commerce Department reported that retail sales were flat in April versus consensus estimates of a 0.4% gain, while downwardly revising its estimate of March sales lower, from +0.7% to +0.6%. The data included some evidence that consumers were pulling back on discretionary spending, with sales at non-store (mostly online) retailers falling 1.2%, while sales at restaurants and bars continued to moderate—and even fell slightly when taking account of higher prices (retail sales data are not adjusted for inflation).
Looking at the US Indexes: Nasdaq took the lead on gains this week in the below indexes with over 2% growth, with the small-cap Russell 2000 following closely behind.
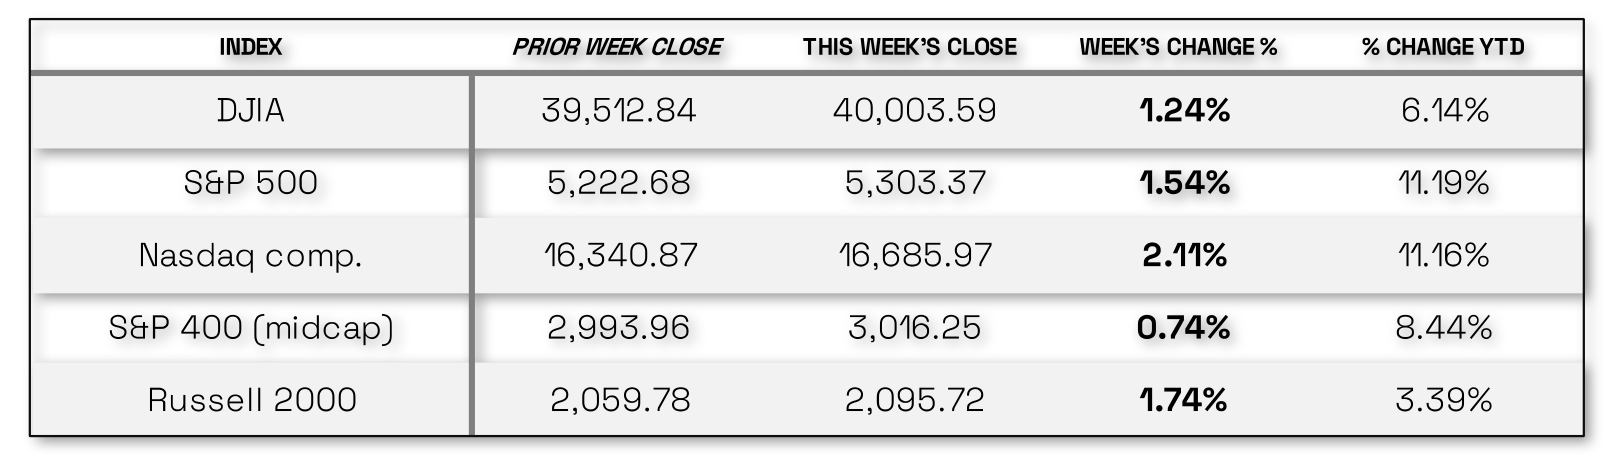
The Dow Jones Industrial Average (DJIA) is the oldest continuing U.S. market index with over 100 years of history and is made up of 30 highly reputable “blue-chip” U.S. stocks (e.g. Coca-Cola Co., Microsoft).The Dow has continues to enjoy further gains, this week boasting a new all-time record high. At market-close this week, the DJIA, gained 1.24%, ending the week of May 17 at 40,003.59 vs the prior week of 39,512.84.
The Nasdaq Composite Index tracks most of the stocks listed on the Nasdaq Stock Market – the second-largest stock exchange in the world. Over half of all stocks on the NASDAQ are tech stocks. The tech-driven Nasdaq was a leader in index performance this week with a lift of 2.11%. The index closed this week at 16,685.97 vs. the prior week of 16,340.87.
The S&P 500 large-cap index is a market-capitalization-weighted index of 500 leading publicly traded companies in the U.S. The S&P 500 is regarded as one of the best gauges of prominent American equities’ performance, and by extension, that of the stock market overall. Another good week for the large-cap S&P 500 with a week’s growth of 1.54% to end at 5,303.37 vs last week’s close of 5,222.68 and now above the10% growth YTD mark (11.19).
The S&P 400 mid-cap index is the benchmark index made up of 400 stocks that broadly represent companies with midrange market capitalization between $3.6 billion and $13.1 billion. It is used by investors as a gauge for market performance and directional trends in U.S. stocks. The S&P 400 mid-cap slowed a little this week in its upward momentum but still gained a modest 0.74%. The index closed at 3,016.25 vs last week’s 2,993.96 and is now chasing down 10% YTD returns.
The Russell 2000 (RUT) small-cap index measures the performance of the 2,000 smaller companies included in the Russell 3000 Index. The Russell 2000 is managed by London’s FTSE Russell Group and is widely regarded as a leading indicator of the U.S. economy because of its focus on smaller companies that focus on the U.S. market. The Russel 2000 wasn’t far behind the 2% growth mark for the week, with gains of 1.74% and closing at 2,095.72 vs last week’s close of 2,059.78 and YTD growth now at 3.39%.
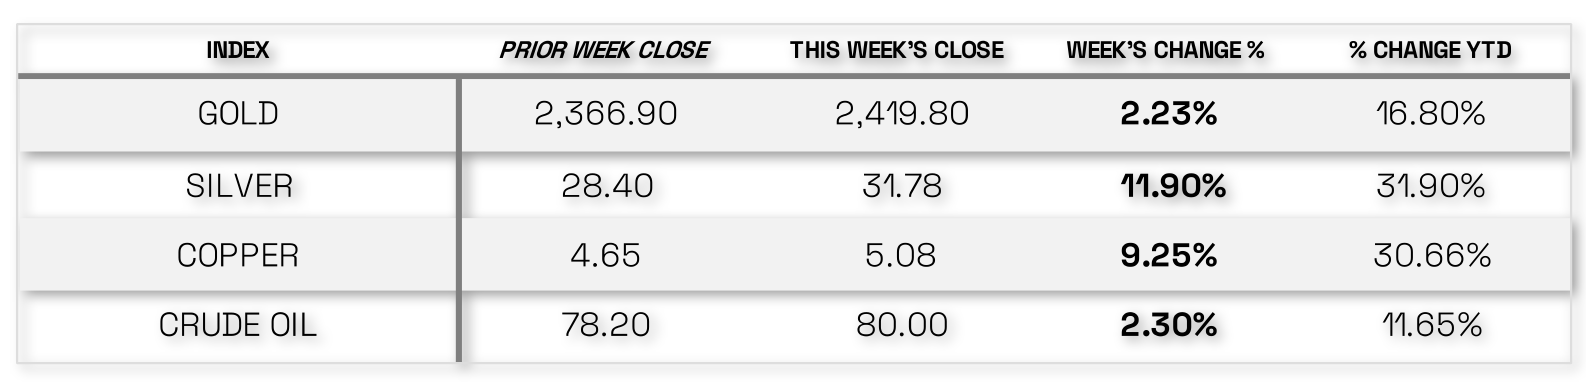
U.S. Commodities/Futures: It was a huge week for Commodities, with massive gains for Silver and Copper earning almost 12% and 10% respectively. All Commodity indexes below enjoyed a week of gains.
VIX closed at 11.99 this week, a 4.46% decrease over last week’s close of 12.55.
International Markets:
THIS WEEK’S ECONOMIC NEWS
U.S. Economic News: LONG-TERM U.S. TREASURY YIELDS FALL ON GROWTH AND INFLATION NEWS. The downside inflation and growth surprises helped drive the yield on the benchmark 10-year U.S. Treasury note to its lowest level in over a month at midweek. (Bond prices and yields move in opposite directions.) The tax-exempt municipal bond market absorbed another heavy week of new issuance, with the new deals generally seeing strong demand. According to traders, this busy primary calendar, coupled with uncertainty ahead of midweek inflation data releases, appeared to limit activity in the secondary market.
According to Traders, spreads initially widened in the investment-grade bond market before tightening in the latter half of the week. Issuance was front-end heavy with few issues oversubscribed. High yield bonds also benefited from the rate moves, and traders noted that trade volumes picked up following the encouraging inflation data. Below investment-grade funds reported positive flows.
Traders reported that the leveraged loan market was mostly unchanged as the market digested the slightly softer-than-anticipated CPI print and weaker-than-expected retail sales report. They noted that most primary market deals were refinancing- or repricing-based transactions.
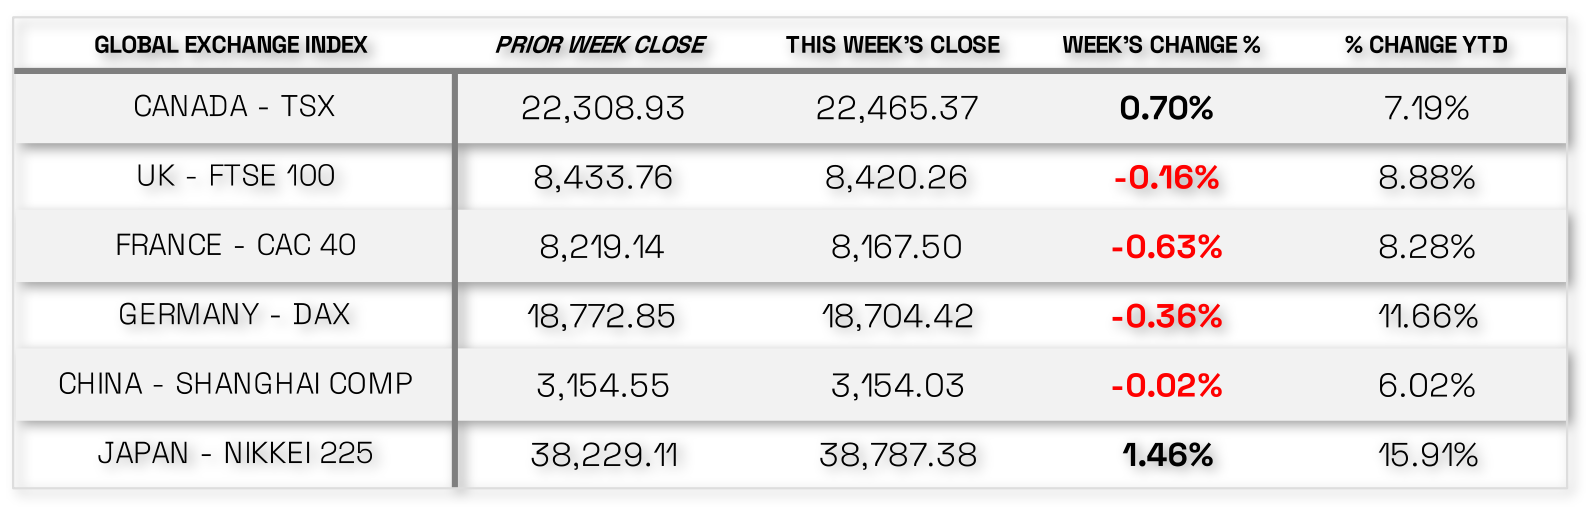
International Economic News: In local currency terms, the pan-European STOXX Europe 600 Index rose 0.42% but slipped from the record high hit during the week. Cautious comments from European Central Bank (ECB) members appeared to cool optimism about the extent to which monetary policy might ease this year. Major stock indexes were mixed. Germany’s DAX fell 0.36%, while France’s CAC 40 Index declined 0.63%. Italy’s FTSE MIB advanced 2.14%. In the UK, the FTSE 100 Index finished modestly lower.
UK PAY GROWTH STILL STRONG, BUT WIELADEK SAYS LOOSER LABOR MARKET MEANS JUNE RATE CUT POSSIBLE. The annual rate of pay growth, excluding bonuses, was unchanged at 6% in the three months through March, which was slightly higher than forecast. In the private sector, regular pay growth came in at 5.9%, slightly less than expected by the Bank of England, which monitors the measure. The labor market, however, appeared to slacken. The main unemployment rate rose to 4.3%, while job openings declined for a 22nd consecutive month.
T. Rowe Price European Economist Tomasz Wieladek believes that, overall, the data tentatively support a reduction in interest rates in June, as a transition to a looser labor market appears now to be underway. However, he cautions that policymakers will need to digest a few more data releases before deciding whether to ease rates.
ECB POLICYMAKERS ADVOCATE CAUTION ON RATE PATH. ECB policymakers Francois Villeroy de Galhau, Madis Muller, and Martins Kazaks indicated that a rate cut is likely in June but that the path thereafter is uncertain. Executive Board member Isabel Schnabel told the Nikkei newspaper that the current data did not justify another reduction in July, in part because the disinflation process appears to have slowed significantly. Belgian central bank Governor Pierre Wunsch told the Handelsblatt newspaper “the first half a percentage point of interest rate cuts is close to a no brainer” but slower policy easing by the Federal Reserve could delay further moves. He stressed that he was not backing a second rate cut in July.
EUROZONE INDUSTRIAL OUTPUT RISES FOR SECOND MONTH. Eurozone industrial production rose for a second month running in March, increasing 0.6% sequentially. However, the stronger-than-expected reading was driven by a jump in Ireland’s output, a data point that historically has been quite volatile.
JAPAN: Japanese equities finished the week higher, with the Nikkei 225 Index gaining 1.5% and the broader TOPIX Index up 0.6%. This was despite a backdrop of economic weakness and a range-bound yen on expectations of U.S. interest rate cuts in contrast to tentative hawkishness on the part of the Bank of Japan (BoJ), the latter also sending Japanese government bond (JGB) yields modestly higher.
ECONOMIC GROWTH CONTRACTS MORE THAN EXPECTED. Investors appeared to shrug off weakness in Japan’s economy, as signaled by a weaker-than-expected first-quarter gross domestic product print—a 2.0% annualized contraction on the previous three-month period—which was driven in part by the negative impact on growth of the earthquake that hit the Noto peninsula in January, as well as the suspension of some auto production activity. Other areas of weakness included capital expenditure and external demand, while, conversely, strength in public demand and private inventories lent support.
YEN RANGE-BOUND AMID EXPECTATIONS OF REDUCED INTEREST RATE DIFFERENTIAL. The yen finished the week broadly unchanged in the high-JPY 155 range against the USD. This was within the context of expectations that the U.S. Federal Reserve could cut interest rates twice this year, while the BoJ is widely anticipated to embark on further monetary policy normalization—thereby leading to a reduced interest rate differential between the two economies. Such an eventuality could lend support to the yen, which continues to languish at historic lows despite investors converging around the view that Japanese authorities recently intervened twice in the foreign exchange markets to prop up the currency.
BOJ REDUCES BOND PURCHASES, EXERTING MODEST UPWARD PRESSURE ON YIELDS. The yield on the 10-year JGB rose to 0.94%, from 0.91% at the end of the previous week. Upward pressure on yields was at least temporarily exerted by hawkish signals from the BoJ, as it reduced the amount of JGBs it offered to buy in a regular purchase operation. However, a reduction in purchases had been widely anticipated, which meant that the rise in yields was only modest.
CHINA: Chinese equities were little changed after the central government unveiled on Friday a historic rescue package to stabilize the country’s ailing property sector. The Shanghai Composite Index was broadly flat, while the blue chip CSI 300 added 0.32%. In Hong Kong, the benchmark Hang Seng Index gained 3.11%, according to FactSet.
The People’s Bank of China (PBOC) lowered the minimum down payment ratio by 5% to 15% for first-time buyers and to 25% for second home purchases in an attempt to ignite demand. The PBOC also said that it would scrap the nationwide floor level of mortgage rates and allow cities to make their own decisions on what mortgage rates to charge. Under a so-called re-lending program, the central bank said it would extend RMB 300 billion in low-cost funds to a select group of state-owned banks to lend to local state-owned entities for the purchase of unsold homes.
The unprecedented support package came as data showed no sign of turnaround in China’s years long housing crisis. New home prices in China fell by 0.6% month on month in April, according to the statistics bureau, marking the 10th straight monthly decline and the steepest drop since November 2014. Real estate investment fell a higher-than-expected 9.8% in the January-to-April period from a year earlier, following a 9.5% drop in the first quarter.
Inflation data showed that deflationary pressure continued to weigh on China’s economy. China’s consumer price index rose 0.3% in April from a year ago, accelerating from March’s 0.1% increase and marking the third consecutive positive reading. However, the producer price index fell 2.5% from a year ago compared with a 2.8% drop in March.
Other data also showed an uneven recovery for China’s economy. Industrial production rose an above-forecast 6.7% in April from a year earlier, accelerating from March’s 4.5% increase. However, fixed-asset investment and retail sales both increased less than expected, underscoring anemic domestic demand. The urban unemployment rate fell to 5.0% from 5.2% in March.
Sources: All index and returns data from Norgate Data and Commodity Systems Incorporated and Wall Street Journal >> News from Reuters, Barron’s, Wall St. Journal, Bloomberg.com, ft.com, guggenheimpartners.com, zerohedge.com, ritholtz.com, markit.com, financialpost.com, Eurostat, Statistics Canada, Yahoo! Finance, stocksandnews.com, marketwatch.com, visualcapitalist.com, wantchinatimes.com, BBC, 361capital.com, pensionpartners.com, cnbc.com, FactSet, Morningstar/Ibbotson Associates, Corporate Finance Institute >> Commentary from T Rowe Price Global markets weekly update — https://www.troweprice.com/personal-investing/resources/insights/global-markets-weekly-update
Disclosures: This material is provided for informational purposes only and is not intended to be investment advice or a recommendation to take any action. Past performance cannot guarantee future results.
