


The very big picture (a historical perspective): The CAPE is now at 34.71 – now up this month 1.94% versus the beginning of May, 2024.
The long-term valuation of the market is commonly measured by the Cyclically Adjusted Price to Earnings ratio, or “CAPE”, which smooths-out shorter-term earnings swings in order to get a longer-term assessment of market valuation. In the past, the CAPE ratio has proved its importance in identifying potential bubbles and market crashes. An extremely high CAPE ratio means that a company’s stock price is substantially higher than the company’s earnings would indicate and, therefore, overvalued. It is generally expected that the market will eventually correct the company’s stock price by pushing it down to its true value. The historical average of the ratio for the S&P 500 Index is between 15-16, while the highest levels of the ratio have exceeded 30. The record-high levels occurred three times in the history of the U.S. financial markets. The first was in 1929 before the Wall Street crash that signaled the start of the Great Depression. The second was in the late 1990s before the Dotcom Crash, and the third came in 2007 before the 2007-2008 Financial Crisis. https://www.multpl.com/shiller-pe
HISTORY OF THE CAPE VALUE FROM 1871 TO PRESENT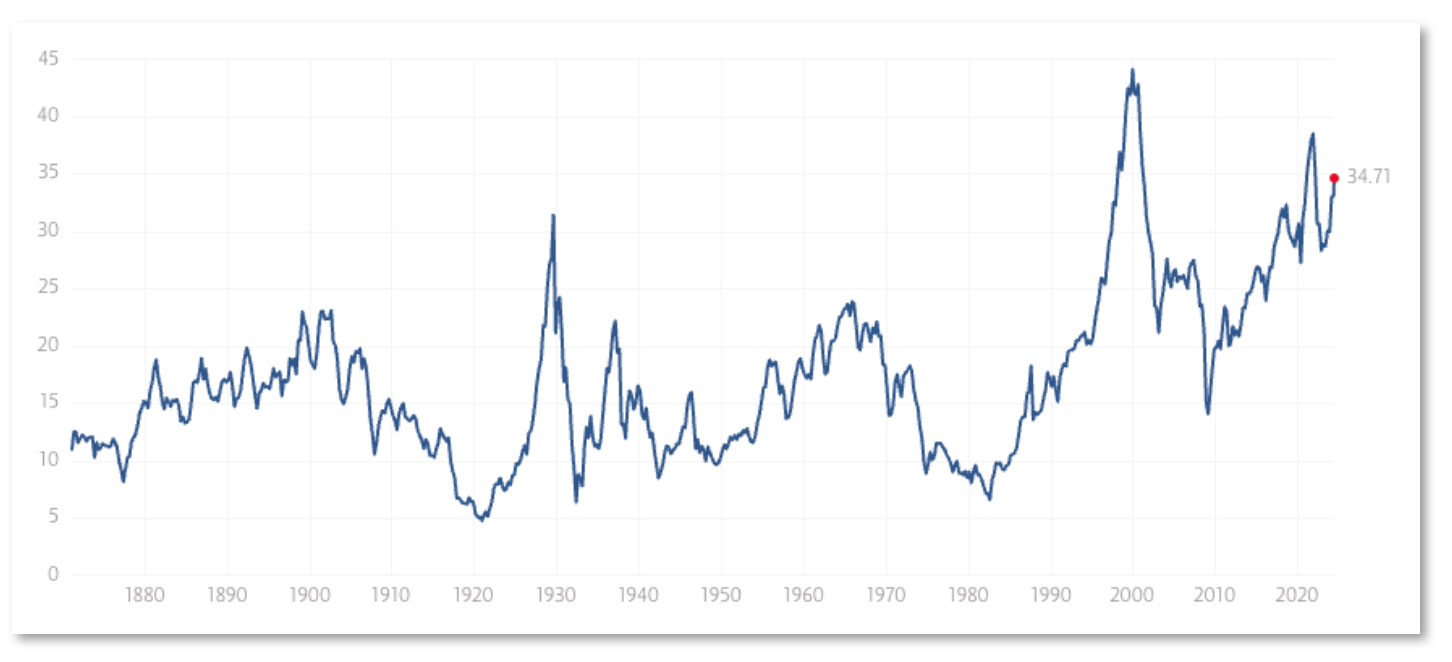
Note: We do not use CAPE as an official input into our methods. However, we think history serves as a guide and that it’s good to know where we are on the historic continuum. https://www.multpl.com/shiller-pe
The big picture: The ‘big picture’ is the (typically) years-long timeframe, the same timeframe in which Cyclical Bulls and Bears operate. The Sherman Portfolios DELTA-V Indicator measuring the Bull/Bear cycle finished the week in BULL status at 74.22, up 1.39% from the prior week’s 73.20. We’ve been in a cyclical Bull Market since April 21, 2023.
The shorter term picture: GALACTIC SHIELD — POSITIVE entering April 2024 (Q2) indicating positive prospects for equities in the second quarter of 2024. This indicator is based on the combination of U.S. and International Equities trend statuses at the start of each quarter. STARFLUX— POSITIVE since Nov 16, 2023 and ended the week of 5/24/24 at 7.42 (up 0.63). This short-term indicator measures U.S. Equities. STARPATH — POSITIVE since November 21, 2023. This indicator measures the interplay on dual timeframes of our Type 1s + the Russell 3000 + our four most ‘pro-cyclical’ Type 3s, vs. Cash.
The complete picture (four indicators across three timeframes): When all four of the Sherman Portfolios indicators are in a POSITIVE status, we read the market as being in a CYCLICAL BULL MARKET.
1. DELTA-V — Positive
2. GALACTIC SHIELD — Positive
3. STARFLUX— Positive
4. STARPATH — Positive
THIS WEEK IN THE MARKETS
U.S. Markets: NASDAQ HITS NEW RECORDS WHILE DOW SUFFERS WORST WEEK SINCE EARLY APRIL. The major indexes recorded widely varying results over the week, with the Dow Jones Industrial Average recording its biggest weekly loss (-2.33%) since early April, while the technology-heavy Nasdaq Composite continued its recent march into record territory. The broad S&P 500 Index was roughly flat, while small-cap stocks lost ground. The disparate returns were also reflected in the substantial underperformance of an equal-weighted version of the S&P 500 Index, which trailed its more familiar, market-weighted counterpart by 127 basis points (1.27 percentage points). The market was scheduled to be closed the following Monday in observance of the Memorial Day holiday.
NVIDIA BEATS ESTIMATES. A primary factor driving the market’s divergence was the gain in shares of artificial intelligence chipmaker NVIDIA, now the third-largest company in the S&P 500 by market capitalization (trailing only Apple and Microsoft). The company reported its first-quarter earnings after the close of trading Wednesday, but T. Rowe Price traders noted that anticipation over the report seemed to play an important role in driving sentiment even earlier in the week. (As of Tuesday, Bank of America noted that NVIDIA had accounted for 37% of the S&P 500’s earnings-per-share gains over the previous 12 months, while Bloomberg reported that the stock had been responsible for 25% of the S&P’s 11.3% gain for the year-to-date period.) After beating consensus estimates, NVIDIA shares rose 9.3% on Thursday, adding roughly USD 220 billion to its market capitalization.
The good news for NVIDIA did not translate into broader gains for the market. Nearly 90% of the stocks in the S&P 500 closed lower in the Thursday session, seemingly due to data suggesting a rebound in growth in May—leading, in turn, to speculation that the Federal Reserve would wait longer to cut interest rates. S&P Global reported that its composite index of business activity had jumped unexpectedly to 54.4 in May, its highest level in just over two years. (Readings above 50 indicate expansion.) While manufacturing activity picked up somewhat, the acceleration was particularly notable in the much larger services sector.
Looking at the US Indexes: After a big drop to the Dow mid-week, the index ended down over 2% WoW. The Nasdaq and large-cap S&p 500 were the only indexes this week that didn’t post a loss.
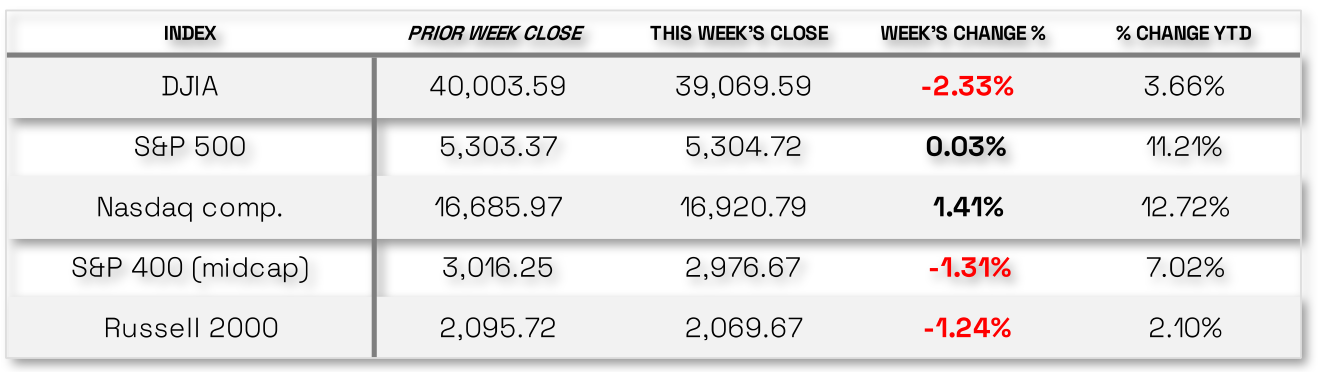
The Dow Jones Industrial Average (DJIA) is the oldest continuing U.S. market index with over 100 years of history and is made up of 30 highly reputable “blue-chip” U.S. stocks (e.g. Coca-Cola Co., Microsoft). The Dow officially ended its winning streak this week, doing so with a more than 2% reversal. DJIA, lost 2.33, ending the week of May 24 at 39,069.59 vs the prior week of 40,003.59.
The Nasdaq Composite Index tracks most of the stocks listed on the Nasdaq Stock Market – the second-largest stock exchange in the world. Over half of all stocks on the NASDAQ are tech stocks. The tech-driven Nasdaq led the index growth this week with the only substantial gains of the group – the index gained 1.41% by closing this week, ending at 16,920.79 vs. the prior week of 16,685.97.
The S&P 500 large-cap index is a market-capitalization-weighted index of 500 leading publicly traded companies in the U.S. The S&P 500 is regarded as one of the best gauges of prominent American equities’ performance, and by extension, that of the stock market overall. Of the 3 here, only S&P 500 avoided losses this week, and even then only marginally more than remaining flat. The large-cap S&P 500 saw small gains this week of 0.03% ending at 5,304.72 vs last week’s close of 5,303.37.
The S&P 400 mid-cap index is the benchmark index made up of 400 stocks that broadly represent companies with midrange market capitalization between $3.6 billion and $13.1 billion. It is used by investors as a gauge for market performance and directional trends in U.S. stocks. The S&P 400 mid-cap changed its positive momentum this week reporting losses of -1.31%. The index closed at 2,976.67 vs last week’s 3,016.25, slowing its move toward a 10% YTD return.
The Russell 2000 (RUT) small-cap index measures the performance of the 2,000 smaller companies included in the Russell 3000 Index. The Russell 2000 is managed by London’s FTSE Russell Group and is widely regarded as a leading indicator of the U.S. economy because of its focus on smaller companies that focus on the U.S. market. The Russel 2000 joined the midcap index also reporting more than 1% loss contraction. This left the small-cap index with losses of -1.24% and closing at 2,069.67 vs last week’s close of 2,095.72.
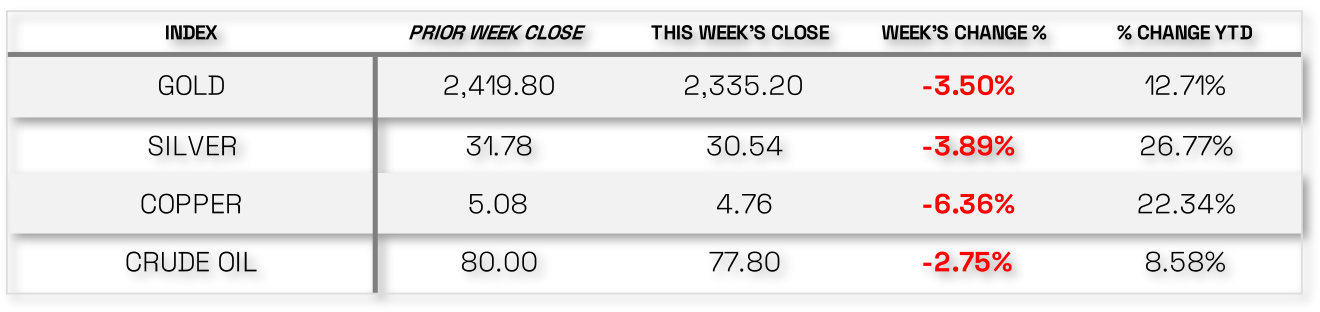
U.S. Commodities/Futures: In a total change of events versus last week, Commodities all reversed trajectory and saw losses across the board.
VIX closed at 11.93 this week, a 0.5% decrease over last week’s close of 11.99.
International Markets:
THIS WEEK’S ECONOMIC NEWS
U.S. Economic News: MANUFACTURERS SEE RISING COSTS. Inflation data in the report appeared to especially concern investors. “Selling price inflation has meanwhile ticked higher and continues to signal modestly above-target inflation,” S&P Global’s chief economist noted. “What’s interesting is that the main inflationary impetus is now coming from manufacturing rather than services, meaning rates of inflation for costs and selling prices are now somewhat elevated…[suggesting] that the final mile down to the Fed’s 2% target still seems elusive.”
Friday brought further evidence that growth might be picking up in the second quarter. The Commerce Department reported that orders for durable goods excluding the volatile aircraft and defense orders—typically considered an indicator of business capital investment—rose a more-than-expected 0.3% in April, after remaining roughly flat over the first three months of the year.
Conversely, sales of both existing and new homes, reported Wednesday and Thursday, respectively, were below expectations in April.
The S&P Global data appeared to drive a modest rise in longer-term bond yields, while futures markets began pricing in only a 39.9% chance of more than one Fed rate cut this year, down from 57.3% the week before, according to the CME FedWatch Tool. (Bond prices and yields move in opposite directions.) Tax-exempt municipal bond yields ended the week higher across the curve—with yields in the front and intermediate portions rising most prominently—amid heavy new issuance and cash outflows. Within the primary market, Traders observed healthy oversubscription among longer-maturity bonds, while demand was generally slower for bonds in the intermediate part of the curve.
Conversely, issuance was in line with expectations in the investment-grade corporate bond market. Spreads hovered around either side of unchanged throughout the week, and issues were largely oversubscribed. Traders reported that the softer macro backdrop, partly due to the prospect of near-term Fed rate cuts fading, led to some weakness among high yield bonds. Otherwise, investors seemed to continue focusing on the busy primary calendar. Traders noted that new deal announcements and trade activity slowed ahead of the long weekend as the market worked through the outstanding transactions.
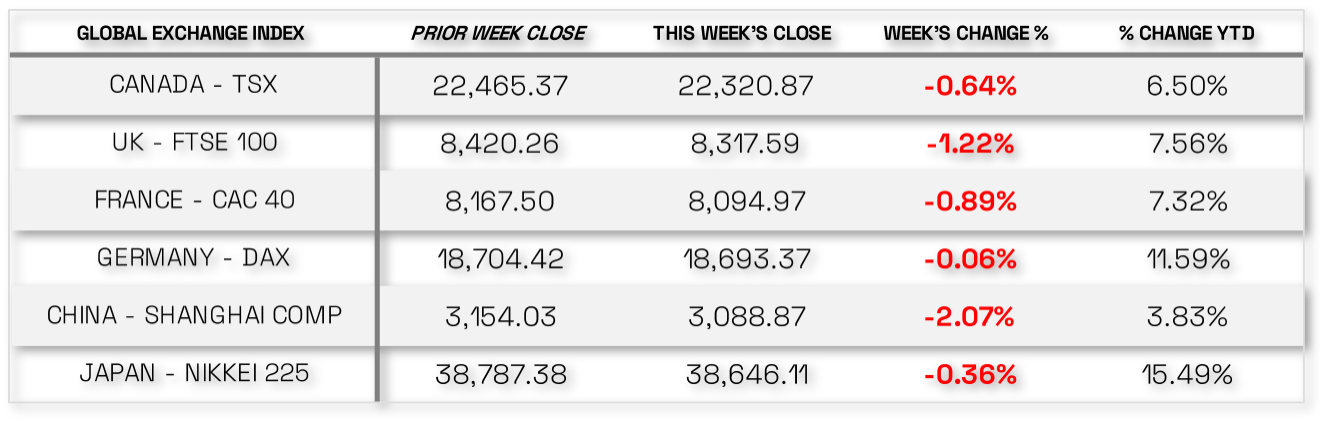
International Economic News: In local currency terms, the pan-European STOXX Europe 600 Index ended 0.45% lower, as questions emerged about the pace of potential interest rate cuts this year. Major stock indexes were mixed. Italy’s FTSE MIB lost 2.57%, while France’s CAC 40 Index declined 0.89%. Germany’s DAX was little changed. The UK’s FTSE 100 Index slid 1.22%.
UK INFLATION SLOWS LESS THAN EXPECTED; MARKETS SCALE BACK RATE CUT BETS. Annual growth in the UK consumer prices slowed less sharply than expected to 2.3% in April—the lowest level in almost three years—from 3.2% in March, dampening hopes that the Bank of England (BoE) would lower borrowing costs midyear. The consensus and BoE projection had pegged headline inflation at 2.1%. Core inflation, which excludes volatile energy and food prices, also surprised on the upside at 3.9%. T. Rowe Price traders said financial markets appeared to be pricing in only one quarter-point rate cut this year instead of two.
EUROZONE PMI, NEGOTIATED WAGES STRONGER THAN EXPECTED. The first estimate of eurozone composite purchasing managers’ index (PMI) for May came in at a 12-month high of 52.3, up from 51.7 in April. (PMI readings greater than 50 indicate an increase in activity.) Services activity remained firmly in expansionary territory; manufacturing PMI improved but remained at contractionary levels for the 14th consecutive month. Input costs and output prices eased from April’s levels but remained above pre-pandemic averages.
The European Central Bank (ECB) said negotiated wages in the first quarter rose 4.7% year over year, partly due to one-off payments, up from 4.5% in the final three months of 2023. ECB economists said in a blog post that they expect negotiated wage growth to remain elevated in 2024, although they also believe wage pressures are set to decelerate.
ECB’S LAGARDE: “STRONG LIKELIHOOD” OF JUNE RATE CUT. ECB President Christine Lagarde said in an interview with Irish television channel RTE that there was a “strong likelihood” that the central bank would reduce interest rates in June. Asked if people should expect a rate cut at the next ECB meeting, she replied: “No predicament, no prescription, no commitment, but it is a case that if the data that we receive reinforce the confidence level that we have—that we will deliver 2% inflation in the medium term, which is our objective, our mission, our duty—there is a strong likelihood.”
JAPAN: Japanese equities finished the week lower, with the Nikkei 225 Index falling 0.36% and the broader TOPIX Index experiencing a marginal decline. Equities were supported by upbeat economic data releases and a stellar earnings update from U.S. chip giant NVIDIA, which helped lift Japanese tech stocks. However, all gains were lost on Friday as Japanese indexes tracked Wall Street lower after U.S. data pushed the potential for a U.S. interest rate cut further out. It was a notable week for Japanese bond markets as 10-year government bond yields reached the 1.0% level for the first time in 11 years.
ECONOMIC UPDATES WERE FEW, BUT ENCOURAGING. Flash economic data released during the week showed Japanese manufacturing activity recovered in May, expanding for the first time in more than a year. The manufacturing PMI climbed to 50.5 this month, up from 49.6 in April. In contrast, the services PMI eased a little in May, falling to 53.6 from 54.3 the prior month but remaining in healthy expansive territory.
THE “NORMALIZING” OF JAPAN’S BOND MARKET CONTINUES. Japanese government bond yields continued their steady grind higher—a trend that has seen more than 25 basis points added to 10-year yields since the end of March, when the Bank of Japan (BoJ) lifted interest rates for the first time since 2007. Speculation about the timing of a next tightening move, as well as a possible reduction in the government’s bond purchase program, pushed benchmark yields to 1.0% on Wednesday.
HOW TO LIFT A YEN-SHAPED ANCHOR?. The BoJ has adopted a decidedly more hawkish tone in recent weeks, in part, to try and help jolt the Japanese currency from its protracted slump. With the yen currently trading around 24-year lows, fears are that this will undermine emerging Japanese inflation and, in turn, the prospect of any wage increases. However, robust data and hawkish minutes from the Federal Reserve’s last policy meeting did not help matters, boosting the U.S. dollar and causing the yen to close the week softer in comparison, at around JPY 157 levels.
CHINA: Chinese stocks retreated as fears that rates would remain elevated in the U.S. offset optimism about Beijing’s latest measures to shore up the ailing property sector. The Shanghai Composite Index declined 2.07%, while the blue chip CSI 300 lost 2.08%. In Hong Kong, the benchmark Hang Seng Index fell 4.83%, according to FactSet.
The People’s Bank of China (PBOC) announced a historic rescue package for the property sector in the prior week as data showed no sign of letup in China’s housing crisis. Measures included a re-lending program that would extend RMB 300 billion in low-cost funds to a select group of state-owned banks to lend to local state-owned entities for buying unsold homes, removing the nationwide floor level of mortgage rates, and lowering the minimum down payment ratio for home purchases. While most investors welcomed the plan, some remained skeptical on whether it will draw a line under the property slump, which remains a key drag on the world’s second-largest economy.
On the monetary policy front, Chinese banks left their one- and five-year loan prime rates unchanged at 3.45% and 3.95%, respectively, as expected, after the PBOC kept its medium-term lending rate on hold. Some analysts anticipated that the central bank will continue to loosen policy this year and potentially reduce its reserve requirement ratio again, following a surprise cut in January, to spur demand.
Sources: All index and returns data from Norgate Data and Commodity Systems Incorporated and Wall Street Journal >> News from Reuters, Barron’s, Wall St. Journal, Bloomberg.com, ft.com, guggenheimpartners.com, zerohedge.com, ritholtz.com, markit.com, financialpost.com, Eurostat, Statistics Canada, Yahoo! Finance, stocksandnews.com, marketwatch.com, visualcapitalist.com, wantchinatimes.com, BBC, 361capital.com, pensionpartners.com, cnbc.com, FactSet, Morningstar/Ibbotson Associates, Corporate Finance Institute >> Commentary from T Rowe Price Global markets weekly update — https://www.troweprice.com/personal-investing/resources/insights/global-markets-weekly-update
Disclosures: This material is provided for informational purposes only and is not intended to be investment advice or a recommendation to take any action. Past performance cannot guarantee future results.
