


The very big picture (a historical perspective): The CAPE is now at 34.18 – UP this week 0.38% versus the beginning of May, 2024.
The long-term valuation of the market is commonly measured by the Cyclically Adjusted Price to Earnings ratio, or “CAPE”, which smooths-out shorter-term earnings swings in order to get a longer-term assessment of market valuation. In the past, the CAPE ratio has proved its importance in identifying potential bubbles and market crashes. An extremely high CAPE ratio means that a company’s stock price is substantially higher than the company’s earnings would indicate and, therefore, overvalued. It is generally expected that the market will eventually correct the company’s stock price by pushing it down to its true value. The historical average of the ratio for the S&P 500 Index is between 15-16, while the highest levels of the ratio have exceeded 30. The record-high levels occurred three times in the history of the U.S. financial markets. The first was in 1929 before the Wall Street crash that signaled the start of the Great Depression. The second was in the late 1990s before the Dotcom Crash, and the third came in 2007 before the 2007-2008 Financial Crisis. https://www.multpl.com/shiller-pe
HISTORY OF THE CAPE VALUE FROM 1871 TO PRESENT
Note: We do not use CAPE as an official input into our methods. However, we think history serves as a guide and that it’s good to know where we are on the historic continuum. https://www.multpl.com/shiller-pe
The big picture: The ‘big picture’ is the (typically) years-long timeframe, the same timeframe in which Cyclical Bulls and Bears operate. The Sherman Portfolios DELTA-V Indicator measuring the Bull/Bear cycle finished the week in BULL status at 71.63, UP 3.6% from the prior week’s 69.14. We’ve been in a cyclical Bull Market since April 21, 2023.
The shorter term picture: GALACTIC SHIELD — POSITIVE entering April 2024 (Q2) indicating positive prospects for equities in the second quarter of 2024. This indicator is based on the combination of U.S. and International Equities trend statuses at the start of each quarter. STARFLUX— POSITIVE since Nov 16, 2023 and ended the week of 5/10/24 at 5.79 (up 0.04). This short-term indicator measures U.S. Equities. STARPATH — POSITIVE since November 21, 2023. This indicator measures the interplay on dual timeframes of our Type 1s + the Russell 3000 + our four most ‘pro-cyclical’ Type 3s, vs. Cash.
The complete picture (four indicators across three timeframes): When all four of the Sherman Portfolios indicators are in a POSITIVE status, we read the market as being in a CYCLICAL BULL MARKET.
1. DELTA-V — Positive
2. GALACTIC SHIELD — Positive
3. STARFLUX— Positive
4. STARPATH — Positive
THIS WEEK IN THE MARKETS
U.S. Markets: STOCKS CLIMB BACK TOWARD RECORD HIGHS ON LIGHT VOLUMES.The S&P 500 Index neared its all-time high and recorded its third consecutive week of gains. The other major indexes also advanced, with value stocks generally outperforming growth shares. Traders noted that market volumes were especially low over much of the week, however, with Wednesday marking the lowest notional (in terms of the value of shares traded) session of the year and its third-lightest volume (in terms of number of shares traded) session.
The quiet trading week appeared to reflect a generally light and unsurprising economic calendar, although some individual stocks moved sharply in reply to first-quarter earnings releases. Most prominently, perhaps, Walt Disney shares fell 9.5% on Tuesday after the company beat earnings estimates but warned that subscriber growth in its online streaming business was likely to slow. Likewise, a prediction for slowing revenue growth appeared to lead to an 18.6% drop in shares of online retail platform Shopify on Wednesday.
Looking at the US Indexes: The major indexes continued their upward momentum with the DOW and mid-cap both gaining 2%+ for the week.

The Dow Jones Industrial Average (DJIA) is the oldest continuing U.S. market index with over 100 years of history and is made up of 30 highly reputable “blue-chip” U.S. stocks (e.g. Coca-Cola Co., Microsoft). The Dow has bounced back over the past 3 weeks with this week’s positive momentum pushing over 2% gains. By market-close this week, the DJIA, gained 2.16%, ending the week of May 10 at 39,512.84 vs the prior week of 38,675.68.
The Nasdaq Composite Index tracks most of the stocks listed on the Nasdaq Stock Market – the second-largest stock exchange in the world. Over half of all stocks on the NASDAQ are tech stocks. The tech-driven Nasdaq, maintained a similar growth trajectory as the prior week with solid gains of 1.14%, closing at 16,340.87 vs. the prior week of 16,156.33.
The S&P 500 large-cap index is a market-capitalization-weighted index of 500 leading publicly traded companies in the U.S. The S&P 500 is regarded as one of the best gauges of prominent American equities’ performance, and by extension, that of the stock market overall. The large-cap S&P 500 was on the heels of 2% growth this week, not far behind the DOW, enjoying gains of 1.85% and closing at 5,222.68 vs last week’s close of 5,127.79 now almost at 10% growth YTD (9.49%).
The S&P 400 mid-cap index is the benchmark index made up of 400 stocks that broadly represent companies with midrange market capitalization between $3.6 billion and $13.1 billion. It is used by investors as a gauge for market performance and directional trends in U.S. stocks. The S&P 400 mid-cap lead the way in the above indexes this week with a growth of 2.22% by market close ending at 2,993.96 vs last week’s 2,929.04.
The Russell 2000 (RUT) small-cap index measures the performance of the 2,000 smaller companies included in the Russell 3000 Index. The Russell 2000 is managed by London’s FTSE Russell Group and is widely regarded as a leading indicator of the U.S. economy because of its focus on smaller companies that focus on the U.S. market. The Russel 2000 maintained positive momentum again this week, further developing its YTD growth. RUT gained 1.18% closing at 2,059.78 vs last week’s close of 2,035.72 with the YTD growth now at 1.61%.
U.S. Commodities/Futures: Commodities joined with the indexes this week with gains across the board. Silver was the clear leader with over 6% growth while Crude Oil was a little under one-percent.
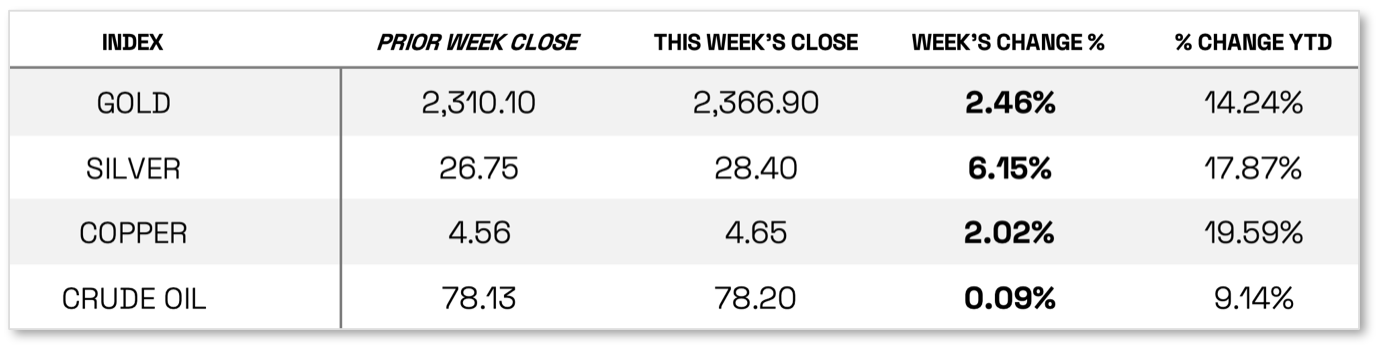
VIX closed at 12.55 this week, a 6.97% decrease over last week’s close of 13.49.
International Markets:
THIS WEEK’S ECONOMIC NEWS
U.S. Economic News: JOBLESS CLAIMS HIT HIGHEST LEVEL SINCE AUGUST. A surprise rise in weekly jobless claims seemed to dominate the week’s sparse economic calendar—at least in the eyes of investors. The number of people claiming unemployment benefits rose to 231,000 in the week ended the previous Wednesday, its highest since last August. Likewise, continuing claims broke a four-week downward streak and rose to 1.79 million.
Friday brought another sign that the labor market and broader economy might be cooling. Before the start of trading, the University of Michigan reported that its preliminary index of consumer sentiment in May tumbled unexpectedly to 67.4, down from a final reading of 77.2 in April and marking its lowest level in six months. “While consumers had been reserving judgment for the past few months, they now perceive negative developments on a number of dimensions,” the survey’s chief researcher noted. “They expressed worries that inflation, unemployment and interest rates may all be moving in an unfavorable direction in the year ahead.”
BOND MARKETS CONTINUE TO ABSORB HEFTY NEW SUPPLY. The yield on the benchmark 10-year U.S. Treasury note ended the week relatively unchanged after dipping to a nearly one-month intraday low on Tuesday. (Bond prices and yields move in opposite directions.) Tax-exempt municipal bonds rallied alongside Treasuries throughout much of the week despite heavy primary issuance. According to traders, the market absorbed the new supply readily, with the new deals experiencing strong demand from both retail and institutional buyers.
Traders noted that new deals in the investment-grade corporate market also generally saw healthy levels of oversubscription despite the primary calendar having its second-busiest week of the year in terms of new issue volume, with the volume almost doubling weekly expectations. Sentiment appeared to improve in the high yield bond market as equities traded higher.
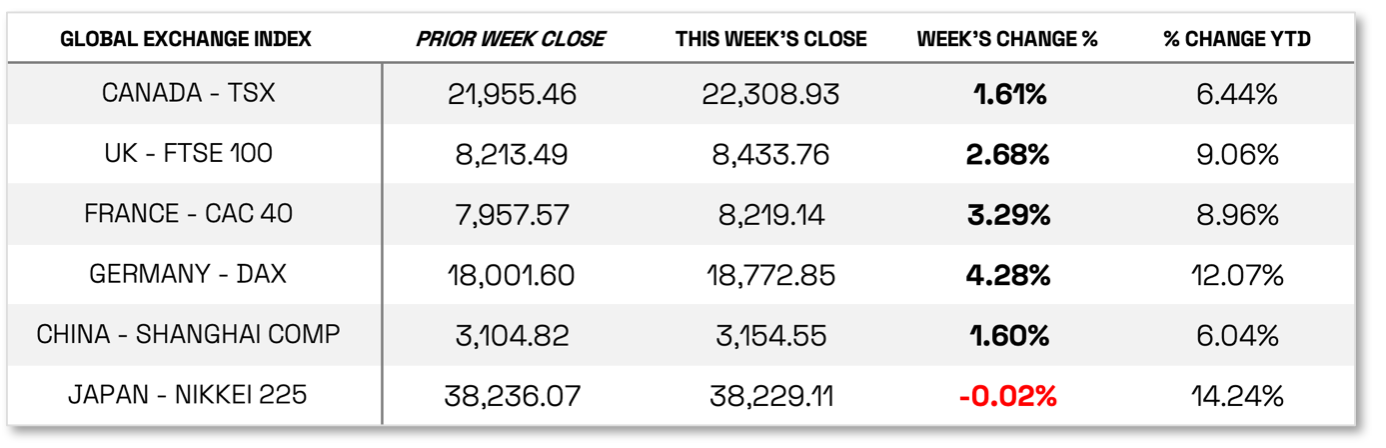
International Economic News: In local currency terms, the pan-European STOXX Europe 600 Index ended 3.01% higher on better-than-expected corporate earnings and increased optimism that major central banks would soon start cutting interest rates. Major stock indexes also rose sharply. Germany’s DAX gained 4.28%, France’s CAC 40 Index put on 3.29%, and Italy’s FTSE MIB added 3.06%. The UK’s FTSE 100 Index climbed 2.68% to a fresh record high.
BOE KEEPS RATES UNCHANGED, MOVES CLOSER TO POLICY EASING. The Bank of England (BoE) held its key interest rate steady at 5.25%, while indicating that it could ease policy as soon as June. Deputy Governor Dave Ramsden joined Swati Dhingra in voting for a rate cut of 0.25%. BoE Governor David Bailey also said rates may need to be reduced more than markets expect, although he emphasized that the decision would depend on incoming data. The BoE also updated its economic forecasts. It now expects inflation to slow more sharply to 1.9% in 2026 and to 1.6% in 2027.
WIELADEK: BOE MAY BE POISED TO CUT RATES IN JUNE. The BoE signaled that an interest rate cut in June is on the table, according to T. Rowe Price European Economist Tomasz Wieladek. Ramsden’s vote for reducing rates could be important, Wieladek says. Historically, Ramsden’s voting pattern has been a leading indicator of moves by the rest of the Monetary Policy Committee. Wieladek believes that a decision to lower borrowing costs in June is likely as long as the labor market and services inflation data in the next two months do not surprise significantly to the upside.
UK PULLS OUT OF RECESSION. The UK economy expanded by a much stronger-than-expected rate of 0.6% in the first quarter of 2024, exiting a recession that started in the second half of last year, according to a first estimate from the Office for National Statistics. Expansion in services and increases in production supported growth.
SWEDEN’S CENTRAL BANK CUTS RATES. The Riksbank lowered its key interest rate by a quarter point to 3.75%, the first reduction since 2016. It said that if the outlook for slowing inflation still holds, the policy rate could be cut two more times in the second half of the year.
JAPAN: Japan’s Nikkei 225 Index and the broader TOPIX Index registered marginal weekly losses. This was within the context of Bank of Japan (BoJ) Governor Kazuo Ueda hinting that the central bank could raise interest rates early if upside risks to the price outlook emerge, given that inflation may have become more susceptible to the effects of weakness in the yen. With U.S.-Japan interest rate differentials remaining very high, some observers believe that another interest rate hike is unlikely to support sustainable yen appreciation.
YEN DEPRECIATES FURTHER, DESPITE RECENT CURRENCY INTERVENTIONS. Over the week, the yen depreciated to the high-JPY 157 range against the USD, from about 153. This was despite market participants converging around the view that authorities had recently intervened on two occasions in the foreign exchange markets to prop up the yen, as suggested by the BoJ’s accounts.
PARTICIPANTS AT BOJ’S APRIL MEETING TURNED OVERWHELMINGLY HAWKISH. The yield on the 10-year Japanese government bond finished the week broadly unchanged at around the 0.9% level, near a six-month high. A summary of opinions expressed at the BoJ’s April meeting showed participants turning overwhelmingly hawkish, with one hinting at an accelerating pace of monetary policy normalization. Another opined that the path for interest rates may be higher than currently priced in by the market. Many market participants are pricing in two rate hikes within a one-year period.
However, some signs of weakness in economic data may delay the BoJ’s rate hike plans. Real, or inflation-adjusted, wages fell 2.5% in March from a year earlier, worse than the previous month’s 1.8% drop. The BoJ continues to reiterate its view that a “virtuous cycle” of growth in prices rising to its 2% target accompanied by wage inflation is a precondition for further monetary policy normalization. While the central bank has ended its negative interest rate policy, its monetary policy stance remains among the most highly accommodative in the world.
CHINA: Chinese stocks advanced as recovery hopes rose following buoyant holiday spending during the prior week’s Labor Day holiday. The Shanghai Composite Index rose 1.6%, while the blue chip CSI 300 gained 1.72%. In Hong Kong, the benchmark Hang Seng Index added 2.64%, according to FactSet.
Tourism revenue over the five-day break rose 7.6% compared with the 2023 holiday and surpassed pre-pandemic levels, according to data from the Ministry of Culture and Tourism. Domestic revenue rose 12.7% from last year, while international trips also picked up. Box-office sales reached RMB 1.53 billion, roughly in line with the prior year. However, average spending per traveler fell 11.5% from 2019 as consumers remained cautious about spending.
In economic news, the private Caixin/S&P Global survey of services activity reached 52.5 in April, down from March’s 52.7, as expected, and marked its 16th monthly expansion. Readings above 50 indicate an expansion from the prior month. The Caixin/S&P composite purchasing managers’ index, which tracks both the services and manufacturing sectors, edged up to 52.8 from 52.7 in March as overall business activity expanded in April.
TRADE DATA EXCEED FORECASTS. China’s exports rose by 1.5% in April from a year earlier, up from a 7.5% decline in March, and broadly in line with consensus estimates. Exports to Southeast Asian nations improved, while European shipments fell. Sales to the U.S. were little changed. Imports climbed a better-than-expected 8.4% in April, reversing March’s 1.9% decline, which some analysts attributed to increased raw materials shipments rather than improved consumer demand. The overall trade surplus increased to USD 72.35 billion, up from USD 58.55 billion in March.
Sources: All index and returns data from Norgate Data and Commodity Systems Incorporated and Wall Street Journal | News from Reuters, Barron’s, Wall St. Journal, Bloomberg.com, ft.com, guggenheimpartners.com, zerohedge.com, ritholtz.com, markit.com, financialpost.com, Eurostat, Statistics Canada, Yahoo! Finance, stocksandnews.com, marketwatch.com, visualcapitalist.com, wantchinatimes.com, BBC, 361capital.com, pensionpartners.com, cnbc.com, FactSet, Morningstar/Ibbotson Associates, Corporate Finance Institute | Commentary from T Rowe Price Global markets weekly update — https://www.troweprice.com/personal-investing/resources/insights/global-markets-weekly-update
Disclosures: This material is provided for informational purposes only and is not intended to be investment advice or a recommendation to take any action. Past performance cannot guarantee future results.
