


The very big picture (a historical perspective): The CAPE is now at 33.86 – up this week 2.67% from last week’s value of 32.98 and down 2.31% for April.
The long-term valuation of the market is commonly measured by the Cyclically Adjusted Price to Earnings ratio, or “CAPE”, which smooths-out shorter-term earnings swings in order to get a longer-term assessment of market valuation. In the past, the CAPE ratio has proved its importance in identifying potential bubbles and market crashes. An extremely high CAPE ratio means that a company’s stock price is substantially higher than the company’s earnings would indicate and, therefore, overvalued. It is generally expected that the market will eventually correct the company’s stock price by pushing it down to its true value. The historical average of the ratio for the S&P 500 Index is between 15-16, while the highest levels of the ratio have exceeded 30. The record-high levels occurred three times in the history of the U.S. financial markets. The first was in 1929 before the Wall Street crash that signaled the start of the Great Depression. The second was in the late 1990s before the Dotcom Crash, and the third came in 2007 before the 2007-2008 Financial Crisis.
HISTORY OF THE CAPE VALUE FROM 1871 TO PRESENT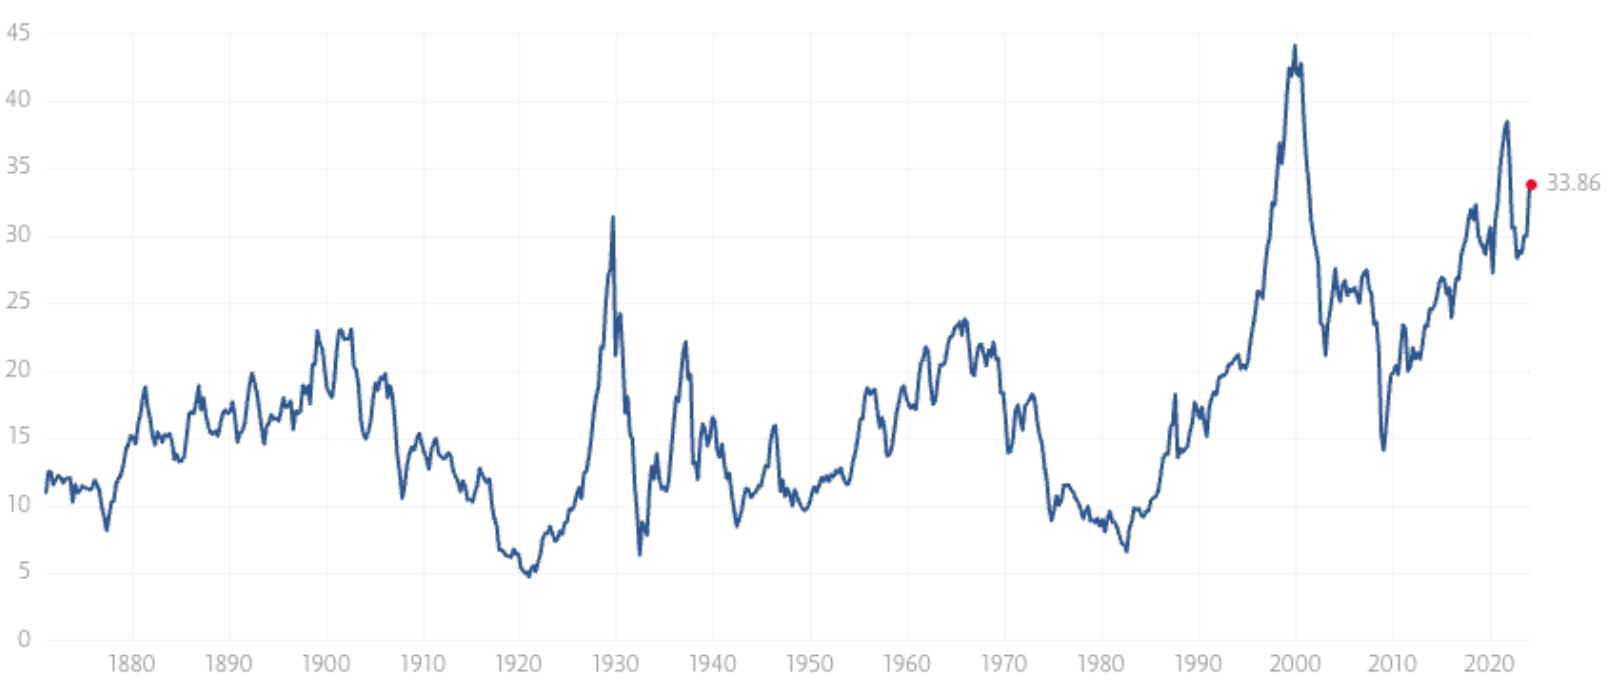
Note: We do not use CAPE as an official input into our methods. However, we think history serves as a guide and that it’s good to know where we are on the historic continuum. https://www.multpl.com/shiller-pe
The big picture: The ‘big picture’ is the (typically) years-long timeframe, the same timeframe in which Cyclical Bulls and Bears operate. The Sherman Portfolios DELTA-V Indicator measuring the Bull/Bear cycle finished the week in BULL status at 70.60, down 1.05% from the prior week’s 71.35. We’ve been in a cyclical Bull Market since April 21, 2023.
The shorter term picture: GALACTIC SHIELD — POSITIVE entering April 2024 (Q2)
indicating positive prospects for equities in the second quarter of 2024. This indicator is based on the combination of U.S. and International Equities trend statuses at the start of each quarter. STARFLUX— POSITIVE since Nov 16, 2023
and ended the week of 4/26/24 at 3.3 (up 1). This short-term indicator measures U.S. Equities. STARPATH — POSITIVE since November 21, 2023. This indicator measures the interplay on dual timeframes of our Type 1s + the Russell 3000 + our four most ‘pro-cyclical’ Type 3s, vs. Cash.
The complete picture (four indicators across three timeframes): When all four of the Sherman Portfolios indicators are in a POSITIVE status, we read the market as being in a CYCLICAL BULL MARKET.
1. DELTA-V — Positive
2. GALACTIC SHIELD — Positive
3. STARFLUX— Positive
4. STARPATH — Positive
THIS WEEK IN THE MARKETS
U.S. Markets: STOCKS BREAK LOSING STREAK. The S&P 500 Index and most other major benchmarks managed to snap a string of three weekly losses as investors responded to the busiest week of the first-quarter earnings reporting season. As of the end of the week, analysts polled by FactSet were expecting overall earnings for the S&P 500 to have increased 3.7% in the first quarter relative to the year before, with “both the percentage of S&P 500 companies reporting positive earnings surprises and the magnitude of earnings surprises… above their 10-year averages.”
The technology-heavy Nasdaq Composite Index performed best, helped in part by strength in Apple and a late rebound in chipmaker NVIDIA. Shares in Google parent Alphabet also surged late in the week following its announcement of better-than-expected first-quarter earnings along with the company’s first dividend payment. Conversely, Facebook parent Meta Platforms fell sharply – at one point erasing nearly USD 200 billion in market value – after CEO Mark Zuckerberg announced plans to continue heavy spending on artificial intelligence and other new technologies.
Looking at the US Indexes: The end of the losing streak – the below 5 indexes all rallied strong with the Nasdaq up over 4%. Both large and small-cap indexes were knocking on the door of 3-percent gains with almost 2% growth from the mid-cap S&P 400. The Russell 2000 small cap index is now closing in on being flat YTD after a recent steep decline.
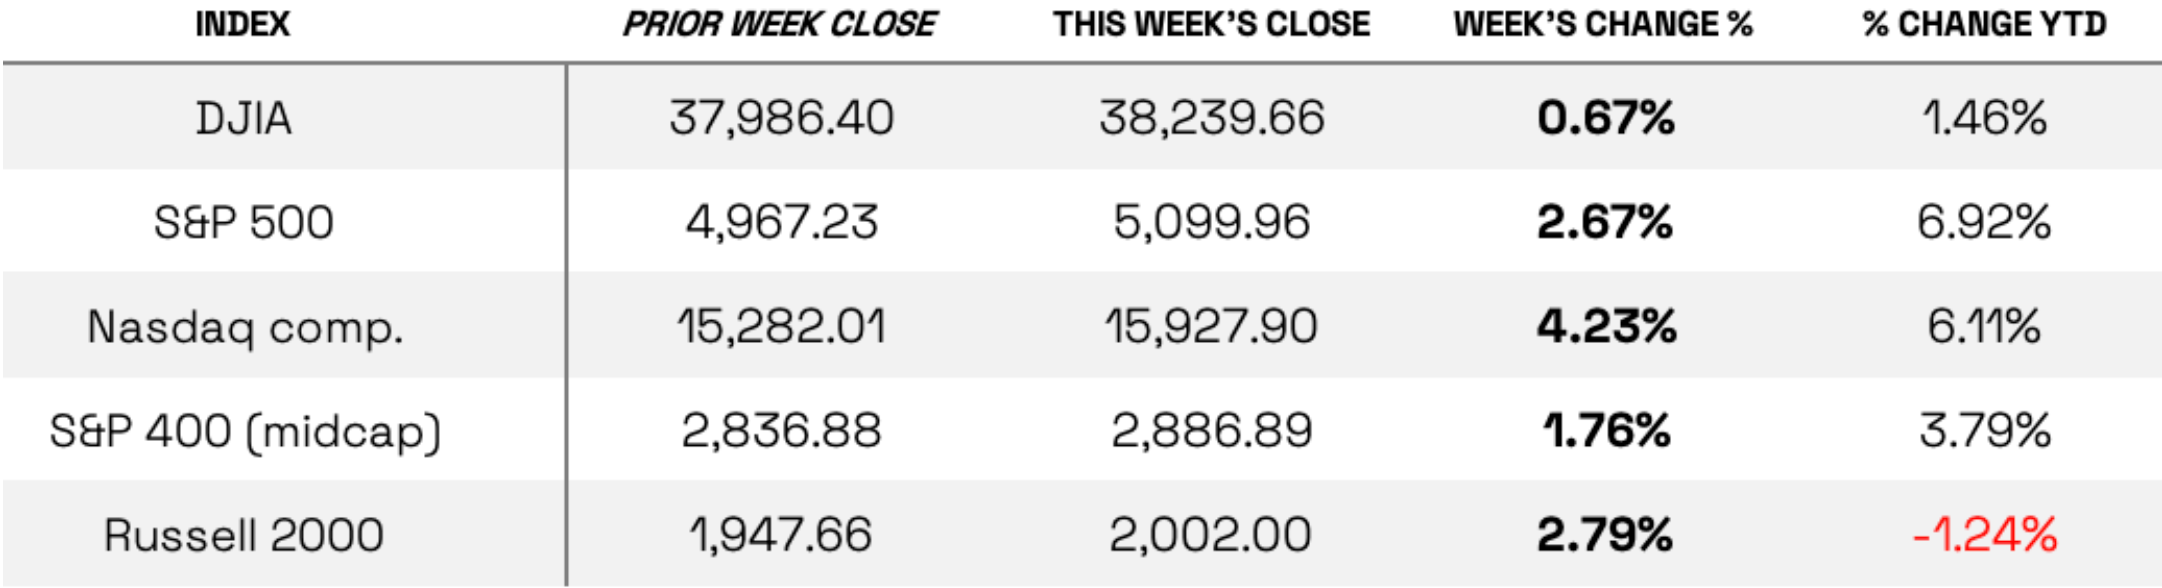
The Dow Jones Industrial Average (DJIA) is the oldest continuing U.S. market index with over 100 years of history and is made up of 30 highly reputable “blue-chip” U.S. stocks (e.g. Coca-Cola Co., Microsoft). The Dow was at the back of the pack in growth this week, nevertheless enjoying a better week of growth. This week, the DJIA, gained 0.67%, ending the week of Apr 26 at 38,239.66 vs the prior week of 37,986.40, now sitting at +1.46% YTD.
The Nasdaq Composite Index tracks most of the stocks listed on the Nasdaq Stock Market – the second-largest stock exchange in the world. Over half of all stocks on the NASDAQ are tech stocks. The champion of the week was the tech-driven Nasdaq, boasting big gains this week 4.23%, closing at 15,927.90 vs. the prior week of 15,282.01.
The S&P 500 large-cap index is a market-capitalization-weighted index of 500 leading publicly traded companies in the U.S. The S&P 500 is regarded as one of the best gauges of prominent American equities’ performance, and by extension, that of the stock market overall. The loss streak for the large-cap S&P 500 ended at almost 6,000 with a refreshing gain of 2.67%, closing at 5,099.96 vs last week’s close of 4,967.23.
The S&P 400 mid-cap index is the benchmark index made up of 400 stocks that broadly represent companies with midrange market capitalization between $3.6 billion and $13.1 billion. It is used by investors as a gauge for market performance and directional trends in U.S. stocks. The S&P 400 mid-cap pulled back on its losses, while slower than small and large-cap, the index gained 1.76% by market close ending at 2,886.89 vs last week’s 2,836.88.
The Russell 2000 (RUT) small-cap measures the performance of the 2,000 smaller companies included in the Russell 3000 Index. The Russell 2000 is managed by London’s FTSE Russell Group and is widely regarded as a leading indicator of the U.S. economy because of its focus on smaller companies that focus on the U.S. market. The Russel 2000 was the first index to move into negative YTD losses this year but is now climbing its way back to being even, landing this week at -1.24% YTD. RUT gained 2.79% closing at 2,002.00 vs last week’s close of 1,947.66.
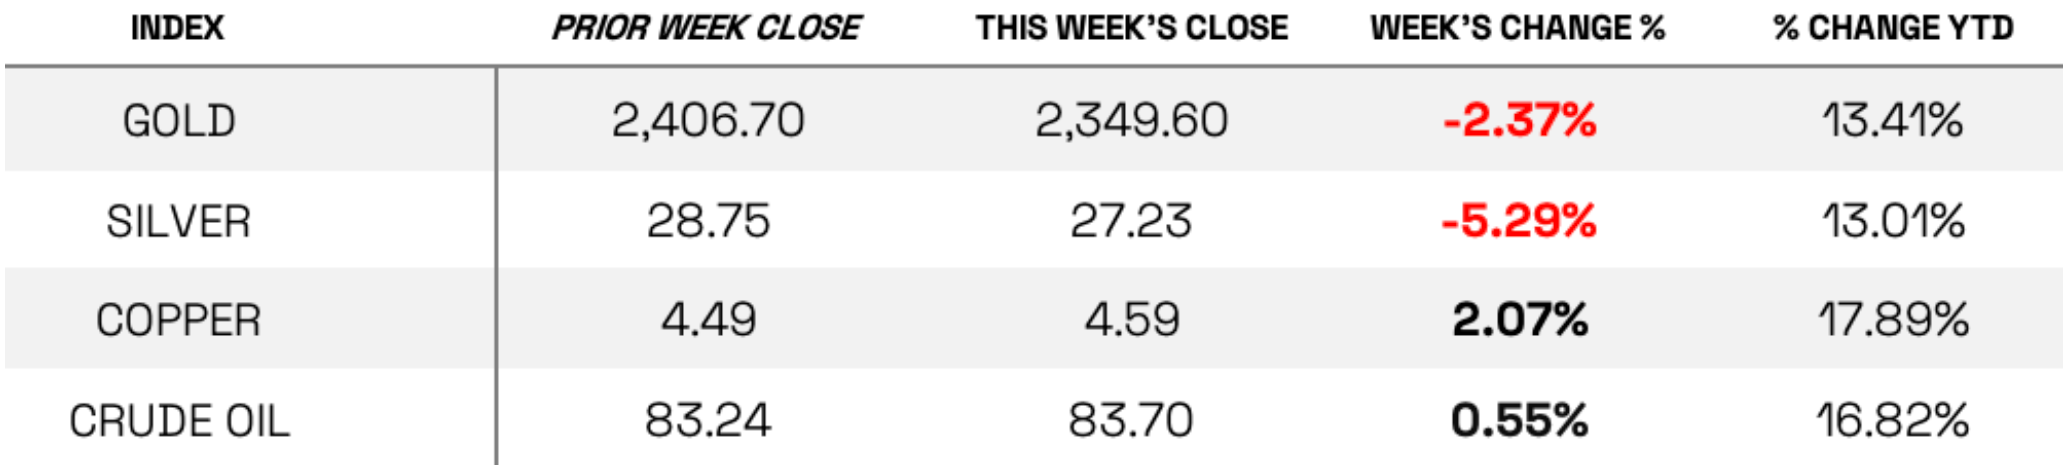
U.S. Commodities/Futures: While the indexes rallied, Gold and Silver both dropped considerably this week after recent gains; Copper and Oil both saw gains. Silver lost more than 5% this week with Gold seeing less than half that loss.
VIX closed at 15.03 this week, a 19.67% decrease over last week’s close of 18.71. This could show a slowing down of demand, with the S&P 500 rallying over 2.5% this week and futures showing some decline.
International Markets:
THIS WEEK IN ECONOMIC NEWS
U.S. Economic News: UNCLEAR WHETHER BAD NEWS FOR GROWTH IS GOOD NEWS FOR MARKETS. The week started off on a strong note, which seemed to be due to investors trying to capitalize on recent declines in the tech sector as well as short covering, or buying to limit potential losses on bets that stocks will decline. The buying continued on Tuesday, which may have been due in part to some downside surprises in economic data – interpreted as good news for markets because of the reduced pressure it implied on inflation and interest rates. S&P Global reported that its gauge of U.S. manufacturing activity fell back into contraction territory (below 50.0) in April, at 49.9, well below consensus estimates of around 52.0. S&P’s gauge of services sector activity, while still indicating expansion, also missed expectations, at 50.9 versus 52.0.
Thursday’s bad economic news appeared to be treated as bad news, however. The Commerce Department’s advance estimate showed the economy expanding at an annualized rate of 1.6% in the first quarter, well below consensus estimates of around 2.5% and the slowest pace of growth in nearly two years. A sharp slowdown in government spending and a widening trade deficit were partly to blame, but consumers also continued to rein in spending, particularly on goods. Separate data released Wednesday showed that businesses continued to increase capital spending in March, but at a slower pace (0.3%) than in February, where the gain was revised lower to 0.4%.
MIXED SIGNALS FROM FED’S PREFERRED INFLATION GAUGE. Inflation data released Thursday also seemed to concern investors and raise worries that the U.S. might even be in danger of “stagflation,” or rising prices alongside flagging growth. The Commerce Department reported that its core (less food and energy) personal consumption expenditures (PCE) index rose at an annualized rate of 3.7% in the first quarter, more than expected and well above both the fourth quarter’s 1.7% increase and the Federal Reserve’s 2% long-term inflation target.
Friday’s rebound in stocks appeared largely due to better news on the inflation front, with futures jumping after the Commerce Department’s release of monthly core PCE data. Core PCE inflation continued to decline on an annual basis in March, if ever so slightly, falling to 2.82% from 2.84% in February, continuing a downward trajectory that began in October 2022. Friday also brought news, however, that the University of Michigan’s revised gauge of consumer sentiment in April fell back from a nearly three-year high in March, reflecting, in part, higher inflation expectations.
The yield on the benchmark 10-year U.S. Treasury note decreased somewhat following the release of Friday’s PCE data but still ended the week near its highest level in almost six months. (Bond prices and yields move in opposite directions.) Traders noted strong retail and institutional demand for new deals in the tax-free municipal bond market, with many oversubscribed. Meanwhile, the investment-grade corporate bond market had a relatively quiet week with limited issues that were also largely oversubscribed.
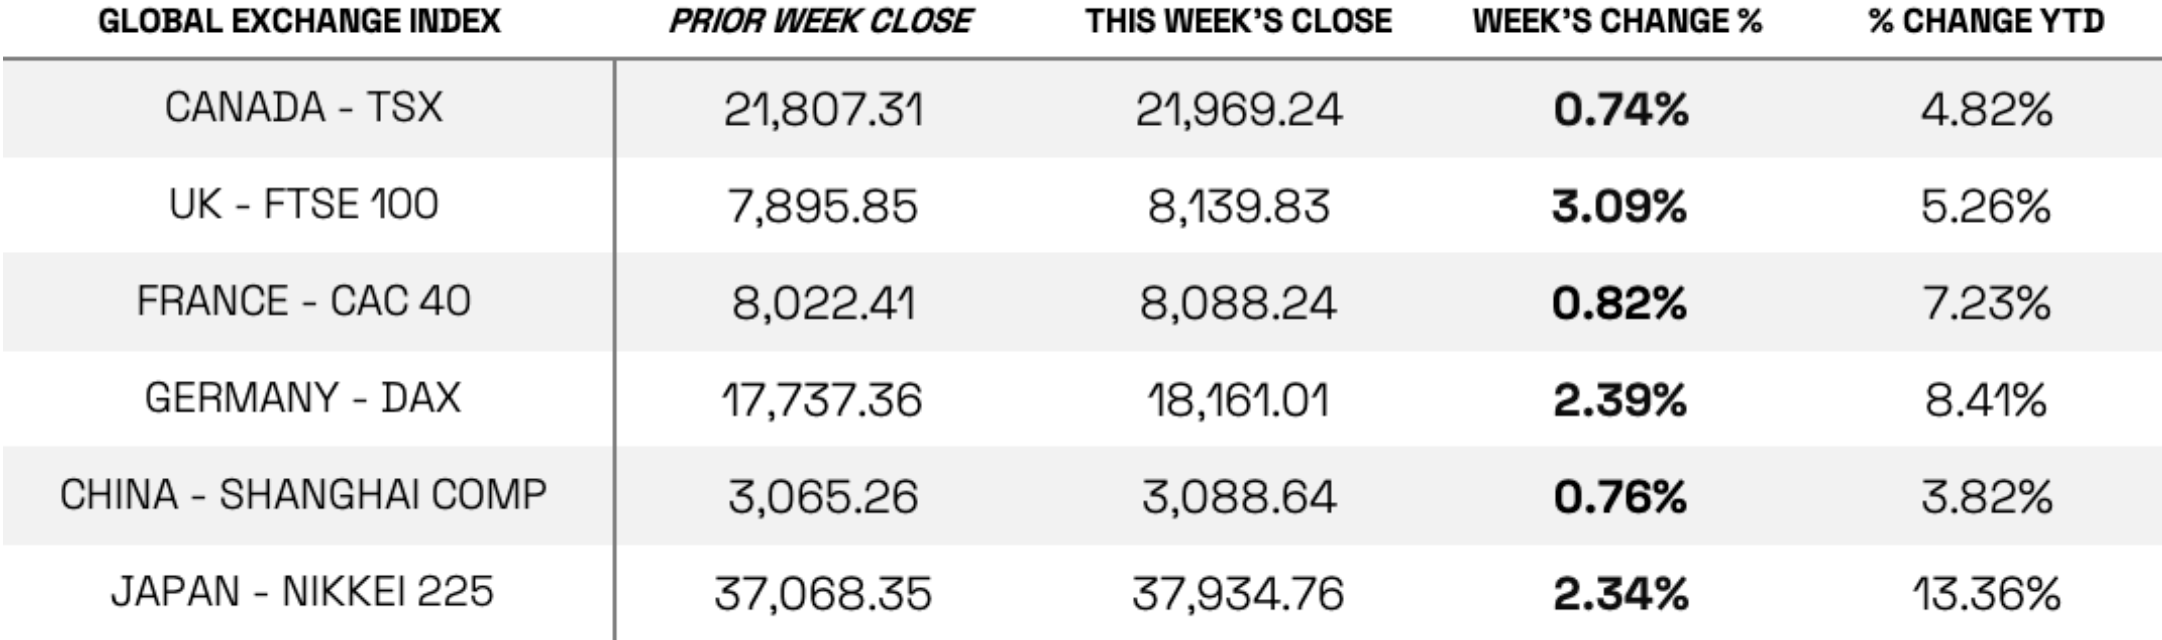
International Economic News: In local currency terms, the pan-European STOXX Europe 600 Index snapped a three-week losing streak and ended 1.74% higher. An easing of Middle East tensions and some encouraging corporate earnings results helped to boost sentiment. Most major stock indexes also advanced. Germany’s DAX gained 2.39%, France’s CAC 40 Index added 0.82%, and Italy’s FTSE MIB climbed 0.97%. The UK’s FTSE 100 Index climbed to fresh all-time highs, putting on 3.09%.
European government bond yields hit their highest levels this year. Strong U.S. economic data increased expectations that the Federal Reserve would keep interest rates higher for longer, which could force other major central banks to follow suit. The yield on the benchmark 10-year German government bond briefly spiked above 2.6%.
ECB HAWKS CAUTIOUS ON RATE CUTS AFTER JUNE. Numerous European Central Bank policymakers have signaled that they expect to lower interest rates in June, barring economic shocks. However, comments by hawks appeared to cast doubt on subsequent reductions in borrowing costs. German Bundesbank President Joachim Nagel said in a speech that a decision in June “would not necessarily be followed by a series of rate cuts,” given the current uncertainty. Executive Board member Isabel Schnabel highlighted that services inflation was the biggest concern. “There is a consensus emerging that we may be facing a quite bumpy last mile,” she said.
EUROZONE PMIS, GERMAN DATA IMPROVE. Business activity in the eurozone grew at the fastest pace in nearly a year in April, driven by a recovery in the services industry, according to purchasing managers’ surveys compiled by S&P Global. A first estimate of the HCOB Eurozone Composite Purchasing Managers’ Index (PMI), which includes the services and manufacturing sectors, came in at 51.4, up from 50.3 in March. A consensus forecast had called for PMI of 50.7. Readings above 50 indicate expansion.
Germany’s PMI and the Ifo Institute’s barometer of business confidence provided further evidence that the country’s economic downturn may be bottoming out. The private sector returned to growth in April, as services activity increased and a decline in manufacturing eased. Overall business sentiment improved for a third consecutive month, and the government increased its forecast for economic growth this year to 0.3% from 0.2%.
UK BUSINESS ACTIVITY STRENGTHENS IN APRIL, BUT DEMAND APPEARS TO WEAKEN. Business activity in the UK grew at the fastest pace in almost a year, with the composite PMI rising to 54.0 from 52.8 in March. Input costs increased at the strongest pace in 11 months, but output prices declined, suggesting that weakening demand is squeezing business margins.
– – – – – – – – – – –
JAPAN: Buoyed by historic yen weakness, Japan’s stock markets gained over the week, with both the Nikkei 225 Index and the broader TOPIX Index returning 2.3%. The Bank of Japan (BoJ) refrained from making changes to its monetary policy at its April meeting, which was perceived as broadly dovish by investors. BoJ Governor Kazuo Ueda hinted that confidence to raise interest rates further is set to increase in the second half of this year, however. In the fixed income markets, the yield on the 10-year Japanese government bond rose to 0.91% from the prior week’s 0.84%.
THE YEN’S PLUNGE CONTINUES, BUT AUTHORITIES REFRAIN FROM INTERVENING. Once again, authorities, refrained from intervening in the currency markets to prop up the historically weak yen, despite intense speculation about the growing likelihood of such action. The yen weakened to about JPY 156.8 against the USD, from about 154.6 at the end of the previous week. Within this context, Ueda acknowledged that prolonged currency weakness is a risk factor. He reiterated that the central bank would keep monitoring foreign exchange markets and their impact on the economy.
SIGNS OF EASING INFLATION, EXPANSION IN PRIVATE SECTOR ACTIVITY. Inflationary pressures showed some signs of easing, with the Tokyo-area core consumer price index (CPI) rising 1.6% year on year in April, short of consensus expectations and down from 2.4% in March. The easing was attributable primarily to the impact of subsidies.
Elsewhere on the economic data front, flash April purchasing managers’ index releases signaled stabilization in Japan’s manufacturing sector while the services segment strengthened. The composite PMI rose to 52.6 from 51.7 in March. The pace of hiring picked up across the private sector, as business confidence remained positive – this suggests that the expansion in activity is likely to be sustained in the near term, according to au Jibun Bank, which compiles the PMI survey.
CHINA: Chinese stocks rose as investors grew more optimistic about the economy. The Shanghai Composite Index gained 0.76%, while the blue chip CSI 300 added 1.2%. In Hong Kong, the benchmark Hang Seng Index soared 8.8%, according to FactSet.
China’s economy is expected to grow 4.8% this year, up from a median forecast of 4.6% last month, according to 15 economists surveyed by Bloomberg. China’s gross domestic product grew an above-consensus 5.3% in the first quarter from a year earlier, accelerating slightly from the 5.2% year-over-year expansion in the fourth quarter of 2023. However, economists downgraded their inflation forecasts as declining producer prices and a persistent property market slump remain a drag on the economy.
On the monetary policy front, Chinese banks left their one- and five-year loan prime rates unchanged at 3.45% and 3.95%, respectively, as expected, after the People’s Bank of China kept its medium-term lending rate on hold the prior week. Some analysts believe that policymakers have turned more cautious on monetary easing after the central bank withdrew cash from the banking system for a second consecutive month in April.
Sources: All index and returns data from Norgate Data and Commodity Systems Incorporated and Wall Street Journal News from Reuters, Barron’s, Wall St. Journal, Bloomberg.com, ft.com, guggenheimpartners.com, zerohedge.com, ritholtz.com, markit.com, financialpost.com, Eurostat, Statistics Canada, Yahoo! Finance, stocksandnews.com, marketwatch.com, visualcapitalist.com, wantchinatimes.com, BBC, 361capital.com, pensionpartners.com, cnbc.com, FactSet, Morningstar/Ibbotson Associates, Corporate Finance Institute. Commentary from T Rowe Price Global markets weekly update — https://www.troweprice.com/personal-investing/resources/insights/global-markets-weekly-update
Disclosures: This material is provided for informational purposes only and is not intended to be investment advice or a recommendation to take any action. Past performance cannot guarantee future results.
