


THE COMPLETE PICTURE
>> Four indicators across three time frames.
>> When the Sherman Portfolios indicators are not all the same status, we read the market as being in a Mixed Market.
1. DELTA-V — Positive since April 21, 2023
2. GALACTIC SHIELD — Positive since April 1, 2023
3. STARFLUX— Positive since Aug 23, 2024
4. STARPATH — Negative since March, 7 2025
The shorter term picture:
>> GALACTIC SHIELD — POSITIVE, for Q1 2025 indicating positive prospects for equities in the first quarter of 2025. This indicator is based on the combination of U.S. and International Equities trend statuses at the start of each quarter.
>> STARFLUX. — POSITIVE, Starflux ended the week at 0.88 (down 78.80% last week) This short-term indicator measures U.S. Equities.
>> STARPATH — NEGATIVE, This indicator measures the interplay on dual timeframes of our Type 1s + the Russell 3000 + our four most ‘pro-cyclical’ Type 3s, vs. Cash.
The big picture:
The ‘big picture’ is the (typically) years-long timeframe, the same timeframe in which Cyclical Bulls and Bears operate.
>>The Sherman Portfolios DELTA-V Indicator measuring the Bull/Bear cycle finished the week in BULL status at 53.65, down 6.21% from the prior week’s 57.20. It has signaled Bull since April 21, 2023.
>>The Sherman Portfolios DELTA-V Bond Indicator measuring the Bull/Bear cycle finished the week in BULL status at 61.32, down 0.15% from the prior week’s 61.41. It has signaled Bull since December 15, 2023.
THIS WEEK IN THE MARKETS
U.S. Markets:
Trade concerns drive indexes down:
U.S. stocks declined sharply, posting their worst week since early September, as trade policy uncertainty weighed on investor sentiment. The S&P 500, Nasdaq Composite, S&P MidCap 400, and Russell 2000 all dropped over 3%, while the Dow Jones Industrial Average fell 2.37%, erasing most of its year-to-date gains. Trade concerns intensified as a deadline approached for President Trump’s proposed tariffs on Canadian, Mexican, and Chinese imports, though later in the week, the administration announced exemptions and delays, including a one-month exemption for U.S.-Mexico-Canada Agreement goods. Despite these adjustments, the ongoing uncertainty and shifting policies continued to unsettle markets.
Looking at the US Indexes:

> The Dow Jones Industrial Average (DJIA) is the oldest continuing U.S. market index with over 100 years of history and is made up of 30 highly reputable “blue-chip” U.S. stocks (e.g. Coca-Cola Co., Microsoft). The Dow ended the week down 2.37% at 42,801.72 vs the prior week of 43,840.91.
> The Nasdaq Composite Index tracks most of the stocks listed on the Nasdaq Stock Market – the second-largest stock exchange in the world. Over half of all stocks on the NASDAQ are tech stocks. The tech-driven Nasdaq ended the week down 3.45%, closing at 18,196.22 vs. the prior week of 18,847.28.
> The S&P 500 large-cap index is a market-capitalization-weighted index of 500 leading publicly traded companies in the U.S. The S&P 500 is regarded as one of the best gauges of prominent American equities’ performance, and by extension, that of the stock market overall. The S&P 500 ended the week down 3.10%, closing at 5,770.20 compared to last week’s 5,954.50.
> The S&P 400 mid-cap index is the benchmark index made up of 400 stocks that broadly represent companies with midrange market capitalization between $3.6 billion and $13.1 billion. It is used by investors as a gauge for market performance and directional trends in U.S. stocks. The S&P 400 mid-cap ended the week down 3.49%, closing at 2,987.09 compared to last week’s 3,095.15.
> The Russell 2000 (RUT) small-cap index measures the performance of the 2,000 smaller companies included in the Russell 3000 Index. The Russell 2000 is managed by London’s FTSE Russell Group and is widely regarded as a leading indicator of the U.S. economy because of its focus on smaller companies that focus on the U.S. market. The Russell 2000 ended the week down 4.05%, closing at 2,075.48 compared to last week’s 2,163.07.
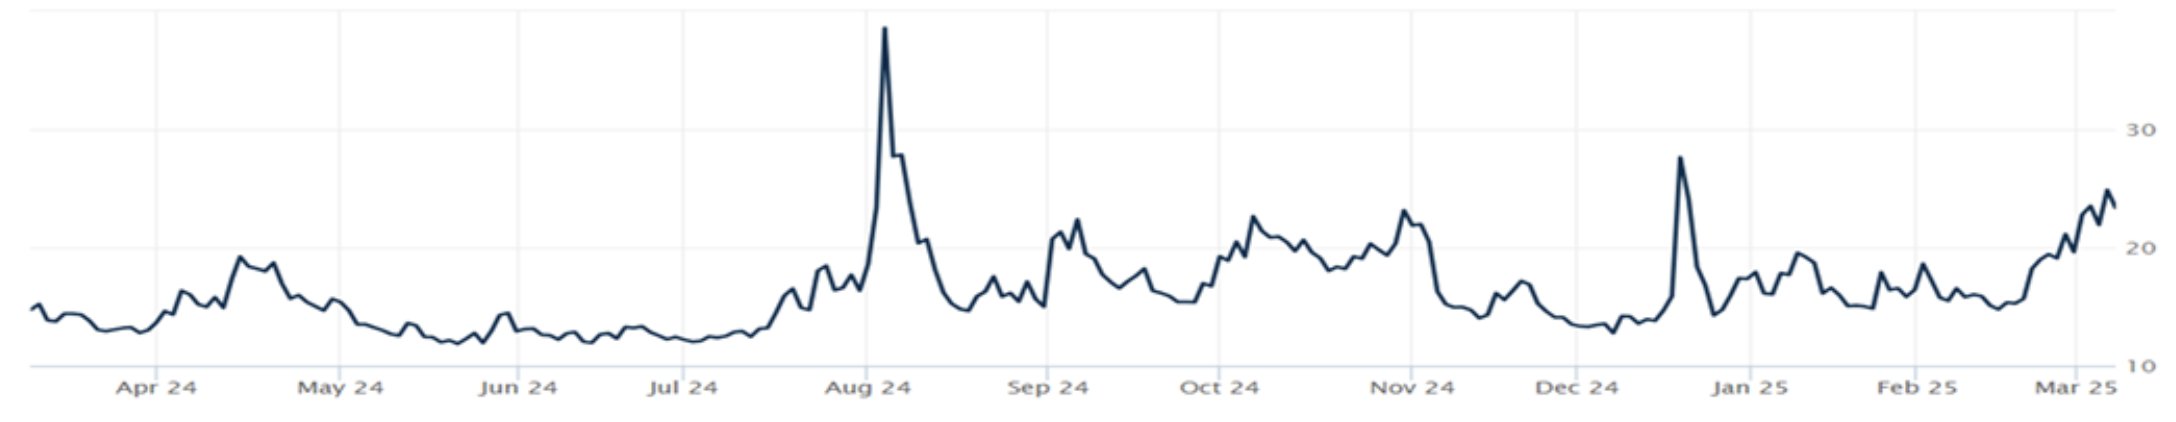
U.S. Commodities/Futures:
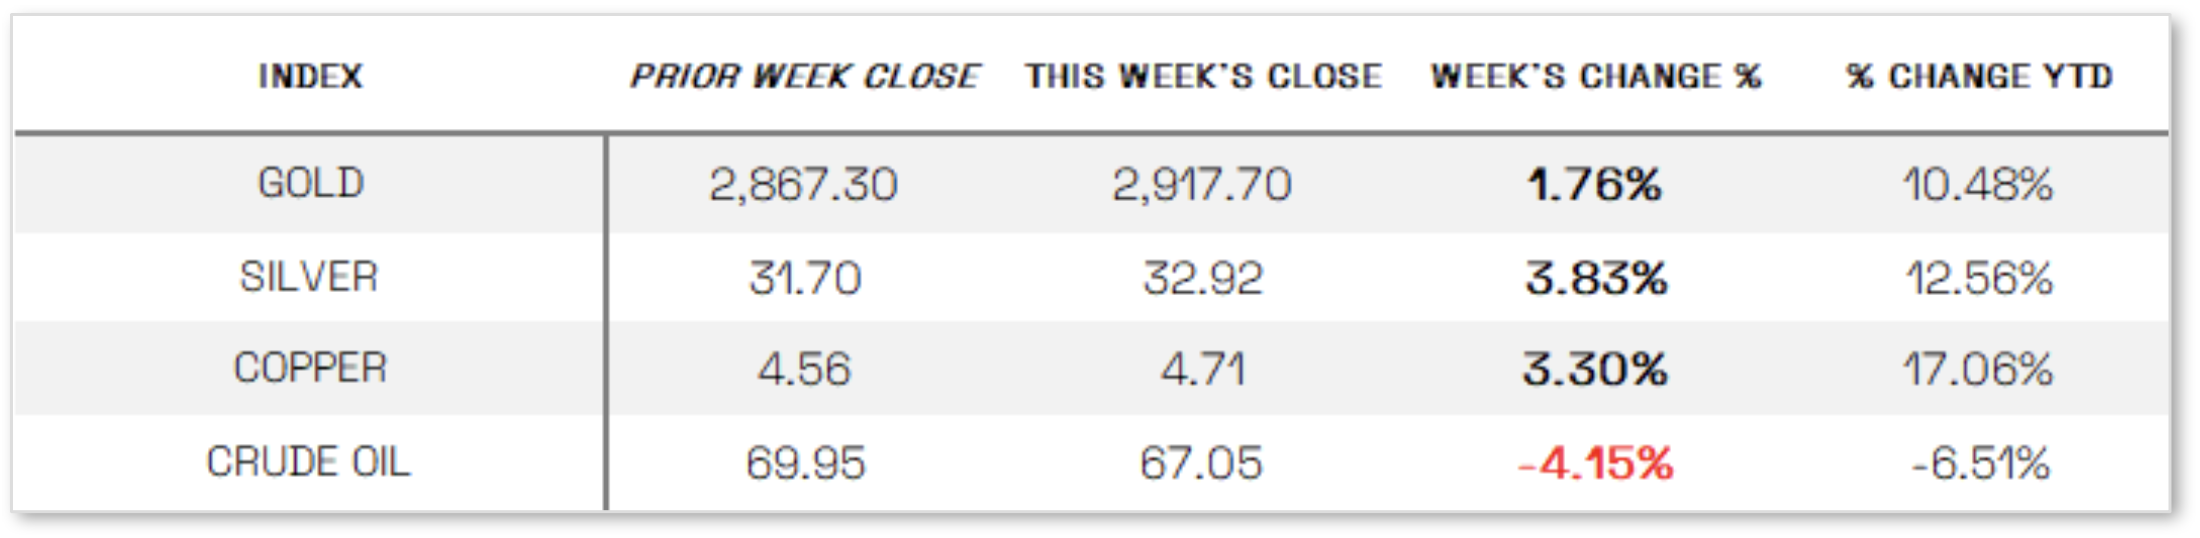
THE VOLATILITY INDEX (VIX) closed at 23.37 this week, a 19.1% increase vs last week’s close of 19.63.
International Markets:

THIS WEEK’S ECONOMIC NEWS
U.S. Economic News:
Mixed economic data in wake of Beige Book: Manufacturing growth slowed in February as the ISM manufacturing PMI dipped to 50.3%, with new orders falling sharply into contraction at 48.6% and prices surging to 62.4%, while the services sector continued to expand, with its PMI rising to 53.5% for the eighth consecutive month of growth. The Federal Reserve’s Beige Book, released Wednesday, indicated modest economic growth but noted weaker consumer spending, increased price sensitivity, and ongoing uncertainty regarding tariffs, which were mentioned 49 times in the report. Fed Chair Jerome Powell acknowledged the heightened uncertainty surrounding trade, immigration, and fiscal policy, emphasizing that policymakers would take a cautious approach and wait for greater clarity before making further monetary policy adjustments.
International Economic News:
EUROPE: The pan-European STOXX Europe 600 Index fell 0.69%, breaking a 10-week winning streak, as uncertainty over U.S. trade policy weighed on sentiment, though expectations of increased defense and infrastructure spending in Germany and the EU helped limit losses. Major European indexes had mixed results, with Germany’s DAX rising 2.03% and France’s CAC 40 edging up 0.11%, while Italy’s FTSE MIB slipped 0.16% and the UK’s FTSE 100 dropped 1.47%. Meanwhile, the European Central Bank (ECB) cut its key deposit rate by 0.25 percentage points to 2.5%, with President Christine Lagarde emphasizing the high level of economic uncertainty, particularly regarding a potential trade war with the U.S. This uncertainty has already impacted investment and exports, prompting the ECB to lower its 2025 eurozone growth forecast to 0.9% while raising its inflation projection to 2.3% from 2.1%. Recent data also showed eurozone inflation slowed to 2.4% in January from 2.5% in December, with core inflation declining to 2.6% from 2.7%.
JAPAN: Japan’s stock markets had a mixed performance, with the Nikkei 225 Index slipping 0.72% while the broader TOPIX Index gained about 1.0%, as uncertainty over U.S. tariffs and other policies dampened global risk appetite. The yen strengthened on safe-haven demand, rising to the mid-147 range against the U.S. dollar from around 150.6 the previous week. Meanwhile, the yield on the 10-year Japanese government bond climbed to 1.53%—its highest level since 2008—amid expectations that the Bank of Japan (BoJ) will continue raising interest rates. In a significant policy shift, Japan’s government is set to declare an official end to long-term price deflation, with Economy Minister Ryosei Akazawa noting that all key deflation indicators have turned positive. This development could influence the timing of the BoJ’s next rate hike, as the central bank reaffirmed its stance that further increases would be contingent on economic forecasts being met.
CHINA: Mainland Chinese stock markets advanced as Beijing unveiled economic growth targets aligned with forecasts and hinted at further stimulus amid an escalating U.S. trade war, with the CSI 300 Index rising 1.39% and the Shanghai Composite Index gaining 1.56%, while Hong Kong’s Hang Seng Index surged 5.94%. At the National People’s Congress (NPC), China set a 5% growth target for 2025 for the third consecutive year and raised its fiscal deficit goal to 4% of GDP—the highest since 1994—while lowering its inflation target to 2%, the lowest since 2003, reflecting deflationary pressures. While most targets met expectations, analysts remain skeptical about China’s ability to sustain 5% growth amid trade tensions and a persistent housing slump. The decision to increase the fiscal deficit target marked a significant shift, signaling the government’s readiness to ramp up borrowing and spending to meet its growth objectives. Premier Li Qiang emphasized boosting consumption as the top priority for 2025, though Beijing provided little detail on specific measures in its annual economic blueprint.
Sources:
>> All index and returns data from Norgate Data and Commodity Systems Incorporated and Wall Street Journal.
>> News from Reuters, Barron’s, Wall St. Journal, Bloomberg.com, ft.com, guggenheimpartners.com, zerohedge.com, ritholtz.com, markit.com, financialpost.com, Eurostat, Statistics Canada, Yahoo! Finance, stocksandnews.com, marketwatch.com, visualcapitalist.com, wantchinatimes.com, BBC, 361capital.com, pensionpartners.com, cnbc.com, FactSet, Morningstar/Ibbotson Associates, Corporate Finance Institute.
>> Commentary from T Rowe Price Global markets weekly update — https://www.troweprice.com/personal-investing/resources/insights/global-markets-weekly-update.html
Disclosures: This material and any mention of specific investments is provided for informational purposes only and is not intended to be investment advice or a recommendation to take any action. The forecasts or forward-looking statements are based on assumptions, may not materialize, and are subject to revision without notice. The market indexes discussed are unmanaged, and generally, considered representative of their respective markets. Index performance is not indicative of the past performance of a particular investment. Indexes do not incur management fees, costs, and expenses. Individuals cannot directly invest in unmanaged indexes. Past performance does not guarantee future results.
