


THE COMPLETE PICTURE
>> Four indicators across three time frames.
>> When all of the Sherman Portfolios indicators are in a Positive status, we read the market as being in a Bull Market.
1. DELTA-V — Positive since April 21, 2023
2. GALACTIC SHIELD — Positive since April 1, 2023
3. STARFLUX— Positive since Aug 23, 2024
4. STARPATH — Positive since November 10, 2023
The shorter term picture:
>> GALACTIC SHIELD — POSITIVE for Q1 2025, indicating positive prospects for equities in the first quarter of 2025. This indicator is based on the combination of U.S. and International Equities trend statuses at the start of each quarter.
>>STARFLUX— POSITIVE. Starflux ended the week at 4.15 (down 21.10% last week) This short-term indicator measures U.S. Equities.
>> STARPATH — POSITIVE, This indicator measures the interplay on dual timeframes of our Type 1s + the Russell 3000 + our four most ‘pro-cyclical’ Type 3s, vs. Cash.
The big picture:
The ‘big picture’ is the (typically) years-long timeframe, the same timeframe in which Cyclical Bulls and Bears operate.
>> The Sherman Portfolios DELTA-V Indicator measuring the Bull/Bear cycle finished the week in BULL status at 57.20, down 4.83% from the prior week’s 60.10. It has signaled Bull since April 21, 2023.
>> The Sherman Portfolios DELTA-V Bond Indicator measuring the Bull/Bear cycle finished the week in BULL status at 61.41, up 10.2% from the prior week’s 55.72. It has signaled Bull since December 15, 2023.
The very big picture (a historical perspective):
The CAPE is now at 37.97. The long-term valuation of the market is commonly measured by the Cyclically Adjusted Price to Earnings ratio, or “CAPE”, which smooths-out shorter-term earnings swings in order to get a longer-term assessment of market valuation. In the past, the CAPE ratio has proved its importance in identifying potential bubbles and market crashes. An extremely high CAPE ratio means that a company’s stock price is substantially higher than the company’s earnings would indicate and, therefore, overvalued. It is generally expected that the market will eventually correct the company’s stock price by pushing it down to its true value. The historical average of the ratio for the S&P 500 Index is between 15-16, while the highest levels of the ratio have exceeded 30.
The record-high levels occurred three times in the history of the U.S. financial markets. The first was in 1929 before the Wall Street crash that signaled the start of the Great Depression. The second was in the late 1990s before the Dotcom Crash, and the third came in 2007 before the 2007-2008 Financial Crisis. https://www.multpl.com/shiller-pe
HISTORY OF THE CAPE VALUE FROM 1871 TO PRESENT
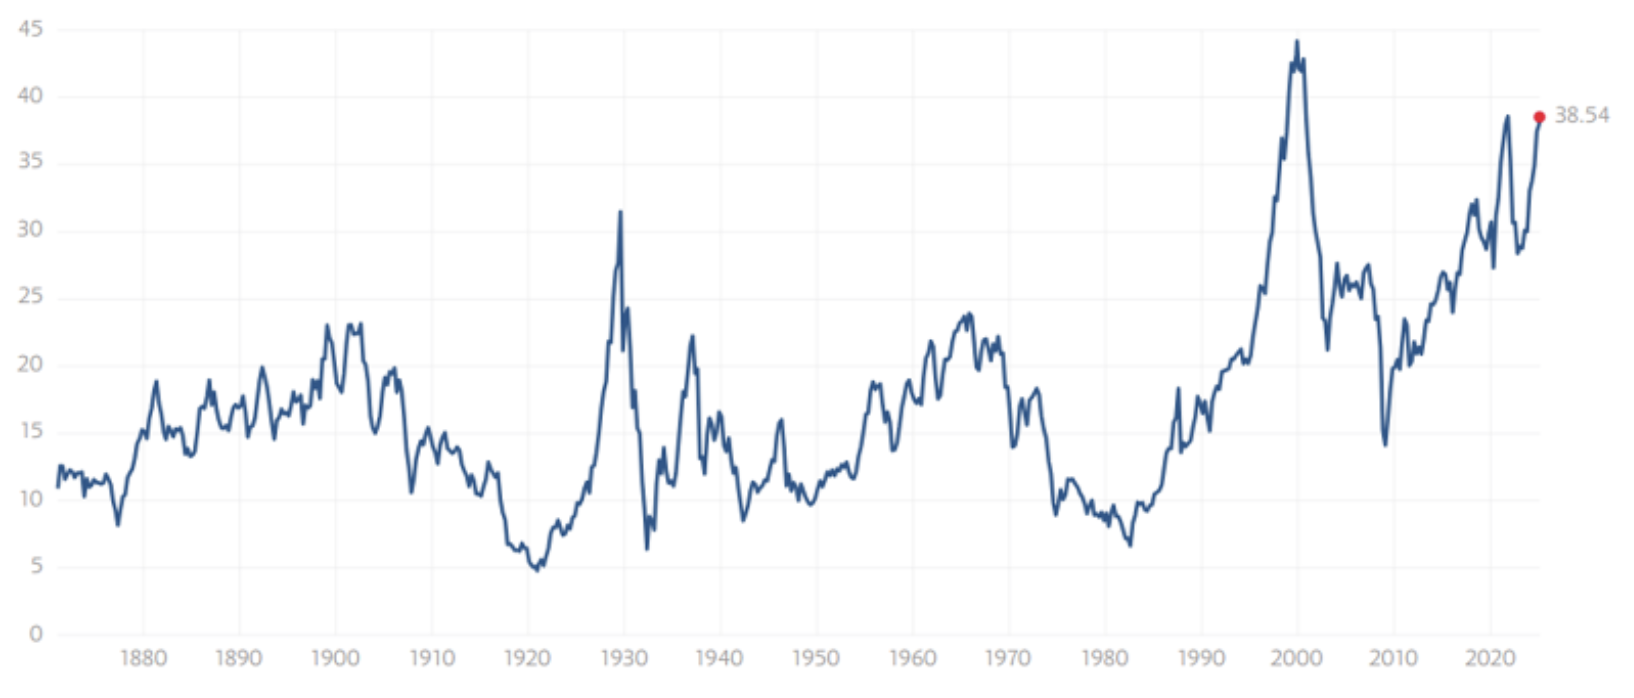 Note: We do not use CAPE as an official input into our methods. However, we think history serves as a guide and that it’s good to know where we are on the historic continuum. https://www.multpl.com/shiller-pe
THIS WEEK IN THE MARKETS
U.S. Markets:
Most indexes down this week:
U.S. stock indexes declined for a second consecutive week, except for the Dow Jones Industrial Average, which rose 0.95%, extending its year-to-date outperformance. Growth stocks struggled, with the Nasdaq Composite suffering its worst weekly drop since early September as tech stocks, particularly the “Magnificent Seven,” fell amid regulatory uncertainty and concerns over the sustainability of the AI-driven rally—exemplified by NVIDIA’s 8.48% drop on Thursday following its earnings report. Additionally, tariff fears weighed on equities as former President Donald Trump reaffirmed plans to impose new trade levies by March 4.
Looking at the US Indexes:
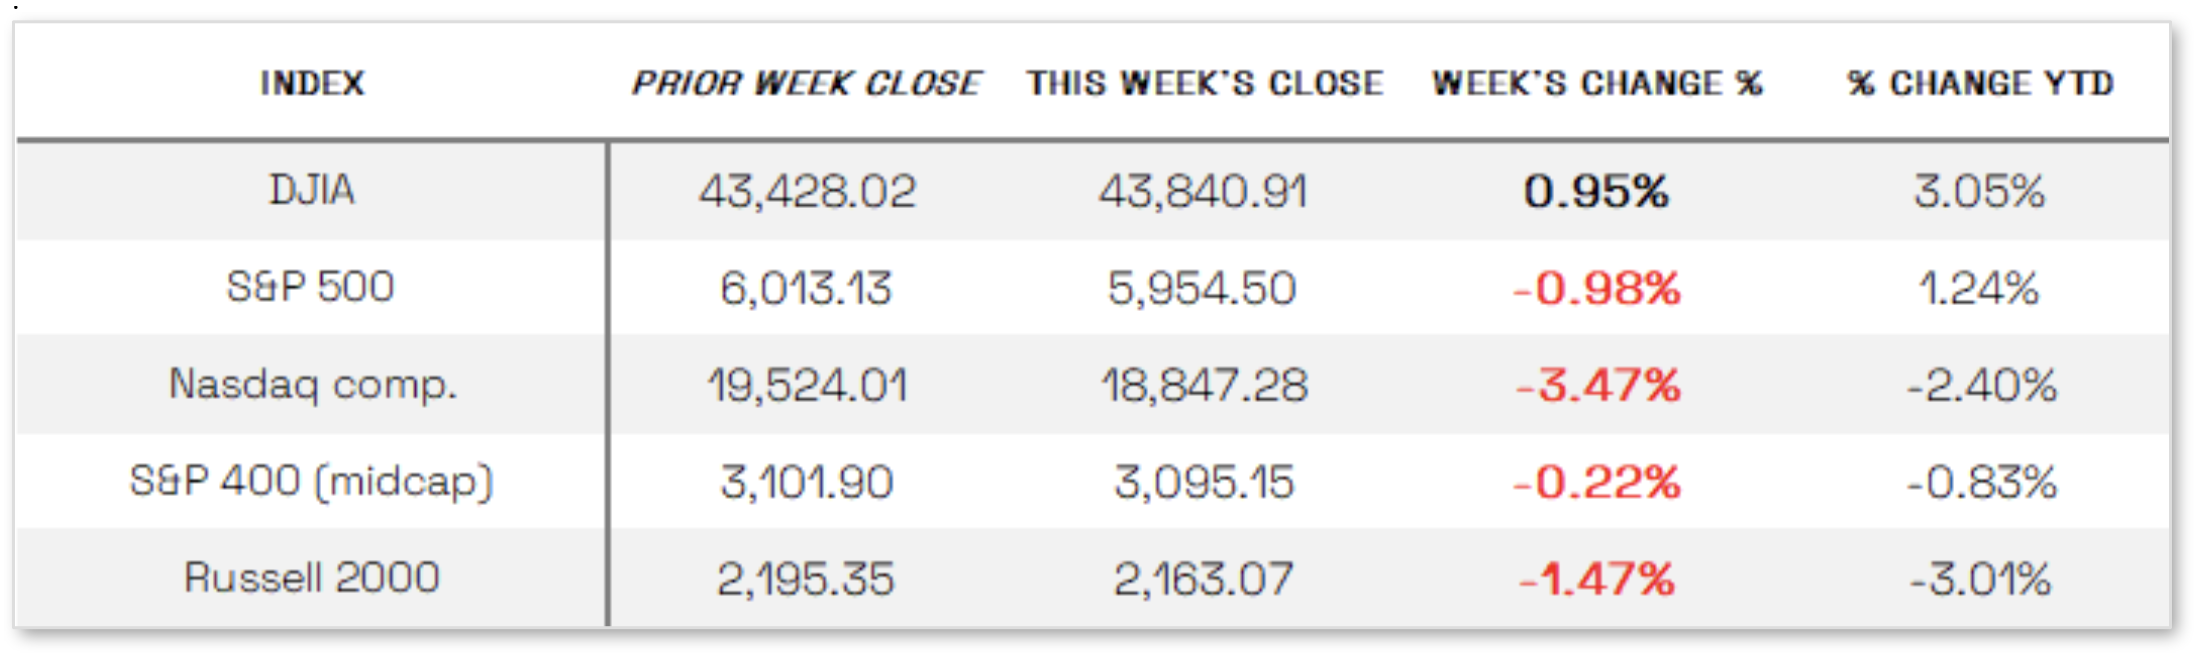
> The Dow Jones Industrial Average (DJIA) is the oldest continuing U.S. market index with over 100 years of history and is made up of 30 highly reputable “blue-chip” U.S. stocks (e.g. Coca-Cola Co., Microsoft). The Dow ended the week up 0.95% at 43,840.91 vs the prior week of 43,428.02.
> The Nasdaq Composite Index tracks most of the stocks listed on the Nasdaq Stock Market – the second-largest stock exchange in the world. Over half of all stocks on the NASDAQ are tech stocks. The tech-driven Nasdaq ended the week down 3.47%, closing at 18,847.28 vs. the prior week of 19,524.01.
> The S&P 500 large-cap index is a market-capitalization-weighted index of 500 leading publicly traded companies in the U.S. The S&P 500 is regarded as one of the best gauges of prominent American equities’ performance, and by extension, that of the stock market overall. The S&P 500 ended the week down 0.98%, closing at 5,954.50 compared to last week’s 6,013.13.
> The S&P 400 mid-cap index is the benchmark index made up of 400 stocks that broadly represent companies with midrange market capitalization between $3.6 billion and $13.1 billion. It is used by investors as a gauge for market performance and directional trends in U.S. stocks. The S&P 400 mid-cap ended the week down 0.22%, closing at 3,095.15 compared to last week’s 3,101.90.
> The Russell 2000 (RUT) small-cap index measures the performance of the 2,000 smaller companies included in the Russell 3000 Index. The Russell 2000 is managed by London’s FTSE Russell Group and is widely regarded as a leading indicator of the U.S. economy because of its focus on smaller companies that focus on the U.S. market. The Russell 2000 ended the week down 1.47%, closing at 2,163.07 compared to last week’s 2,195.35.
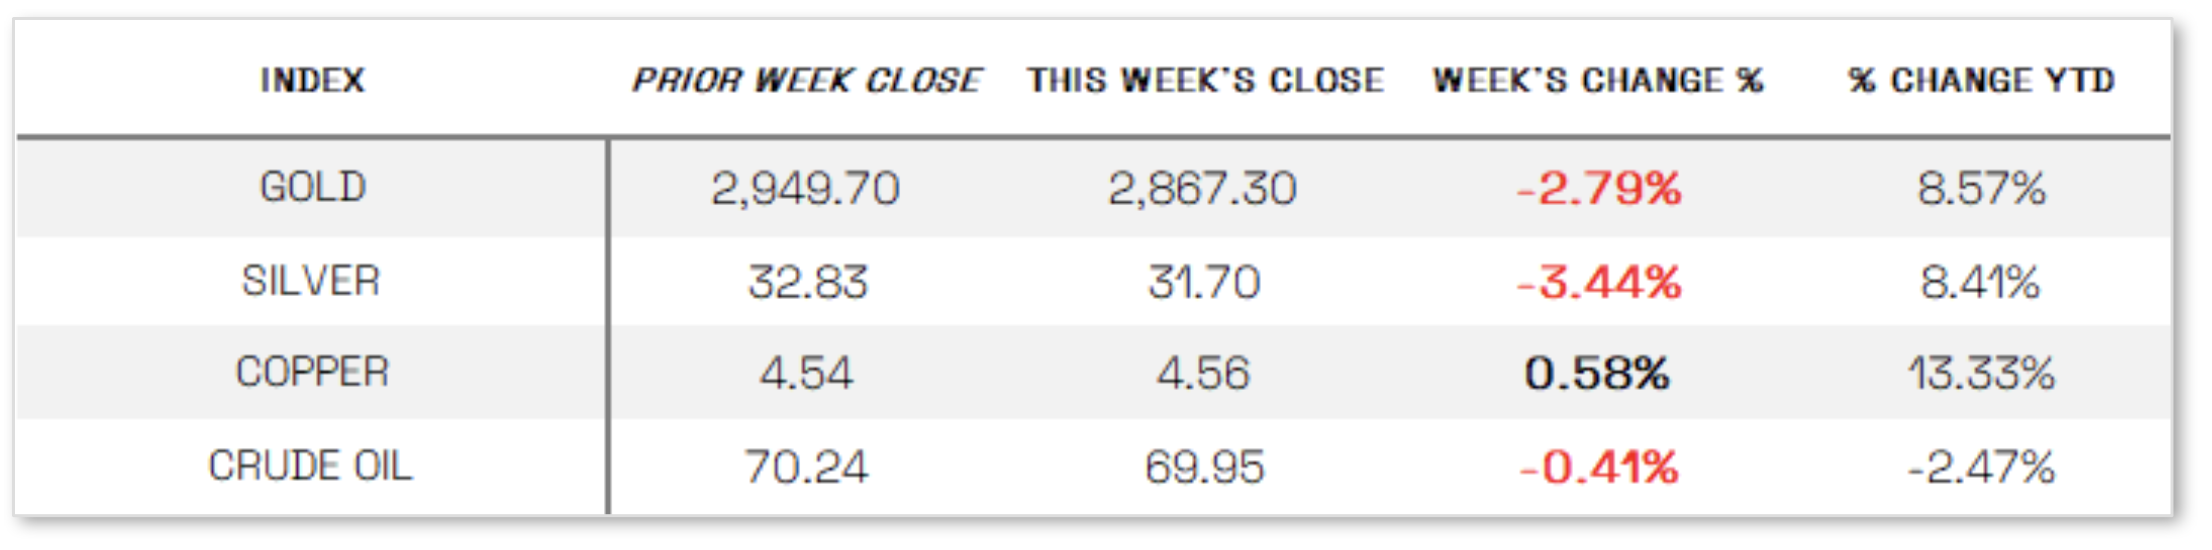
U.S. Commodities/Futures:
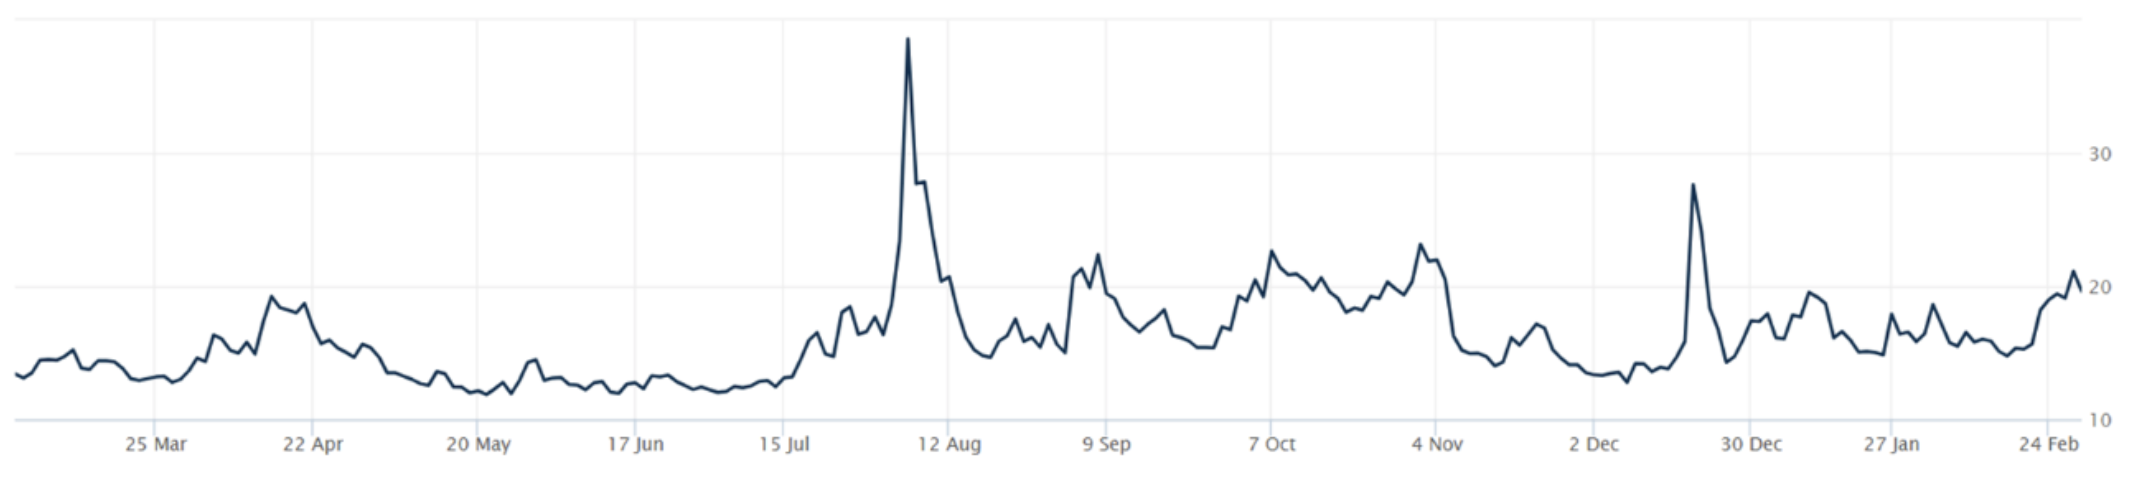
THE VOLATILITY INDEX (VIX) closed at 19.63 this week, a 7.8% increase vs last week’s close of 18.21.
International Markets:
THIS WEEK’S ECONOMIC NEWS
U.S. Economic News:
Negative Economic Pressure: Persistent inflation continued to weigh on consumer confidence, as the Labor Department’s core PCE price index showed prices rising 0.3% in January and 2.6% year-over-year—down from December’s 2.9% but still above the Fed’s 2% target. Despite a 0.9% rise in personal incomes, consumer spending contracted, suggesting caution amid inflation and economic uncertainty. Reflecting this sentiment, The Conference Board’s Consumer Confidence Index fell 7 points to 98.3 in February, the sharpest drop since August 2021, with expectations for income, business, and labor conditions falling below 80, a potential recession signal. Inflation expectations also surged from 5.2% to 6%, adding to economic concerns. Meanwhile, the Commerce Department reported that fourth-quarter GDP grew at an annualized 2.3%, unchanged from prior estimates, with full-year growth at 2.8%, driven by strong consumer spending. However, labor market data showed weakness, as jobless claims for the week ending February 22 rose by 22,000 to 242,000—the highest since October—while the four-week average climbed to 224,000, though continuing jobless claims edged slightly lower to 1.86 million.
International Economic News:
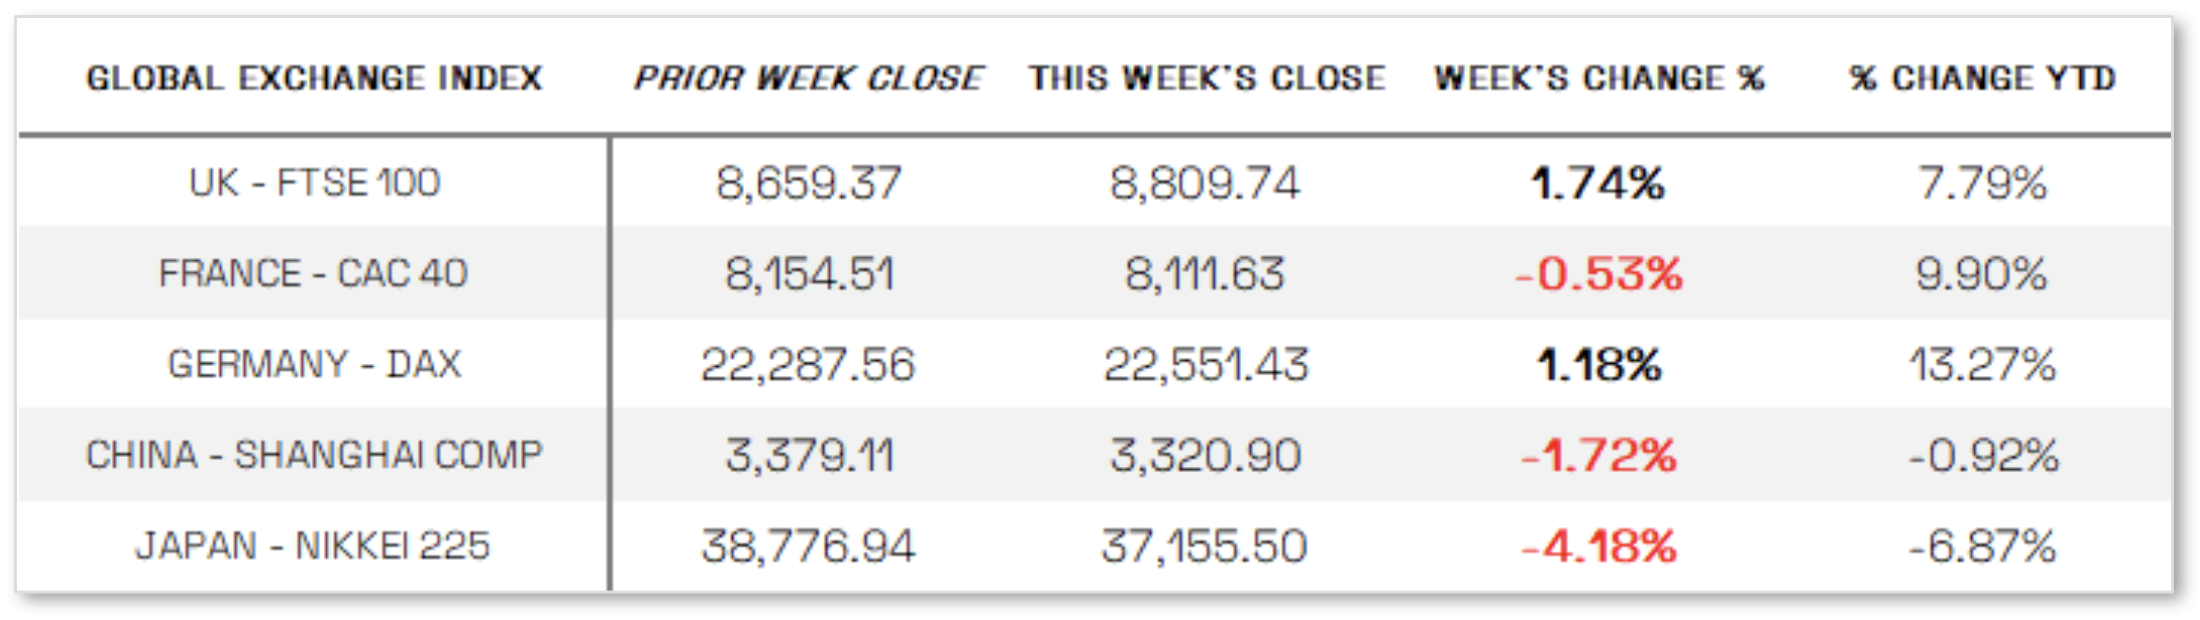
EUROPE: The pan-European STOXX Europe 600 Index rose 0.60%, marking its longest weekly winning streak since August 2012, as strong corporate earnings and gains in defense stocks helped offset uncertainty over U.S. trade policy. Major indexes were mixed, with Germany’s DAX up 1.18%, Italy’s FTSE MIB rising 0.61%, and the UK’s FTSE 100 gaining 1.74%, while France’s CAC 40 declined 0.53%. Inflation data from Germany, France, and Italy for February presented a mixed picture, with Germany’s rate steady at 2.8% (above forecasts), Italy’s unchanged at 1.7% (below expectations), and France’s falling to a four-year low of 0.9%. Final GDP estimates confirmed that Germany’s economy contracted by 0.2% in Q4, while France’s shrank by 0.1%. Meanwhile, minutes from the European Central Bank’s January meeting showed policymakers remained confident that inflation was returning to the 2% target but noted some upside risks, prompting calls for caution on the pace and scale of future rate cuts, though consumer inflation expectations for the short and long term appeared stable
JAPAN: Japan’s stock markets declined over the week, with the Nikkei 225 falling 4.18% and the TOPIX Index dropping 1.99%, as domestic chip and AI-related stocks tumbled amid a broader sell-off in U.S. tech. Investor concerns also grew over potential economic fallout from escalating U.S. tariffs, including an additional 10% duty on Chinese imports, and how this might influence the Bank of Japan’s (BoJ) monetary policy normalization. BoJ Governor Kazuo Ueda acknowledged uncertainties surrounding the impact of U.S. tariffs on the global economy and stated that the central bank would assess these risks when shaping policy, reiterating its readiness to increase Japanese government bond (JGB) purchases if yields rise abnormally. Reflecting soft inflation data, the 10-year JGB yield fell to 1.37% from 1.43% the prior week, while Tokyo-area core consumer inflation slowed to 2.2% year-over-year in February, below forecasts, as government energy subsidies helped ease price pressures.
CHINA: Mainland Chinese stock markets declined for the week as the U.S. escalated measures targeting China’s economy, with the CSI 300 Index dropping 2.22% and the Shanghai Composite falling 1.72%, while Hong Kong’s Hang Seng Index lost 2.28%, according to FactSet. Most of the declines occurred on Friday after President Trump announced an additional 10% tariff on Chinese imports effective March 4, alongside 25% tariffs on Canada and Mexico, following a previous 10% levy on all Chinese goods imposed on February 4. In response, China vowed to take “all necessary measures” to defend its interests, according to a Ministry of Commerce spokesperson. The tariff announcement came just days after the Trump administration directed the Committee on Foreign Investment in the U.S. (CFIUS) to curb Chinese investments in strategic sectors like technology and energy. Additionally, the U.S. plans to tighten restrictions on semiconductor technology exports to China and has urged Japan and the Netherlands to strengthen their own controls on China’s chip industry. While restricting U.S. tech exports aligns with policies from the Biden administration, many analysts saw the CFIUS directive as further evidence of an accelerating economic decoupling between the two largest global economies.
Sources:
>> All index and returns data from Norgate Data and Commodity Systems Incorporated and Wall Street Journal.
>> News from Reuters, Barron’s, Wall St. Journal, Bloomberg.com, ft.com, guggenheimpartners.com, zerohedge.com, ritholtz.com, markit.com, financialpost.com, Eurostat, Statistics Canada, Yahoo! Finance, stocksandnews.com, marketwatch.com, visualcapitalist.com, wantchinatimes.com, BBC, 361capital.com, pensionpartners.com, cnbc.com, FactSet, Morningstar/Ibbotson Associates, Corporate Finance Institute.
>> Commentary from T Rowe Price Global markets weekly update — https://www.troweprice.com/personal-investing/resources/insights/global-markets-weekly-update.html
Disclosures: This material and any mention of specific investments is provided for informational purposes only and is not intended to be investment advice or a recommendation to take any action. The forecasts or forward-looking statements are based on assumptions, may not materialize, and are subject to revision without notice. The market indexes discussed are unmanaged, and generally, considered representative of their respective markets. Index performance is not indicative of the past performance of a particular investment. Indexes do not incur management fees, costs, and expenses. Individuals cannot directly invest in unmanaged indexes. Past performance does not guarantee future results.
