


THE COMPLETE PICTURE
>> Four indicators across three time frames.
>> When all of the Sherman Portfolios indicators are in a Positive status, we read the market as being in a Bull Market.
1. DELTA-V — Positive since April 21, 2023
2. GALACTIC SHIELD — Positive since April 1, 2023
3. STARFLUX— Positive since Aug 23, 2024
4. STARPATH — Positive since November 10, 2023
The shorter term picture:
>> GALACTIC SHIELD — POSITIVE for Q1 2025, indicating positive prospects for equities in the first quarter of 2025. This indicator is based on the combination of U.S. and International Equities trend statuses at the start of each quarter.
>> STARFLUX— POSITIVE, Starflux ended the week at 5.26 (down 28.73% last week) This short-term indicator measures U.S. Equities.
>> STARPATH — POSITIVE, This indicator measures the interplay on dual timeframes of our Type 1s + the Russell 3000 + our four most ‘pro-cyclical’ Type 3s, vs. Cash.
The big picture:
The ‘big picture’ is the (typically) years-long timeframe, the same timeframe in which Cyclical Bulls and Bears operate.
>> The Sherman Portfolios DELTA-V Indicator measuring the Bull/Bear cycle finished the week in BULL status at 60.10, down 3.61% from the prior week’s 62.35. It has signaled Bull since April 21, 2023.
>> The Sherman Portfolios DELTA-V Bond Indicator measuring the Bull/Bear cycle finished the week in BULL status at 55.72, up 2.86% from the prior week’s 54.17. It has signaled Bull since December 15, 2023.
The very big picture (a historical perspective):
The CAPE is now at 37.97. The long-term valuation of the market is commonly measured by the Cyclically Adjusted Price to Earnings ratio, or “CAPE”, which smooths-out shorter-term earnings swings in order to get a longer-term assessment of market valuation. In the past, the CAPE ratio has proved its importance in identifying potential bubbles and market crashes. An extremely high CAPE ratio means that a company’s stock price is substantially higher than the company’s earnings would indicate and, therefore, overvalued. It is generally expected that the market will eventually correct the company’s stock price by pushing it down to its true value. The historical average of the ratio for the S&P 500 Index is between 15-16, while the highest levels of the ratio have exceeded 30.
The record-high levels occurred three times in the history of the U.S. financial markets. The first was in 1929 before the Wall Street crash that signaled the start of the Great Depression. The second was in the late 1990s before the Dotcom Crash, and the third came in 2007 before the 2007-2008 Financial Crisis. https://www.multpl.com/shiller-pe
HISTORY OF THE CAPE VALUE FROM 1871 TO PRESENT
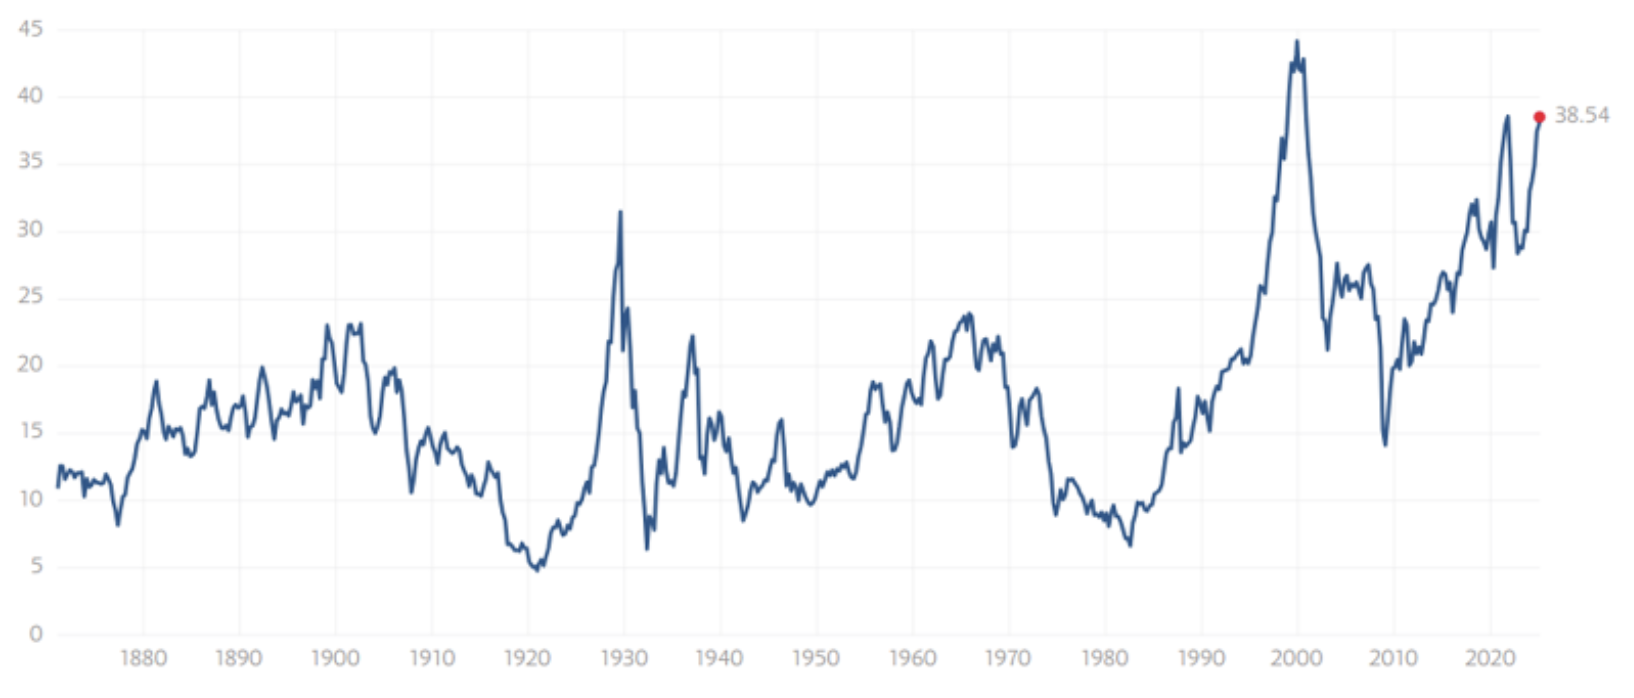 Note: We do not use CAPE as an official input into our methods. However, we think history serves as a guide and that it’s good to know where we are on the historic continuum. https://www.multpl.com/shiller-pe
THIS WEEK IN THE MARKETS
U.S. Markets:
Stocks down over trade concerns:
Stocks fell during the holiday-shortened week amid geopolitical tensions and concerns over consumer spending. After markets closed Monday for Presidents’ Day, stocks initially trended up, pushing the S&P 500 to record highs on Tuesday and Wednesday. However, sharp losses in the latter half of the week erased those gains, leading major indexes to finish lower. Investor sentiment was influenced by geopolitical developments, including President Donald Trump’s efforts to resolve the Russia-Ukraine conflict and his announcement of potential tariffs on automobiles, pharmaceuticals, and lumber, though details remained unclear. On Thursday, Walmart’s fourth-quarter earnings report further dampened sentiment despite beating expectations, as its weaker-than-expected guidance raised concerns about consumer spending and economic health. This followed a Commerce Department report showing the largest retail sales decline in nearly two years, with Walmart shares dropping 6.53% on Thursday.
Looking at the US Indexes:
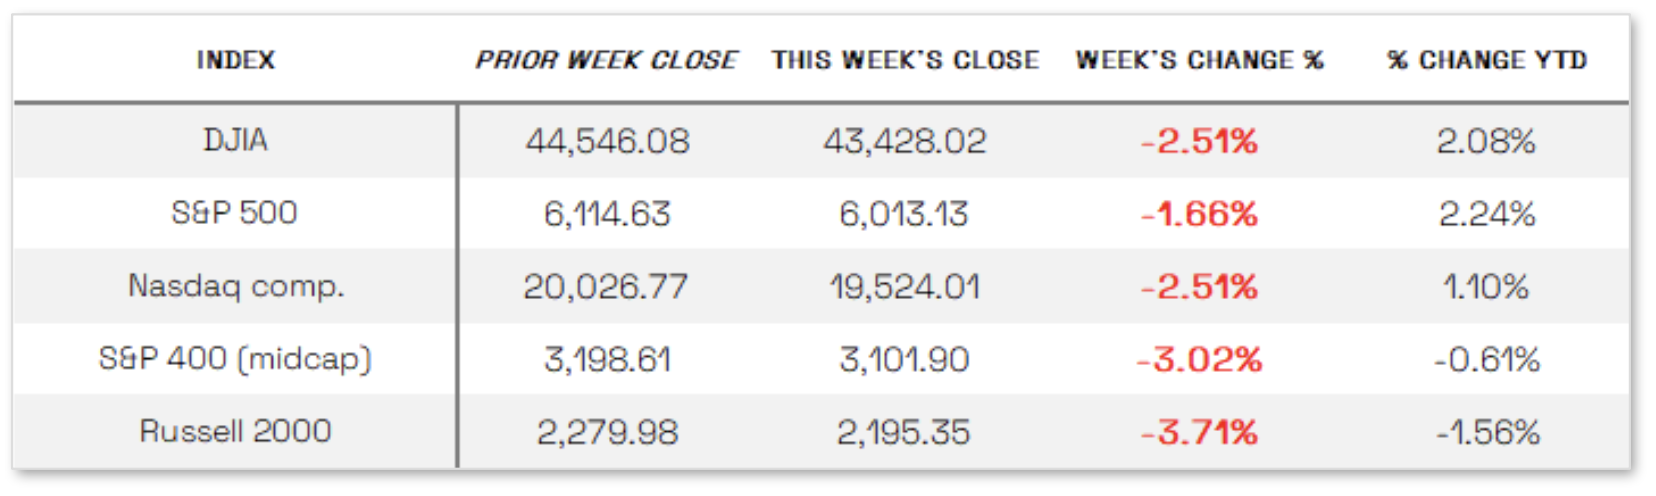
> The Dow Jones Industrial Average (DJIA) is the oldest continuing U.S. market index with over 100 years of history and is made up of 30 highly reputable “blue-chip” U.S. stocks (e.g. Coca-Cola Co., Microsoft). The Dow ended the week down 2.51% at 43,428.02 vs the prior week of 44,546.08.
> The Nasdaq Composite Index tracks most of the stocks listed on the Nasdaq Stock Market – the second-largest stock exchange in the world. Over half of all stocks on the NASDAQ are tech stocks. The tech-driven Nasdaq ended the week down 2.51%, closing at 19,524.01 vs. the prior week of 20,026.77.
> The S&P 500 large-cap index is a market-capitalization-weighted index of 500 leading publicly traded companies in the U.S. The S&P 500 is regarded as one of the best gauges of prominent American equities’ performance, and by extension, that of the stock market overall. The S&P 500 ended the week down 1.66%, closing at 6,013.13 compared to last week’s 6114.63.
> The S&P 400 mid-cap index is the benchmark index made up of 400 stocks that broadly represent companies with midrange market capitalization between $3.6 billion and $13.1 billion. It is used by investors as a gauge for market performance and directional trends in U.S. stocks. The S&P 400 mid-cap ended the week down 3.02%, closing at 3,101.90 compared to last week’s 3198.61.
> The Russell 2000 (RUT) small-cap index measures the performance of the 2,000 smaller companies included in the Russell 3000 Index. The Russell 2000 is managed by London’s FTSE Russell Group and is widely regarded as a leading indicator of the U.S. economy because of its focus on smaller companies that focus on the U.S. market. The Russell 2000 ended the week down 3.71%, closing at 2,195.35 compared to last week’s 2279.98.
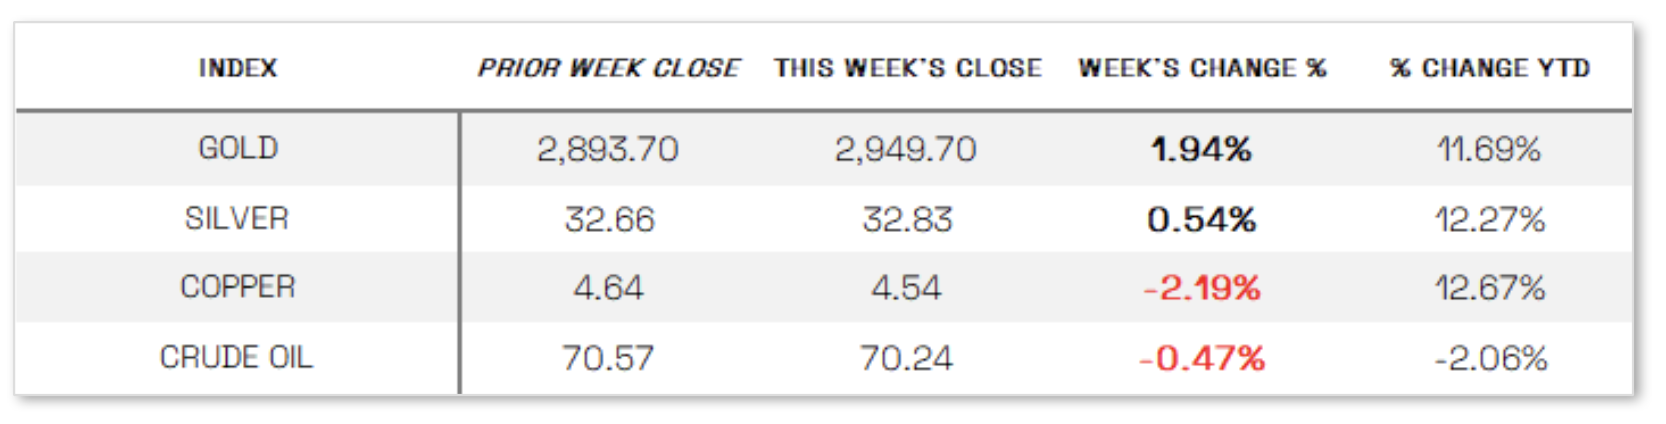
U.S. Commodities/Futures:
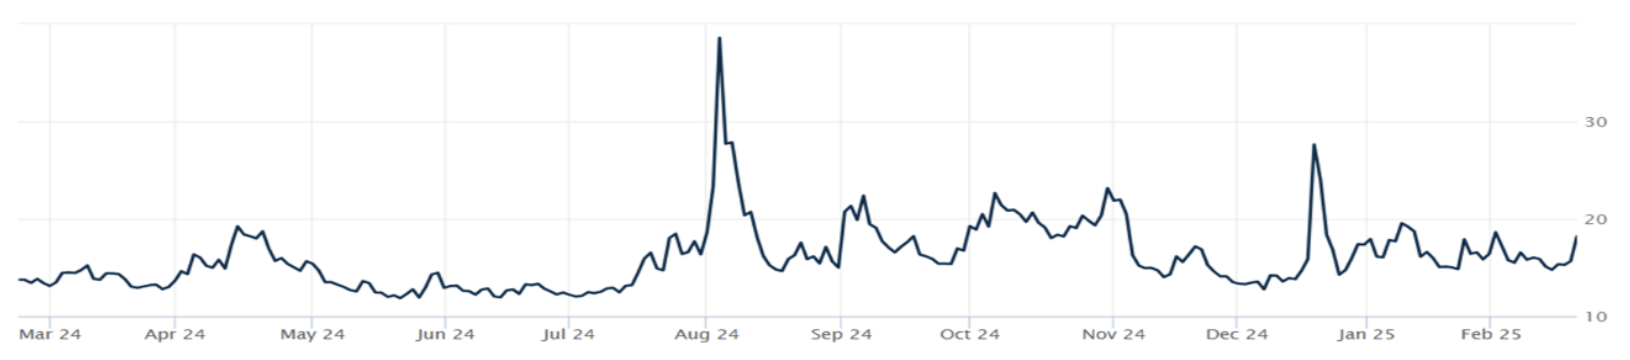
THE VOLATILITY INDEX (VIX) closed at 18.21 this week, a 23.3% increase vs last week’s close of 14.77.
International Markets:
THIS WEEK’S ECONOMIC NEWS
U.S. Economic News:
Negative Economic Pressure: Beyond Walmart’s cautious guidance, economic data releases did little to boost confidence throughout the week. The National Association of Home Builders reported a drop in its housing market index to 42 in February, the lowest in five months, citing tariff uncertainty, high mortgage rates, and elevated housing costs as key concerns. January housing starts also fell nearly 10% from December, reflecting weaker construction activity. Meanwhile, S&P Global’s flash Composite PMI showed U.S. business activity nearly stalled in February, with a 17-month low reading of 50.4, as services sector activity contracted for the first time in over two years amid policy uncertainty and rising input costs. Consumer sentiment also deteriorated, with the University of Michigan’s Index of Consumer Sentiment falling nearly 10% to 64.7, driven by a sharp decline in buying conditions for durable goods due to fears of tariff-induced price hikes. Additionally, inflation expectations for the year ahead surged to 4.3%, up from 3.3% in January.
International Economic News:
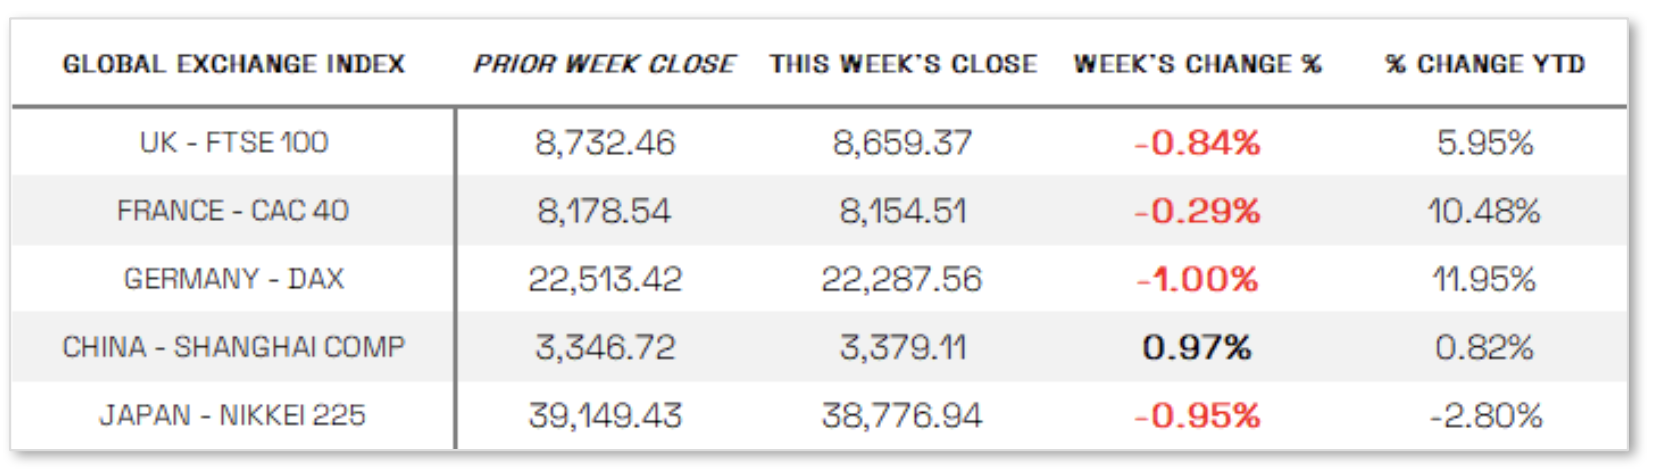
EUROPE: The pan-European STOXX Europe 600 Index rose 0.26% amid cautious optimism as investors assessed U.S. trade policy developments and efforts to resolve the Russia-Ukraine conflict, while major stock indexes were mixed; Germany’s DAX fell 1.00% ahead of the federal election, France’s CAC 40 eased 0.29%, Italy’s FTSE MIB gained 1.17%, and the UK’s FTSE 100 lost 0.84%. Eurozone business activity remained in expansionary territory for the second consecutive month, with the HCOB Flash Eurozone Composite PMI Output Index holding steady at 50.2, though new orders remained weak, staffing levels declined, and input cost inflation accelerated. Germany saw a second month of output growth, while France experienced a sharp decline, and the rest of the bloc showed solid expansion. In the UK, the Composite PMI stayed above 50 but declined slightly from January, with private sector employment falling at the sharpest rate since November 2020 due to rising payroll costs and weak demand.
JAPAN: Japan’s stock markets declined over the week, with the Nikkei 225 losing 0.95% and the TOPIX falling 0.82%, weighed down by yen strength, rising Japanese government bond yields, and pressure from U.S. President Donald Trump’s tariff threats. The yen appreciated to around JPY 150.4 per U.S. dollar from 152.3 the previous week, as higher-than-expected consumer inflation fueled speculation that the Bank of Japan might adopt a more aggressive approach to interest rate hikes. Japan’s nationwide core CPI rose 3.2% year over year in January, surpassing expectations of 3.1% and up from 3.0% in December, driven by rising rice and energy costs. Economic growth data reinforced this view, with GDP expanding 0.7% quarter on quarter in Q4 2024, exceeding the 0.3% consensus and up from 0.4% in Q3, translating to an annualized growth rate of 2.8% in the final three months of the year.
CHINA: Mainland Chinese stock markets rose over the week, driven by strength in technology shares following better-than-expected earnings from leading tech companies, with the CSI 300 gaining 1.00% and the Shanghai Composite adding 0.97% in local currency terms, according to FactSet. In Hong Kong, the Hang Seng Index surged 3.79%, fueled by a rally in Alibaba shares after the company reported stronger-than-expected sales growth in the December quarter. Investor sentiment improved after local AI startup DeepSeek showcased its capabilities in January, reigniting interest in China’s internet sector, and a high-profile meeting between President Xi Jinping and Chinese tech entrepreneurs signaled greater government support for private companies. Photos from the February 17 meeting, widely circulated in state media, featured Alibaba founder Jack Ma, whose presence was notable given Beijing’s abrupt cancellation of Ant Group’s IPO in 2020, which marked the beginning of a regulatory crackdown on the tech sector. However, growing tensions with the U.S. have highlighted the private sector’s critical role in China’s economy, which remains under pressure from a prolonged property downturn and weak domestic demand.
Sources:
>> All index and returns data from Norgate Data and Commodity Systems Incorporated and Wall Street Journal.
>> News from Reuters, Barron’s, Wall St. Journal, Bloomberg.com, ft.com, guggenheimpartners.com, zerohedge.com, ritholtz.com, markit.com, financialpost.com, Eurostat, Statistics Canada, Yahoo! Finance, stocksandnews.com, marketwatch.com, visualcapitalist.com, wantchinatimes.com, BBC, 361capital.com, pensionpartners.com, cnbc.com, FactSet, Morningstar/Ibbotson Associates, Corporate Finance Institute.
>> Commentary from T Rowe Price Global markets weekly update — https://www.troweprice.com/personal-investing/resources/insights/global-markets-weekly-update.html
Disclosures: This material and any mention of specific investments is provided for informational purposes only and is not intended to be investment advice or a recommendation to take any action. The forecasts or forward-looking statements are based on assumptions, may not materialize, and are subject to revision without notice. The market indexes discussed are unmanaged, and generally, considered representative of their respective markets. Index performance is not indicative of the past performance of a particular investment. Indexes do not incur management fees, costs, and expenses. Individuals cannot directly invest in unmanaged indexes. Past performance does not guarantee future results.
