


The very big picture (a historical perspective): The CAPE is now at 36.21–Up 1.86% this month.
The long-term valuation of the market is commonly measured by the Cyclically Adjusted Price to Earnings ratio, or “CAPE”, which smooths-out shorter-term earnings swings in order to get a longer-term assessment of market valuation. In the past, the CAPE ratio has proved its importance in identifying potential bubbles and market crashes. An extremely high CAPE ratio means that a company’s stock price is substantially higher than the company’s earnings would indicate and, therefore, overvalued. It is generally expected that the market will eventually correct the company’s stock price by pushing it down to its true value. The historical average of the ratio for the S&P 500 Index is between 15-16, while the highest levels of the ratio have exceeded 30.
The record-high levels occurred three times in the history of the U.S. financial markets. The first was in 1929 before the Wall Street crash that signaled the start of the Great Depression. The second was in the late 1990s before the Dotcom Crash, and the third came in 2007 before the 2007-2008 Financial Crisis. https://www.multpl.com/shiller-pe
HISTORY OF THE CAPE VALUE FROM 1871 TO PRESENT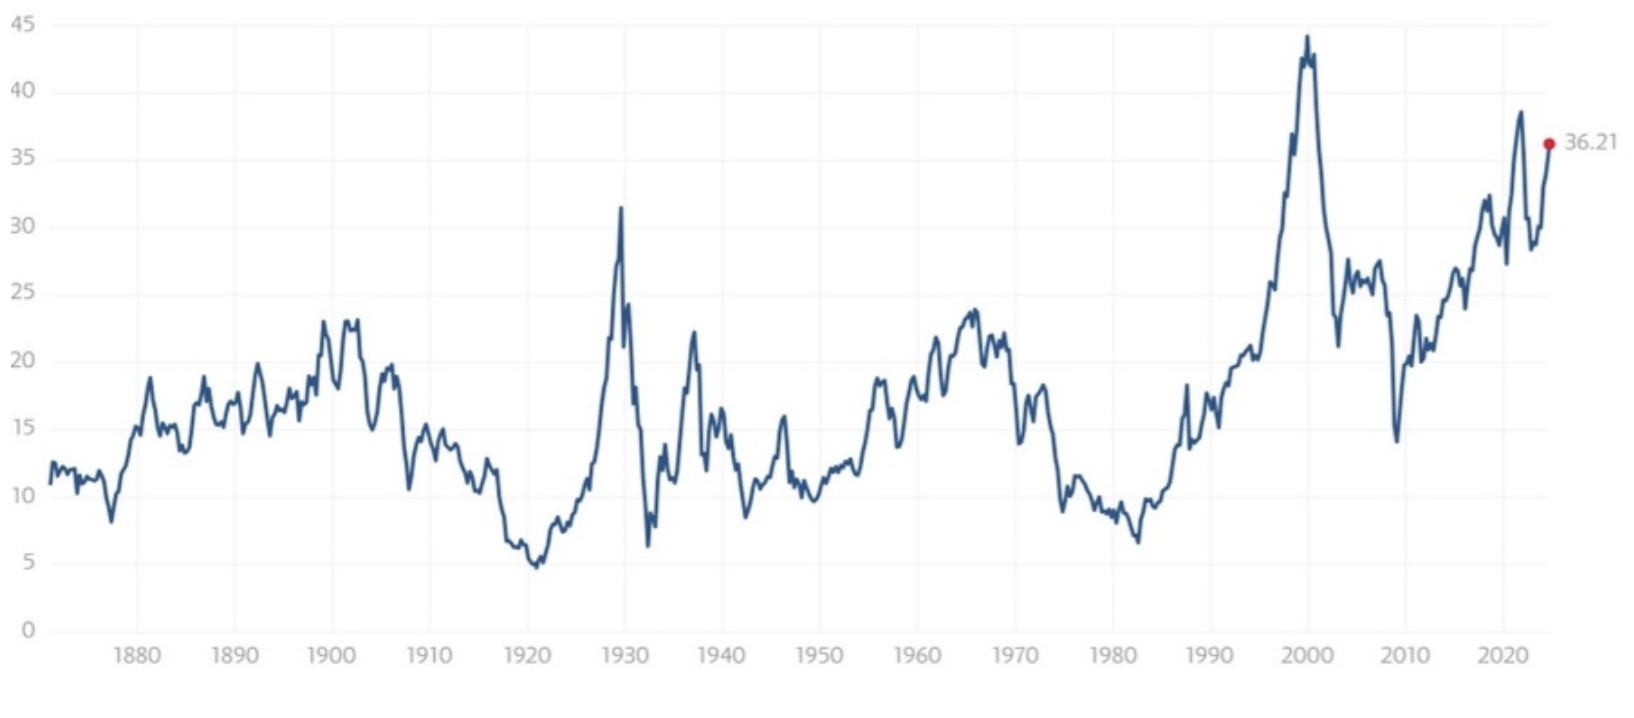
Note: We do not use CAPE as an official input into our methods. However, we think history serves as a guide and that it’s good to know where we are on the historic continuum. https://www.multpl.com/shiller-pe
The big picture: The ‘big picture’ is the (typically) years-long timeframe, the same timeframe in which Cyclical Bulls and Bears operate. The Sherman Portfolios DELTA-V Indicator measuring the Bull/Bear cycle finished the week in BULL status at 69.76, down 0.04% from the prior week’s 69.79. It has signaled Bull since April 21, 2023. The Sherman Portfolios DELTA-V Bond Indicator measuring the Bull/Bear cycle finished the week in BULL status at 72.49, up 2.49% from the prior week’s 70.73 It has signaled Bull since December 15, 2023.
The shorter term picture: GALACTIC SHIELD — POSITIVE for Q3 2024 indicating positive prospects for equities in the third quarter of 2024. This indicator is based on the combination of U.S. and International Equities trend statuses at the start of each quarter.STARFLUX— POSITIVE, ended the week at 8.76 (up 90.02% last week). This short-term indicator measures U.S. Equities. STARPATH — POSITIVE, This indicator measures the interplay on dual timeframes of our Type 1s + the Russell 3000 + our four most ‘pro-cyclical’ Type 3s, vs. Cash.
The complete picture (four indicators across three timeframes): When all four of the Sherman Portfolios indicators are in a POSITIVE status, we read the market as being in a CYCLICAL BULL MARKET.
1. DELTA-V — Positive
2. GALACTIC SHIELD — Positive
3. STARFLUX— Positive
4. STARPATH — Positive
THIS WEEK IN THE MARKETS
U.S. Markets: Markets up despite inflation data. Stocks rebounded strongly from the previous week’s steep losses, with the S&P 500 recovering from its worst decline since March 2023. Growth stocks, particularly in the technology sector, outperformed value shares, driven by a strong performance from NVIDIA, which boosted market sentiment with its positive outlook on artificial intelligence at an investment conference. Core inflation came in slightly higher than expected, with consumer prices rising 0.3% in August, but headline inflation dropped to 2.5%, its lowest level since early 2021. Despite the initial dip in stocks following the inflation news, NVIDIA’s impact helped turn the market around. In the housing sector, there were slight signs of improvement, with mortgage rates falling to 6.29%, their lowest since February 2023, and home loan applications showing a modest recovery from August lows.
Looking at the US Indexes:
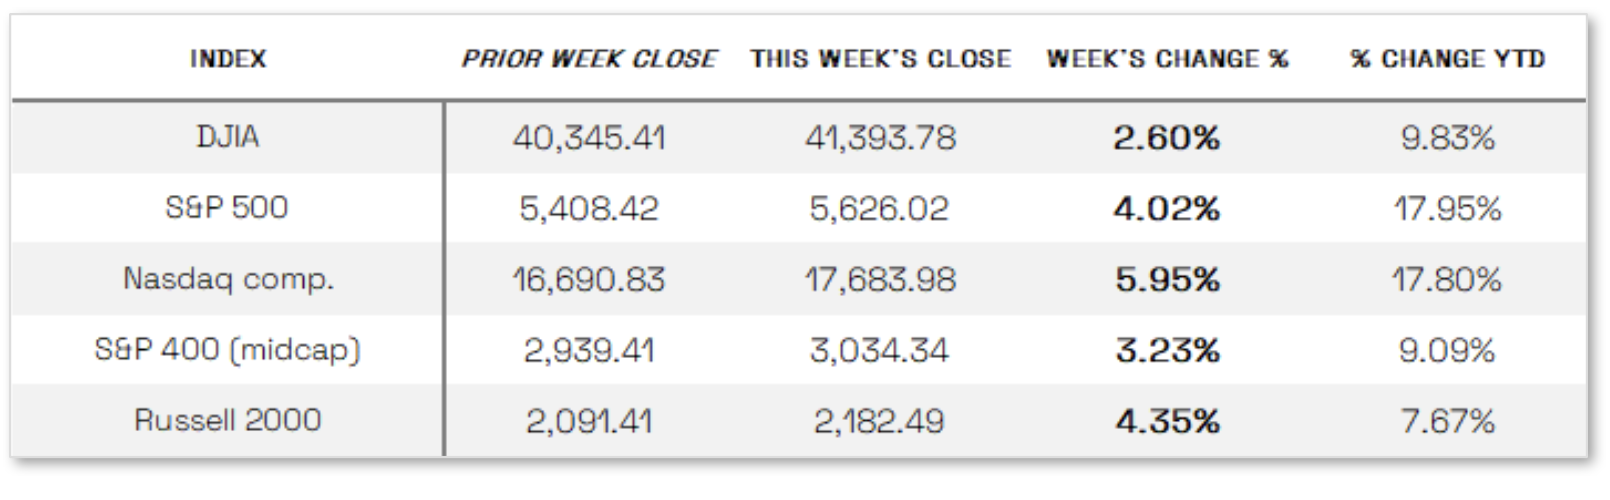
The Dow Jones Industrial Average (DJIA) is the oldest continuing U.S. market index with over 100 years of history and is made up of 30 highly reputable “blue-chip” U.S. stocks (e.g. Coca-Cola Co., Microsoft). The Dow ended the week up 2.60% at 41,393.78 vs the prior week of 40,345.41.
The Nasdaq Composite Index tracks most of the stocks listed on the Nasdaq Stock Market – the second-largest stock exchange in the world. Over half of all stocks on the NASDAQ are tech stocks. The tech-driven Nasdaq ended the week up 5.95%, closing at 17,683.98 vs. the prior week of 16,690.83
The S&P 500 large-cap index is a market-capitalization-weighted index of 500 leading publicly traded companies in the U.S. The S&P 500 is regarded as one of the best gauges of prominent American equities’ performance, and by extension, that of the stock market overall. The S&P 500 ended the week up 4.02%, closing at 5626.02 compared to last week’s 5408.42.
The S&P 400 mid-cap index is the benchmark index made up of 400 stocks that broadly represent companies with midrange market capitalization between $3.6 billion and $13.1 billion. It is used by investors as a gauge for market performance and directional trends in U.S. stocks. The S&P 400 mid-cap ended the week up 3.23%, closing at 3034.34 compared to last week’s 2939.41.
The Russell 2000 (RUT) small-cap index measures the performance of the 2,000 smaller companies included in the Russell 3000 Index. The Russell 2000 is managed by London’s FTSE Russell Group and is widely regarded as a leading indicator of the U.S. economy because of its focus on smaller companies that focus on the U.S. market. The Russel 2000 ended the week up 4.35%, closing at 2182.49 compared to last week’s 2091.41.
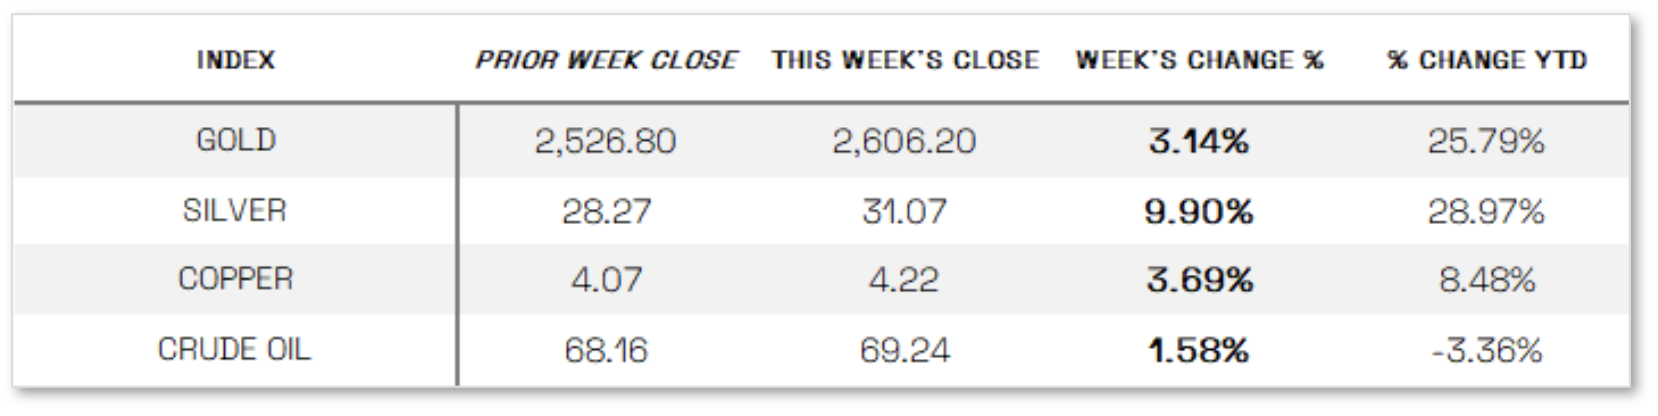
U.S. Commodities/Futures:
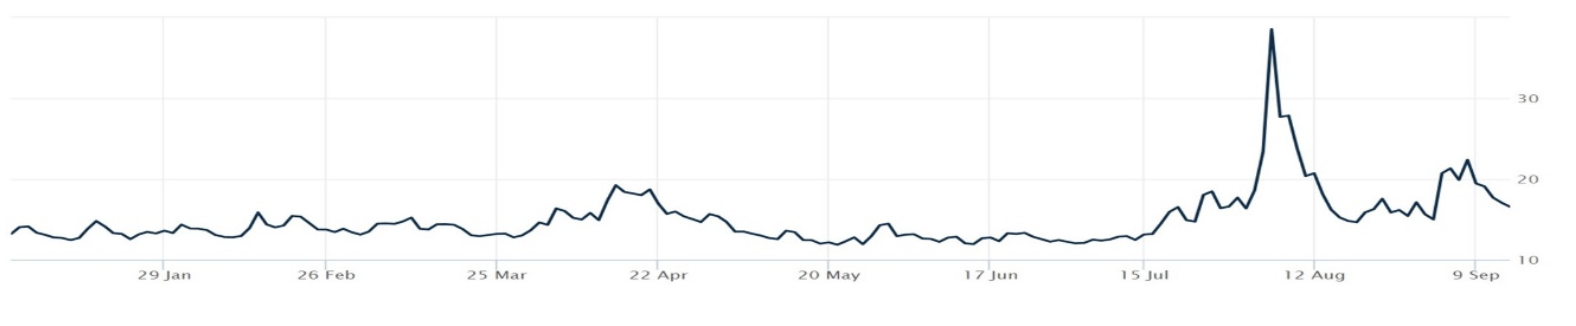
THE VOLATILITY INDEX (VIX)closed at 16.56 this week, a 26.0% Decrease vs last week’s close of 22.38.
 International Markets:
THIS WEEK’S ECONOMIC NEWS
U.S. Economic News: Mixed Job Data. Treasury Yields fall. Treasury yields dipped during the week, with the 10-year Treasury note reaching year-to-date lows, as bond prices and yields move inversely. Yields on tax-exempt municipal bonds remained relatively steady, despite investors anticipating a surge in new issuance in the coming weeks, while muni inflows for the week were the second-largest of the year. The investment-grade corporate bond market was quiet but stable, with new issuances limited to Thursday, and shorter-maturity bonds outperforming. High yield bonds benefited from strong equity gains and expectations of a potential rate cut by the Federal Reserve at its upcoming meeting.
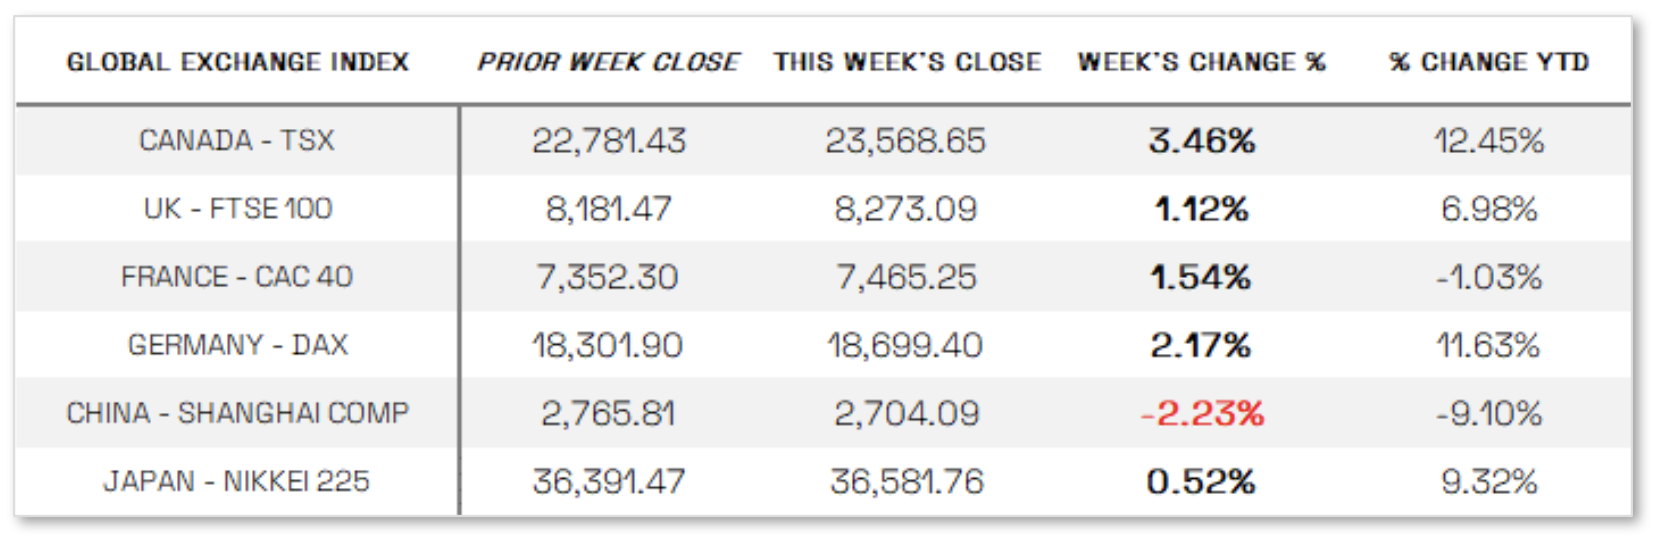
International Economic News: EUROPE: The pan-European STOXX Europe 600 Index rose 1.85% for the week, driven by an interest rate cut from the European Central Bank (ECB). Germany’s DAX gained 2.17%, France’s CAC 40 increased by 1.54%, Italy’s FTSE MIB added 0.83%, and the UK’s FTSE 100 rose 1.12%. The ECB lowered its deposit rate by a quarter-point to 3.5%, marking its second rate cut this year, amid weakening economic growth and slowing inflation in the eurozone. While the ECB emphasized caution and refrained from signaling future rate moves, its forecast for core inflation was revised slightly higher due to stronger services prices. The bank also cut its economic growth projections, expecting the eurozone to expand by 0.8% this year, and by 1.3% and 1.5% in 2025 and 2026, respectively.
JAPAN: Japan’s stock markets had mixed performance over the week, with the Nikkei 225 Index gaining 0.52% while the broader TOPIX Index declined by 1.0%. Exporters faced challenges as the yen strengthened to the higher end of the JPY 140 range against the USD, up from JPY 142.3 the previous week, driven by hawkish expectations for the Bank of Japan’s (BoJ) monetary policy. BoJ policymakers hinted at further interest rate hikes, with Junko Nakagawa suggesting adjustments to monetary easing if economic and inflation targets are met, and Naoki Tamura advocating for raising the short-term rate to around 1% by fiscal 2026. Despite these signals, the yield on the 10-year Japanese government bond dipped to 0.84%, tracking lower U.S. bond yields amid speculation of a significant rate cut by the Federal Reserve. Japan’s second-quarter GDP growth was revised down to 2.9% from an initial 3.1%, with weaker contributions from private consumption and capital expenditure. Inflation eased, with the consumer price index rising 2.5% year over year in August, down from 3.0% in July, as the stronger yen reduced import costs.
CHINA: Chinese stocks declined as weak inflation data fueled concerns about a potential price-wage spiral impacting the economy. The Shanghai Composite Index dropped 2.23%, while Hong Kong’s Hang Seng Index fell 0.43%. China’s consumer price index rose 0.6% year-on-year in August, slightly higher than July’s 0.5% but below expectations. Core inflation slowed to 0.3%, its lowest in over three years, while the producer price index fell 1.8%, deepening from July’s 0.8% decline. This deflation in factory gate prices, which began in late 2022, sparked calls for Beijing to implement stronger measures to prevent a cycle of falling corporate revenues, wages, and consumer spending. On the trade front, exports exceeded expectations, growing 8.7% in August compared to 7% in July, while imports rose only 0.5%, down from July’s 7.2% increase. China’s trade surplus expanded to USD 91.02 billion, though analysts warned that export demand could face headwinds due to a slowing U.S. economy and rising trade tensions.
Sources: All index and returns data from Norgate Data and Commodity Systems Incorporated and Wall Street Journal. >> News from Reuters, Barron’s, Wall St. Journal, Bloomberg.com, ft.com, guggenheimpartners.com, zerohedge.com, ritholtz.com, markit.com, financialpost.com, Eurostat, Statistics Canada, Yahoo! Finance, stocksandnews.com, marketwatch.com, visualcapitalist.com, wantchinatimes.com, BBC, 361capital.com, pensionpartners.com, cnbc.com, FactSet, Morningstar/Ibbotson Associates, Corporate Finance Institute. >> Commentary from T Rowe Price Global markets weekly update — https://www.troweprice.com/personal-investing/resources/insights/global-markets-weekly-update.
Disclosures: This material is provided for informational purposes only and is not intended to be investment advice or a recommendation to take any action. Past performance cannot guarantee future results.
