


The very big picture (a historical perspective): The CAPE is now at 36.43–up 5.66% this month.
The long-term valuation of the market is commonly measured by the Cyclically Adjusted Price to Earnings ratio, or “CAPE”, which smooths-out shorter-term earnings swings in order to get a longer-term assessment of market valuation. In the past, the CAPE ratio has proved its importance in identifying potential bubbles and market crashes. An extremely high CAPE ratio means that a company’s stock price is substantially higher than the company’s earnings would indicate and, therefore, overvalued. It is generally expected that the market will eventually correct the company’s stock price by pushing it down to its true value. The historical average of the ratio for the S&P 500 Index is between 15-16, while the highest levels of the ratio have exceeded 30.
The record-high levels occurred three times in the history of the U.S. financial markets. The first was in 1929 before the Wall Street crash that signaled the start of the Great Depression. The second was in the late 1990s before the Dotcom Crash, and the third came in 2007 before the 2007-2008 Financial Crisis. https://www.multpl.com/shiller-pe
HISTORY OF THE CAPE VALUE FROM 1871 TO PRESENT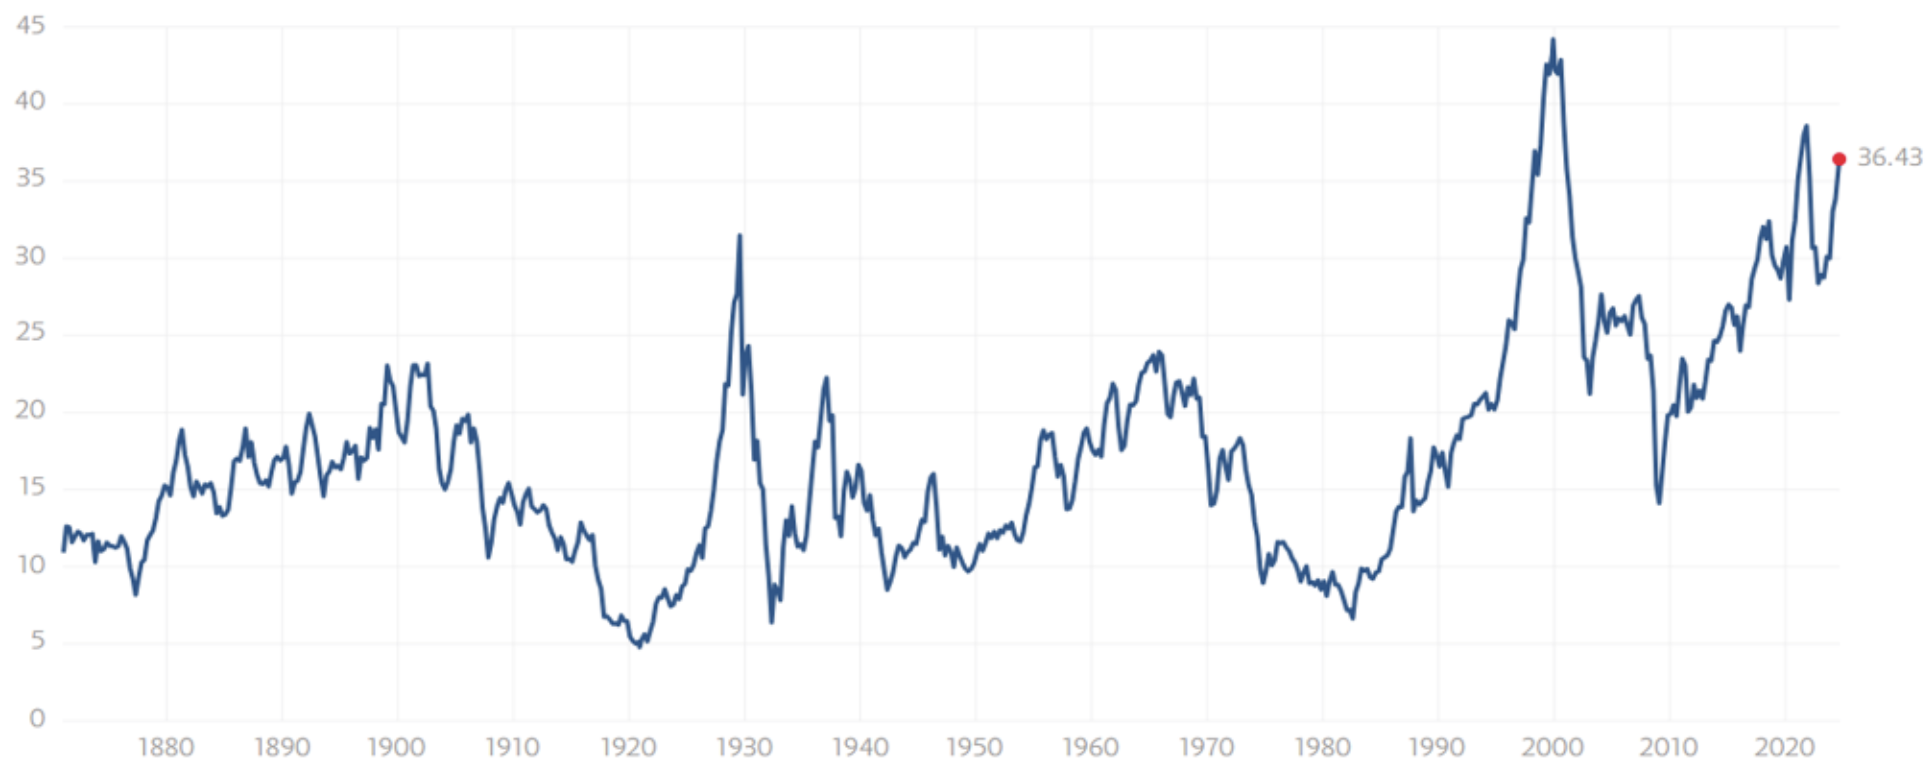
Note: We do not use CAPE as an official input into our methods. However, we think history serves as a guide and that it’s good to know where we are on the historic continuum. https://www.multpl.com/shiller-pe
The big picture: The ‘big picture’ is the (typically) years-long timeframe, the same timeframe in which Cyclical Bulls and Bears operate. The Sherman Portfolios DELTA-V Indicator measuring the Bull/Bear cycle finished the week in BULL status at 73.14, up 2.02% from the prior week’s 71.69. It has signaled Bull since April 21, 2023. The Sherman Portfolios DELTA-V Bond Indicator measuring the Bull/Bear cycle finished the week in BULL status at 69.18, up 0.22% from the prior week’s 69.03 It has signaled Bull since December 15, 2023.
The shorter term picture: GALACTIC SHIELD — POSITIVE entering July 2024 (Q3) indicating positive prospects for equities in the second quarter of 2024. This indicator is based on the combination of U.S. and International Equities trend statuses at the start of each quarter. STARFLUX — POSITIVE since August 23, 2024 and ended the week at 9.12 (down -0.76% last week) This short-term indicator measures U.S. Equities. STARPATH — POSITIVE since November 10, 2023. This indicator measures the interplay on dual timeframes of our Type 1s + the Russell 3000 + our four most ‘pro-cyclical’ Type 3s, vs. Cash.
The complete picture (four indicators across three timeframes): When all four of the Sherman Portfolios indicators are in a POSITIVE status, we read the market as being in a CYCLICAL BULL MARKET.
1. DELTA-V — Positive
2. GALACTIC SHIELD — Positive
3. STARFLUX— Positive
4. STARPATH — Positive
THIS WEEK IN THE MARKETS
U.S. Markets: Markets mixed before Labor Day. In light pre-holiday trading, major stock indexes ended mixed, with the Nasdaq Composite performing the worst due to a significant drop in NVIDIA’s shares, which lost nearly 10% of their value, translating to roughly USD 300 billion. The trading week, which saw the fewest shares exchanged on Monday compared to any other day this year, highlighted the outperformance of value stocks over growth shares by the largest margin since late July. The economic calendar played a key role in shaping market sentiment, particularly with the Labor Department’s core PCE price index showing a moderate 0.2% rise in July, keeping inflation near the Federal Reserve’s target and boosting investor confidence. Additionally, signs of consumer resilience emerged, with personal incomes rising by 0.3% and personal spending by 0.5% in July, alongside an upward revision of second-quarter GDP growth to 3.0%, driven by stronger consumer spending. Markets were set to close the following Monday for Labor Day.
Looking at the US Indexes:
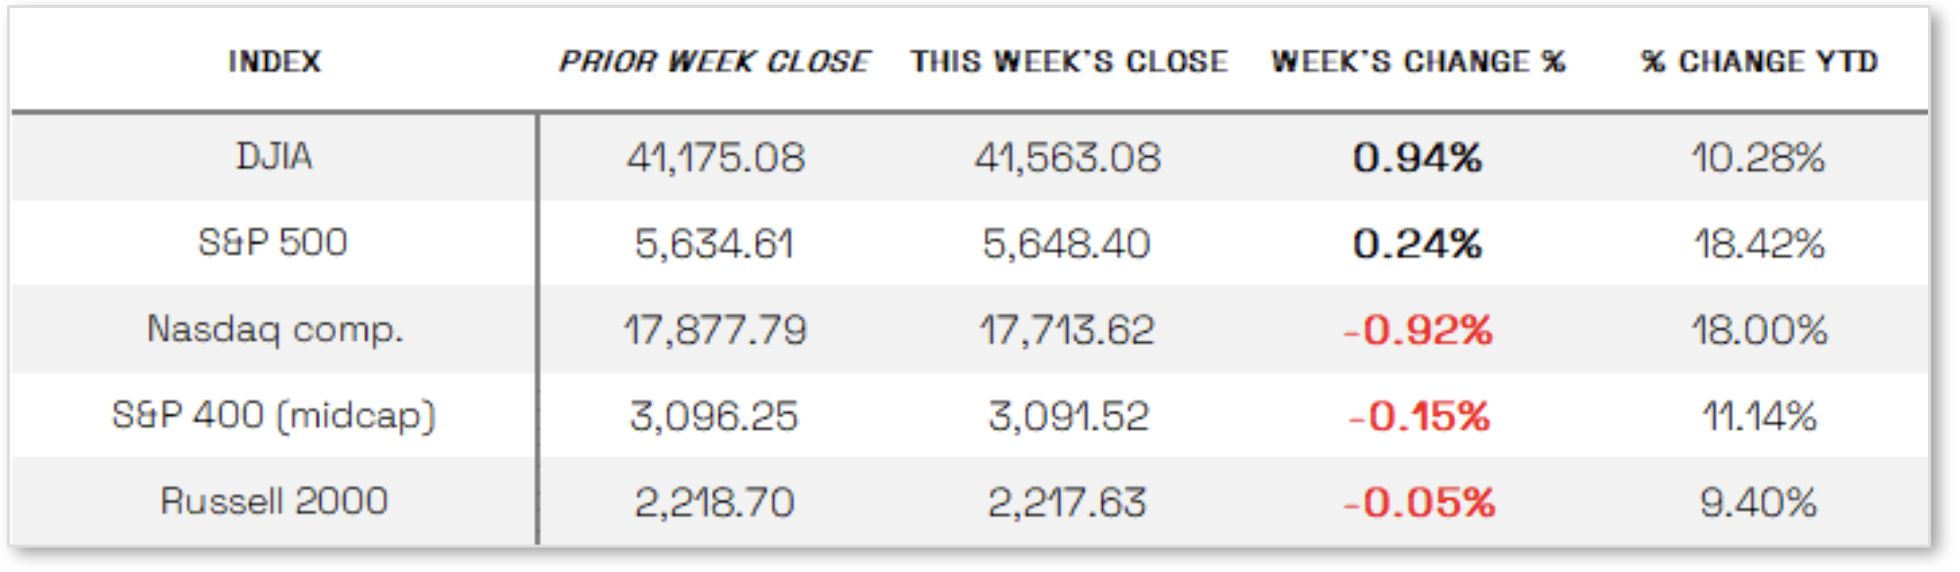
The Dow Jones Industrial Average (DJIA) is the oldest continuing U.S. market index with over 100 years of history and is made up of 30 highly reputable “blue-chip” U.S. stocks (e.g. Coca-Cola Co., Microsoft).The Dow showed a gain this week, ending the week up 0.94% to end at 41,563.08 versus the prior week of 41,175.08
The Nasdaq Composite Index tracks most of the stocks listed on the Nasdaq Stock Market – the second-largest stock exchange in the world. Over half of all stocks on the NASDAQ are tech stocks. The tech-driven Nasdaq showed losses this week. NASDAQ was down -0.92% by closing this week at 17,713.62 versus the prior week of 17,877.79.
The S&P 500 large-cap index is a market-capitalization-weighted index of 500 leading publicly traded companies in the U.S. The S&P 500 is regarded as one of the best gauges of prominent American equities’ performance, and by extension, that of the stock market overall. The S&P 500 was in the black this week. It was up 0.24%, closing at 5648.40 compared to last week’s 5634.61.
The S&P 400 mid-cap index is the benchmark index made up of 400 stocks that broadly represent companies with midrange market capitalization between $3.6 billion and $13.1 billion. It is used by investors as a gauge for market performance and directional trends in U.S. stocks. The S&P 400 mid-cap was in the red this week, down -0.15% by closing this week at 3091.52 versus the prior week of 3096.25.
The Russell 2000 (RUT) small-cap index measures the performance of the 2,000 smaller companies included in the Russell 3000 Index. The Russell 2000 is managed by London’s FTSE Russell Group and is widely regarded as a leading indicator of the U.S. economy because of its focus on smaller companies that focus on the U.S. market. The Russel 2000 was down -0.05% for the week, closing at 2217.63 compared to last week’s 2218.70.
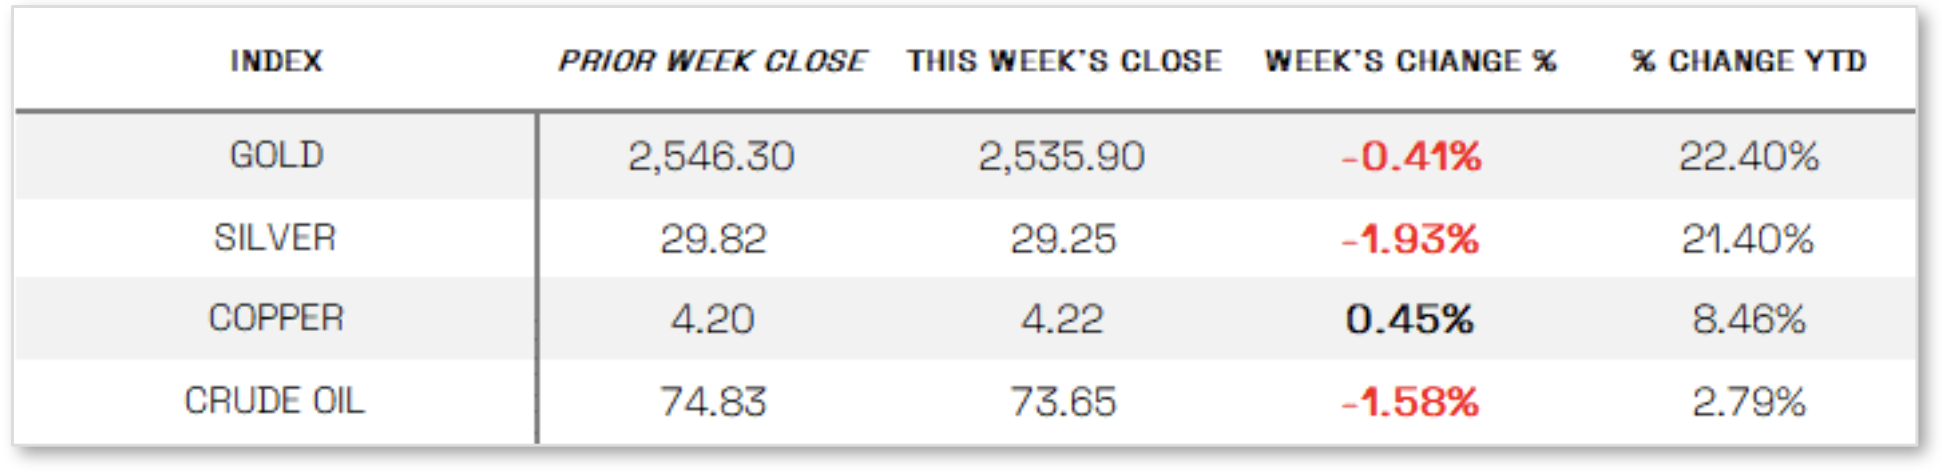
U.S. Commodities/Futures:
THE VOLATILITY INDEX for 2024 (VIX) closed at 15.00 this week, a 5.42% decrease vs last week’s close of 15.86
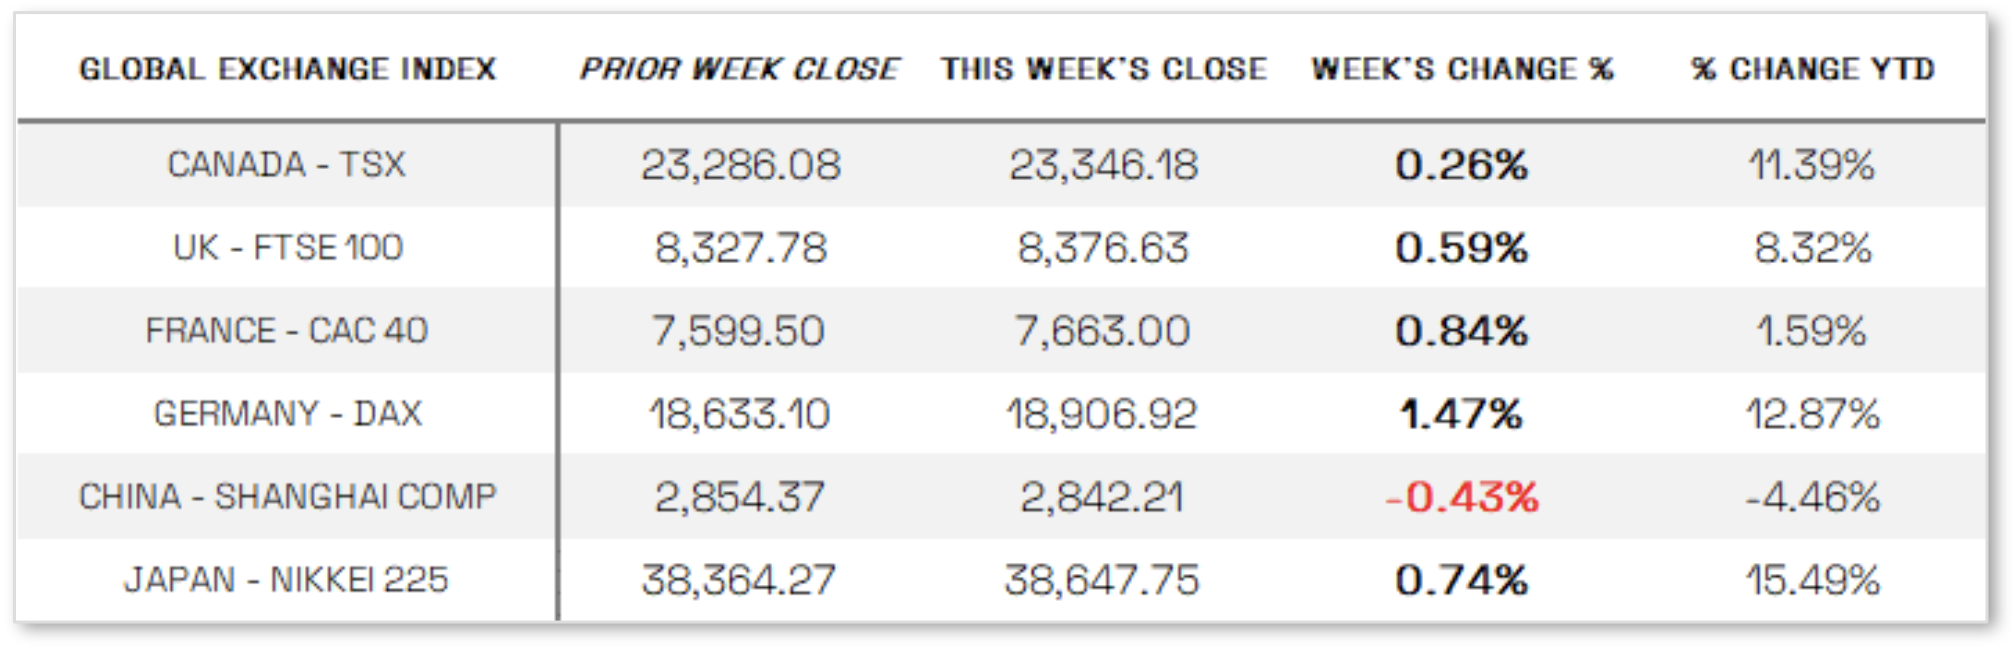
International Markets:
THIS WEEK’S ECONOMIC NEWS
U.S. Economic News: Housing concerns limit home sales. Affordability concerns continue to weigh heavily on potential homebuyers, with the housing sector showing signs of weakness. The National Association of Realtors reported a 5.5% drop in pending home sales for July, marking the lowest level since 2001. This decline was attributed to affordability challenges, election-related uncertainty, and some buyers holding off in hopes of lower mortgage rates as the Federal Reserve potentially eases policy. Meanwhile, the yield on the 10-year U.S. Treasury note rose slightly as expectations for a significant interest rate cut by the Fed diminished. The tax-exempt municipal bond market remained active with strong demand for new deals, while the investment-grade corporate bond market and high-yield market were notably quiet leading up to the holiday weekend, with minimal new issues and light trading activity.
International Economic News: EUROPE: In local currency terms, the pan-European STOXX Europe 600 Index gained 1.34%, reaching a record high as it extended its rally for a fourth consecutive week. The surge was driven by slowing inflation, which bolstered expectations for the European Central Bank (ECB) to cut interest rates in September. Among major European stock indexes, Germany’s DAX hit a new peak, rising 1.47%, Italy’s FTSE MIB climbed 2.15%, and France’s CAC 40 Index increased by 0.84%, while the UK’s FTSE 100 Index ended 0.59% higher. Despite the drop in eurozone headline inflation to 2.2% in August, close to the ECB’s 2% target, some ECB policymakers remained cautious about lowering interest rates too soon, citing persistent underlying inflation pressures. Economic sentiment in the eurozone improved slightly in August, reaching its highest level in over a year, although German companies grew increasingly pessimistic, as reflected in the Ifo Institute’s business climate index, which fell to its lowest level since February.
JAPAN: Japan’s stock markets rose over the week, with the Nikkei 225 Index gaining 0.74% and the broader TOPIX Index up 1.0%, recovering most of the losses from the early August sell-off triggered by the Bank of Japan’s late-July interest rate hike and concerns over U.S. growth. In fixed income markets, the yield on the 10-year Japanese government bond remained stable at around 0.9%, while the yen weakened slightly against the U.S. dollar, ending the week in the high JPY 144 range. Despite this, the yen strengthened for the second consecutive month in August due to divergent monetary policy outlooks between Japan and the U.S., affecting Japan’s export-driven firms. Tokyo’s inflation rose more than expected, with the core CPI increasing 2.4% year-on-year in August, reinforcing a hawkish stance from the BoJ, as Governor Kazuo Ueda indicated a readiness to further normalize monetary policy if inflation trends stabilize around the 2% target. Deputy Governor Ryozo Himino echoed these sentiments, emphasizing the need for vigilance given ongoing global financial market instability.
CHINA: Chinese stocks declined as disappointing corporate earnings reports dampened buying sentiment, with the Shanghai Composite Index losing 0.43% and the blue-chip CSI 300 falling 0.17%. In contrast, Hong Kong’s Hang Seng Index rose 2.14%. Several economists reduced their 2024 growth forecasts for China amid a prolonged property sector slump and weak domestic demand. Retail sales are now expected to grow by 4% this year, down from July’s 4.5% estimate, while fixed asset investment growth is forecasted at 4.2%, slightly below the previous 4.4% projection. The consumer price index forecast was also trimmed to 0.5% from 0.6%. This weaker outlook raised concerns that China might miss its official growth target of around 5% for the year and increased expectations of further monetary easing by the central bank, including potential interest rate cuts and a reduction in the reserve requirement ratio. Meanwhile, the People’s Bank of China injected RMB 300 billion into the banking system through its medium-term lending facility, keeping the lending rate unchanged at 2.3%, and supplemented the system with RMB 471 billion via short-term reverse repos at a stable rate of 1.7%.
Sources: All index and returns data from Norgate Data and Commodity Systems Incorporated and Wall Street Journal. >> News from Reuters, Barron’s, Wall St. Journal, Bloomberg.com, ft.com, guggenheimpartners.com, zerohedge.com, ritholtz.com, markit.com, financialpost.com, Eurostat, Statistics Canada, Yahoo! Finance, stocksandnews.com, marketwatch.com, visualcapitalist.com, wantchinatimes.com, BBC, 361capital.com, pensionpartners.com, cnbc.com, FactSet, Morningstar/Ibbotson Associates, Corporate Finance Institute. >> Commentary from T Rowe Price Global markets weekly update — https://www.troweprice.com/personal-investing/resources/insights/global-markets-weekly-update
Disclosures: This material is provided for informational purposes only and is not intended to be investment advice or a recommendation to take any action. Past performance cannot guarantee future results.
