


The very big picture (a historical perspective): The CAPE is now at 35.56 – up 3.37% this month.
The long-term valuation of the market is commonly measured by the Cyclically Adjusted Price to Earnings ratio, or “CAPE”, which smooths-out shorter-term earnings swings in order to get a longer-term assessment of market valuation. In the past, the CAPE ratio has proved its importance in identifying potential bubbles and market crashes. An extremely high CAPE ratio means that a company’s stock price is substantially higher than the company’s earnings would indicate and, therefore, overvalued. It is generally expected that the market will eventually correct the company’s stock price by pushing it down to its true value. The historical average of the ratio for the S&P 500 Index is between 15-16, while the highest levels of the ratio have exceeded 30. The record-high levels occurred three times in the history of the U.S. financial markets. The first was in 1929 before the Wall Street crash that signaled the start of the Great Depression. The second was in the late 1990s before the Dotcom Crash, and the third came in 2007 before the 2007-2008 Financial Crisis. https://www.multpl.com/shiller-pe
HISTORY OF THE CAPE VALUE FROM 1871 TO PRESENT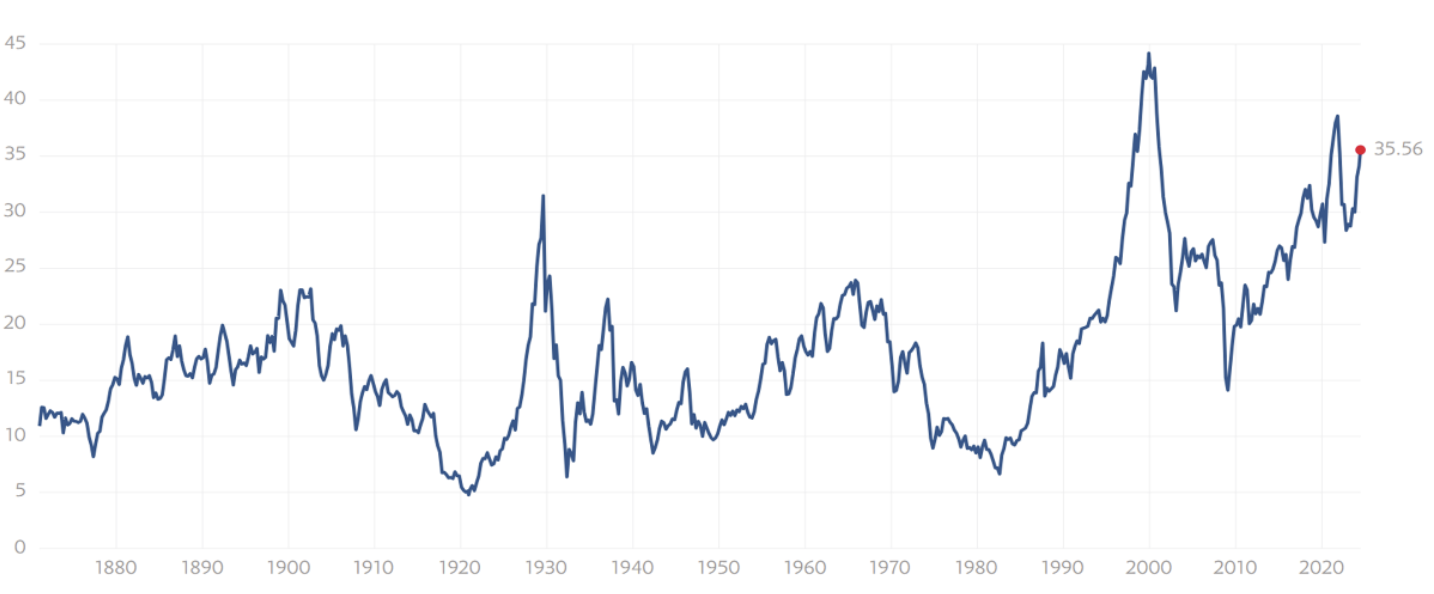
Note: We do not use CAPE as an official input into our methods. However, we think history serves as a guide and that it’s good to know where we are on the historic continuum. https://www.multpl.com/shiller-pe
The big picture: The ‘big picture’ is the (typically) years-long timeframe, the same timeframe in which Cyclical Bulls and Bears operate. The Sherman Portfolios DELTA-V Indicator measuring the Bull/Bear cycle finished the week in BULL status at 78.63, up 2.16% from the prior week’s 76.97. It has signaled Bull since April 21, 2023. The Sherman Portfolios DELTA-V Bond Indicator measuring the Bull/Bear cycle finished the week in BULL status at 62.33, up 0.05% from the prior week’s 62.30. It has signaled Bull since December 15, 2023.
The shorter term picture: GALACTIC SHIELD — POSITIVE entering July 2024 (Q3) indicating positive prospects for equities in the third quarter of 2024. This indicator is based on the combination of U.S. and International Equities trend statuses at the start of each quarter. STARFLUX— POSITIVE since Nov 16, 2023 and ended the week at 6.97 (Up 1.75% last week). This short-term indicator measures U.S. Equities. STARPATH — POSITIVE since November 21, 2023. This indicator measures the interplay on dual timeframes of our Type 1s + the Russell 3000 + our four most ‘pro-cyclical’ Type 3s, vs. Cash.
The complete picture (four indicators across three timeframes): When all four of the Sherman Portfolios indicators are in a POSITIVE status, we read the market as being in a CYCLICAL BULL MARKET.
1. DELTA-V — Positive
2. GALACTIC SHIELD — Positive
3. STARFLUX— Positive
4. STARPATH — Positive
THIS WEEK IN THE MARKETS
U.S. Markets: Quiet week with mixed performance. Most major U.S. stock indexes posted gains in a week characterized by light news and subdued market activity ahead of second-quarter earnings reports. Small-cap companies and information technology stocks outperformed, with growth stocks leading over value stocks. The anticipation of FTSE Russell’s rebalancing of its Russell indexes after the close on Friday likely influenced some of the week’s positioning adjustments by investors tracking those indexes.
Looking at the US Indexes:
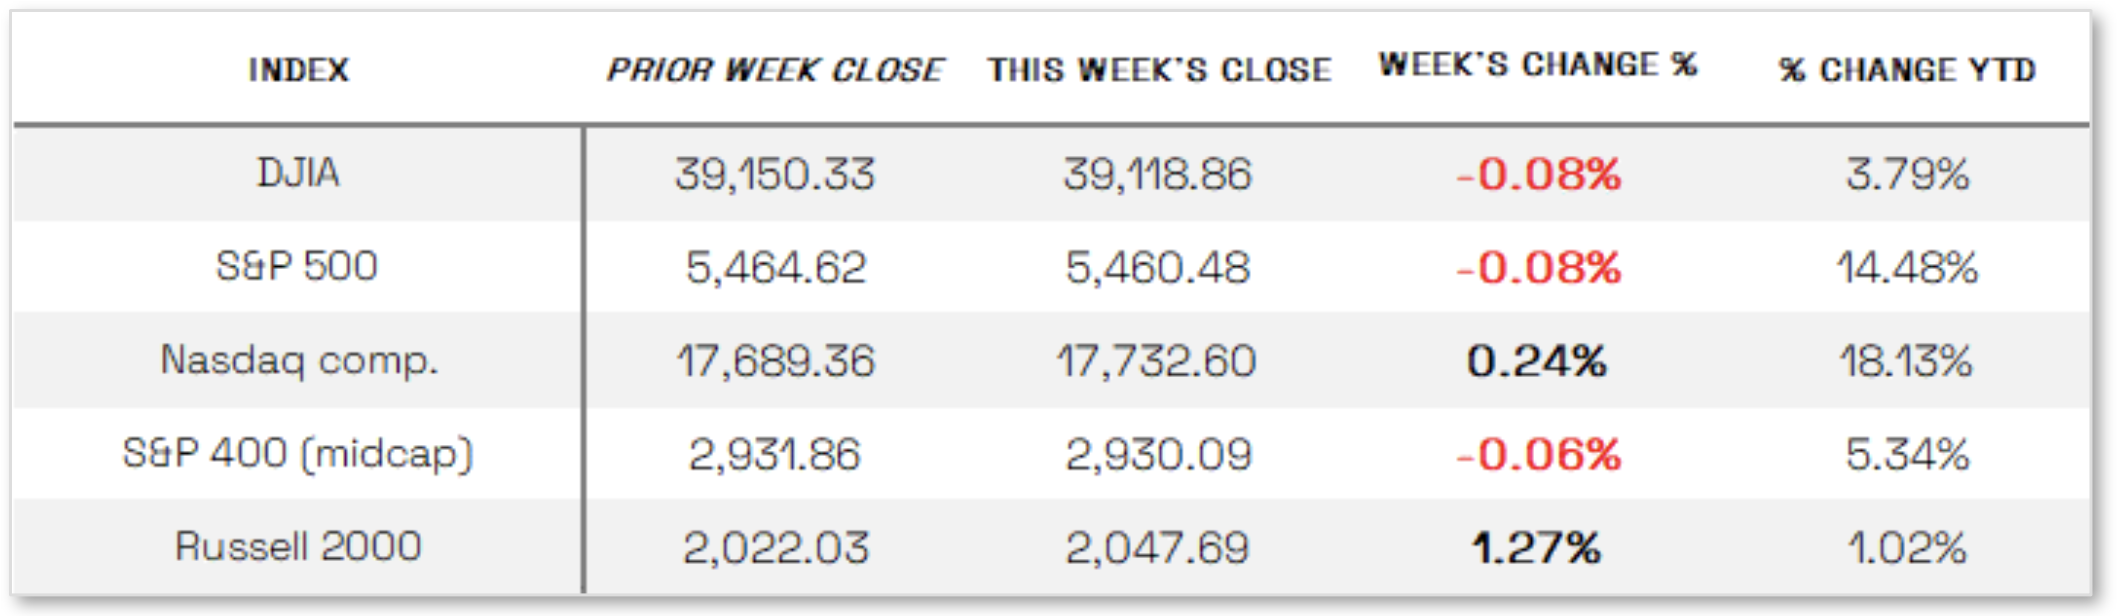
The Dow Jones Industrial Average (DJIA) is the oldest continuing U.S. market index with over 100 years of history and is made up of 30 highly reputable “blue-chip” U.S. stocks (e.g. Coca-Cola Co., Microsoft). The Dow showed a slight loss this week, ending the week of June 28th down 0.08% to end at 39,118.86 vs the prior week of 39,150.33
The Nasdaq Composite Index tracks most of the stocks listed on the Nasdaq Stock Market – the second-largest stock exchange in the world. Over half of all stocks on the NASDAQ are tech stocks. The tech-driven Nasdaq showed no change of note this week. NASDAQ was up 0.24% by closing this week, ending at 17,732.60 vs. the prior week of 17,689.36.
The S&P 500 large-cap index is a market-capitalization-weighted index of 500 leading publicly traded companies in the U.S. The S&P 500 is regarded as one of the best gauges of prominent American equities’ performance, and by extension, that of the stock market overall. The S&P 500 was in the red this week. It was down 0.08%, closing at 5460.48 compared to last week’s 5464.62.
The S&P 400 mid-cap index is the benchmark index made up of 400 stocks that broadly represent companies with midrange market capitalization between $3.6 billion and $13.1 billion. It is used by investors as a gauge for market performance and directional trends in U.S. stocks. The S&P 400 mid-cap joined the S&P in the red this week, down 0.06%. It went from last week’s close of 2931.86 to 2930.09.
The Russell 2000 (RUT) small-cap index measures the performance of the 2,000 smaller companies included in the Russell 3000 Index. The Russell 2000 is managed by London’s FTSE Russell Group and is widely regarded as a leading indicator of the U.S. economy because of its focus on smaller companies that focus on the U.S. market. The Russel 2000 was the only one of these three funds in the black this week. It was up 1.27% for the week, closing at 2047.69 compared to last week’s 2022.03.
U.S. Commodities/Futures: Commodities continued the downtrend, showing poor performance across the board.
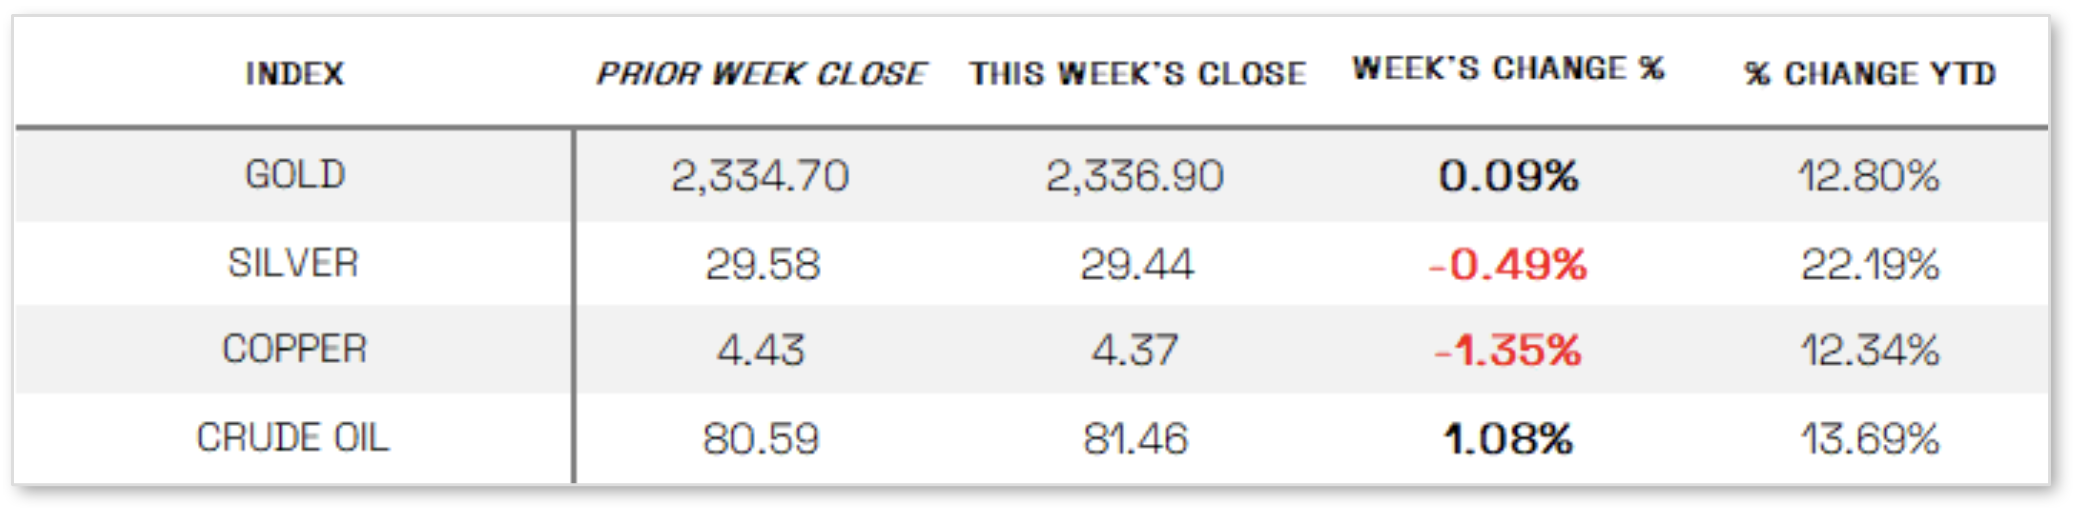
The Volatility Index (VIX) closed at 12.44 this week, a 5.76% Decrease under last week’s close of 13.20.
International Markets:
THIS WEEK’S ECONOMIC NEWS
U.S. Economic News: Banking stress test completed. The banking sector garnered significant attention, driving strong performance in the KBW Bank Index. Early in the week, reports surfaced that the Federal Reserve is considering substantially lighter additional capital requirements for banks than originally proposed following the regional banking crisis in March 2023. This was followed by the Fed’s announcement that all 31 large U.S. banks passed the latest stress tests, maintaining capital levels above the minimum requirements. This development could enable banks to return capital to shareholders through dividends and buybacks.
Mixed inflation signals. On Friday, the Bureau of Economic Analysis released May data for the core personal consumption expenditures (PCE) price index, which showed a 0.1% increase from April, excluding food and energy prices. The core PCE, the Fed’s preferred inflation measure, showed a deceleration from April’s revised 0.3% rise, bolstering market expectations for a potential September rate cut. Yields on longer-term Treasuries rose throughout the week, while short-term yields declined, resulting in a steeper yield curve. Investment-grade corporate bond issuance met weekly expectations, with most new issues being oversubscribed, while regional bank bonds outperformed on news of potential lighter regulatory capital requirements. Positive flows and moderate issuance supported favorable conditions in the high yield bond market, despite a mixed macroeconomic backdrop.
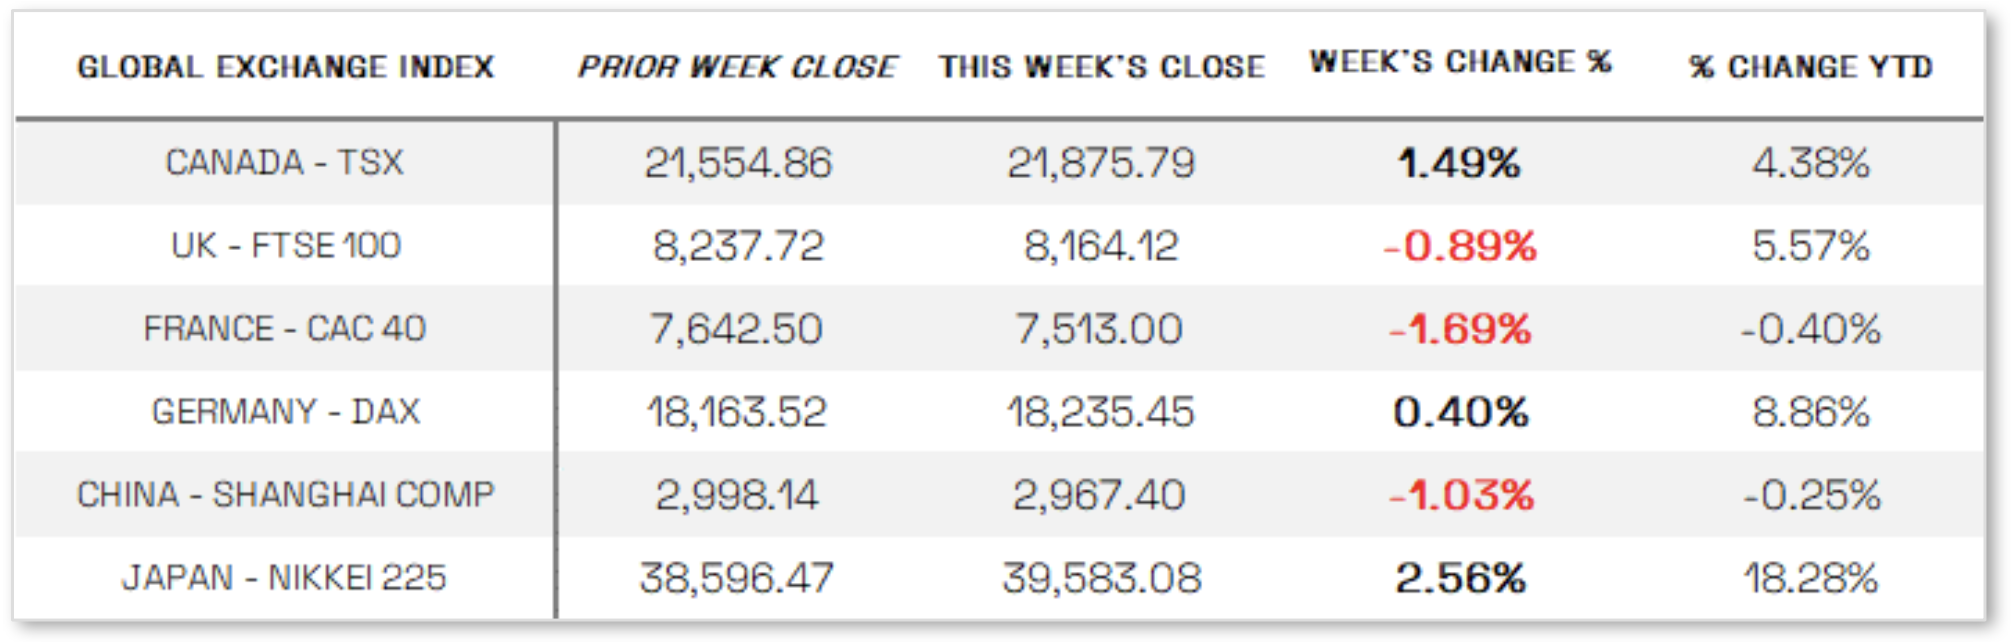
International Economic News: In local currency terms, the pan-European STOXX Europe 600 Index ended 0.72% lower amid heightened political uncertainty in France ahead of the upcoming snap election called by President Emmanuel Macron. Major stock indexes were mixed: Germany’s DAX rose 0.40%, Italy’s FTSE MIB fell 0.46%, France’s CAC 40 Index lost 1.96%, and the UK’s FTSE 100 Index eased 0.89%. Eurozone government bond yields increased in anticipation of inflation data from both the eurozone and the U.S., with European Central Bank officials signaling a more cautious approach to cutting interest rates this year, adding upward pressure on yields. The yield spread between French and German debt widened ahead of France’s election on June 30, while UK yields also climbed in advance of the UK elections on July 4, influenced by upward revisions to the UK’s first-quarter GDP. Preliminary data showed that slower increases in fuel and food prices lowered the harmonized rate of inflation in France and Spain in June, with France’s annual rate falling to 2.5% from 2.6% and Spain’s dropping from 3.8% to 3.5%. In Germany, a rise in unemployment and a decline in business confidence highlighted economic stagnation, as the jobless rate increased to 6.0% in June from 5.9% in May and the Ifo think tank’s business confidence indicator weakened to 88.6 from 89.3. Despite hosting the European Championship for soccer, German consumers became more cautious, showing a greater willingness to save and less willingness to spend, reflected in the GfK Consumer Climate Indicator dropping to -21.8 for July from a revised -21.0 in June.
JAPAN: Japan’s stock markets rose over the week, with the Nikkei 225 Index gaining 2.6% and the broader TOPIX Index up 3.1%, as historic weakness in the yen continued to support the country’s export-heavy industries. The Japanese currency hovered around its lowest levels in 38 years, falling to around JPY 160.6 against the USD from JPY 159.7 at the end of the previous week. Despite heightened expectations that authorities would again step in to stem the yen’s sharp decline, driven by the wide U.S.-Japan interest rate differential, only verbal intervention occurred, with Finance Minister Shunichi Suzuki reasserting that excessive volatility in the currency market is undesirable and that authorities would respond appropriately. Separately, it was announced that Atsushi Mimura would become Japan’s top foreign exchange diplomat on July 31 as part of an annual reshuffle. The yield on the 10-year Japanese government bond rose to 1.06% from 0.97% the prior week, on growing anticipation of further monetary policy tightening by the Bank of Japan (BoJ), which is expected to detail plans to taper its massive bond buying at its July meeting to restore market functioning, amid speculation about a possible interest rate hike.
CHINA: Chinese stocks weakened as a light economic calendar and concerns about the slowing economy curbed risk appetite. The Shanghai Composite Index and the blue-chip CSI 300 Index both recorded slight declines for the week, while Hong Kong’s benchmark Hang Seng Index slid 1.5%. Industrial profits at large companies edged up 0.7% in May from a year earlier, down from April’s 4% gain, with the improvement attributed to higher commodity prices boosting profits for mining companies. However, the month-on-month decline reflected sluggish consumption amid China’s prolonged property downturn and persistent deflationary pressure. Looking ahead, investors will focus on China’s official purchasing managers’ index, to be released on Sunday, followed by the private sector Caixin factory survey on July 1. Foreign selling also contributed to the declines, with global funds selling about RMB 49.4 billion of onshore shares via trading links with Hong Kong in June, setting the market on track for its first monthly outflow since January. The selling pressure from overseas investors is attributed to many Chinese companies disappointing investors with lower-than-expected quarterly earnings, highlighting the economy’s weak growth outlook.
Sources: All index and returns data from Norgate Data and Commodity Systems Incorporated and Wall Street Journal >> News from Reuters, Barron’s, Wall St. Journal, Bloomberg.com, ft.com, guggenheimpartners.com, zerohedge.com, ritholtz.com, markit.com, financialpost.com, Eurostat, Statistics Canada, Yahoo! Finance, stocksandnews.com, marketwatch.com, visualcapitalist.com, wantchinatimes.com, BBC, 361capital.com, pensionpartners.com, cnbc.com, FactSet, Morningstar/Ibbotson Associates, Corporate Finance Institute. >> Commentary from T Rowe Price Global markets weekly update — https://www.troweprice.com/personal-investing/resources/insights/global-markets-weekly-update
Disclosures: This material is provided for informational purposes only and is not intended to be investment advice or a recommendation to take any action. Past performance cannot guarantee future results.
