


THE COMPLETE PICTURE
>> Four indicators across three time frames.
>> When all the Sherman Portfolios indicators are positive status, we read the market as being in a Bull Market.
1. DELTA-V — Positive since June 27, 2025
2. GALACTIC SHIELD — Positive since April 1, 2023
3. STARFLUX — Positive since May 12, 2025
4. STARPATH — Positive since August 15, 2025
The shorter term picture:
>> GALACTIC SHIELD — POSITIVE for Q1 2026, This indicator is based on the combination of U.S. and International Equities trend statuses at the start of each quarter.
>> STARFLUX — POSITIVE, Starflux ended the week 8.00 (up 12.99% last week). This short-term indicator measures U.S. Equities. It measures the trend-strength of the Russell 3000 index.
>> STARPATH — POSITIVE, This indicator measures the interplay on dual timeframes of our Type 1s + the Russell 3000 + our four most ‘pro-cyclical’ Type 3s, vs. Cash
The big picture:
The ‘big picture’ is the (typically) years-long timeframe, the same timeframe in which Cyclical Bulls and Bears operate.
>> The Sherman Portfolios DELTA-V Indicator measuring the Bull/Bear cycle finished the week in a Bull status at 67.36, up 1.42% from the prior week’s 66.42. It has signaled Bull since June 27, 2025.
>> The Sherman Portfolios DELTA-V Bond Indicator measuring the Bull/Bear cycle finished the week in BULL status at 60.01, up 0.55% from the prior week’s 59.71. It has signaled Bull since December 15, 2023.
The very big picture (a historical perspective): The CAPE is now at 40.94.
The cyclically adjusted price-to-earnings ratio (CAPE) can be used to smooth out the shorter-term earnings swings to get a longer-term assessment of market valuation. An extremely high CAPE ratio means that a company’s stock price is substantially higher than the company’s earnings would indicate and, therefore, overvalued. It is generally expected that the market will eventually correct the company’s stock price by pushing it down to its true value.
In the past, the CAPE ratio has proved its importance in identifying potential bubbles and market crashes. The historical average of the ratio for the S&P 500 Index is between 15-16, while the highest levels of the ratio have exceeded 30. The record-high levels occurred three times in the history of the U.S. financial markets. The first was in 1929 before the Wall Street crash that signaled the start of the Great Depression. The second was in the late 1990s before the Dotcom Crash, and the third came in 2007 before the 2007-2008 Financial Crisis. https://www.multpl.com/shiller-pe
 Note: We do not use CAPE as an official input into our methods. However, we think history serves as a guide and that it’s good to know where we are on the historic continuum.
THIS WEEK IN THE MARKETS
U.S. Markets:
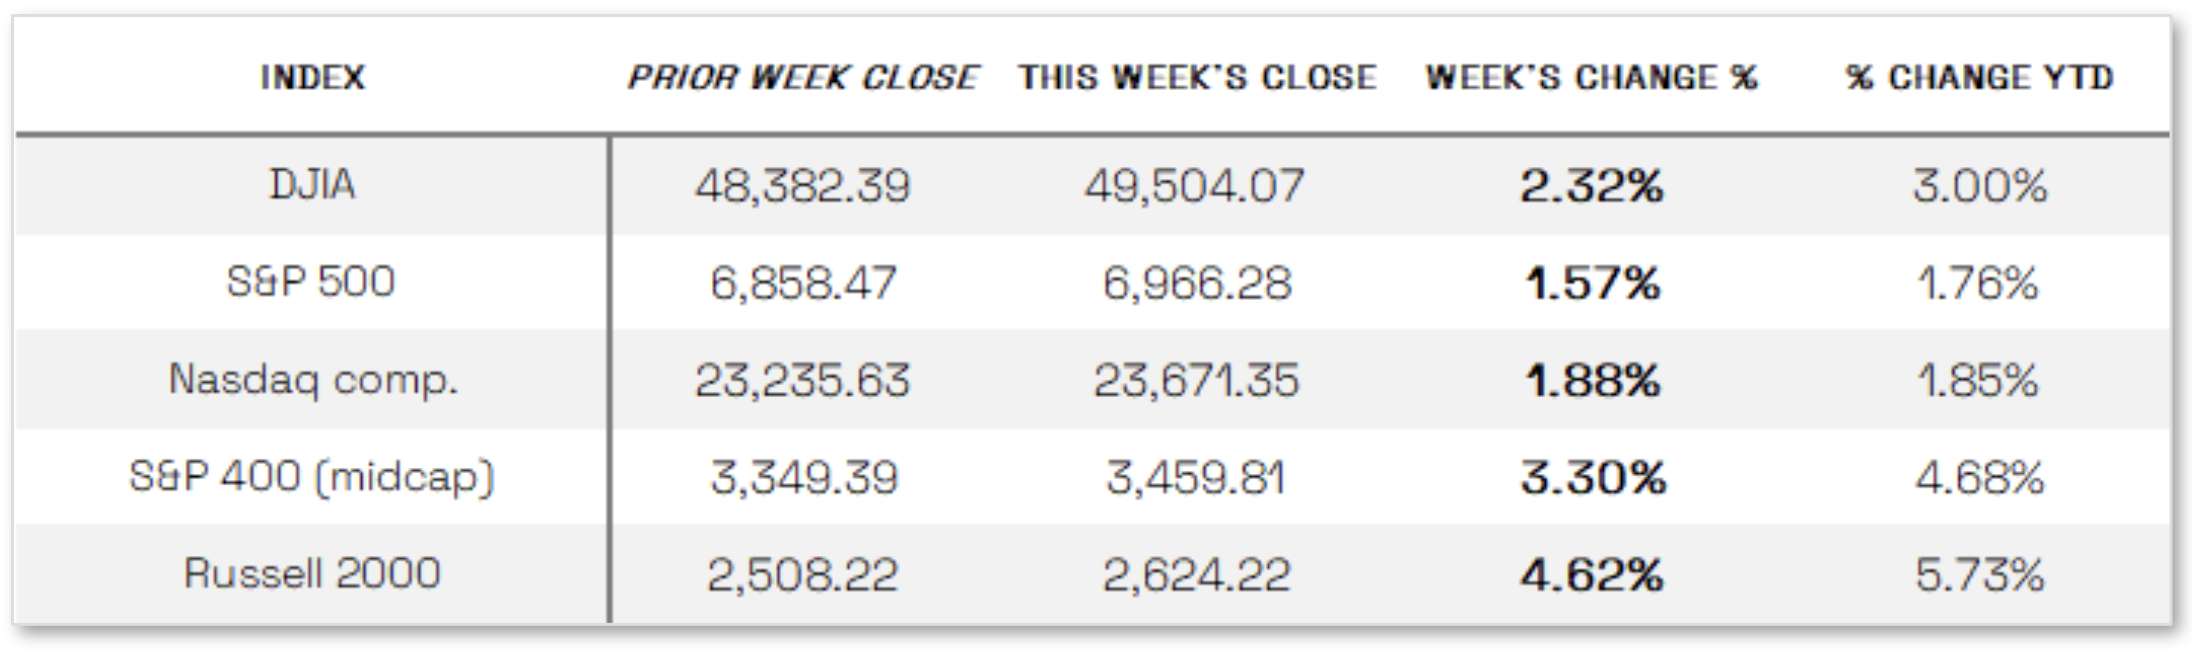
Stocks up this week: Stocks rallied to start the year, with equities advancing in the first full trading week as investors largely looked past rising geopolitical tensions, pushing most major indexes to all-time highs. Small-cap and value stocks outperformed large-cap growth names, and the equal-weighted S&P 500 outpaced its market-cap-weighted counterpart; the Russell 2000 led major indexes with a 4.62% gain, while the S&P 500 lagged but still rose 1.57%. Markets also reacted sharply to a series of policy signals from President Donald Trump, with aerospace and defense stocks initially falling after comments opposing dividends and share buybacks without increased production, only to rebound the next day on proposals for significantly higher military spending. Homebuilders and related sectors followed a similar pattern, dipping on news of potential restrictions on institutional purchases of single-family homes before recovering after Trump directed Fannie Mae and Freddie Mac to purchase $200 billion in mortgage bonds to help lower borrowing costs, a move that also led to a rapid tightening of agency mortgage-backed security credit spreads.
Looking at the US Indexes:
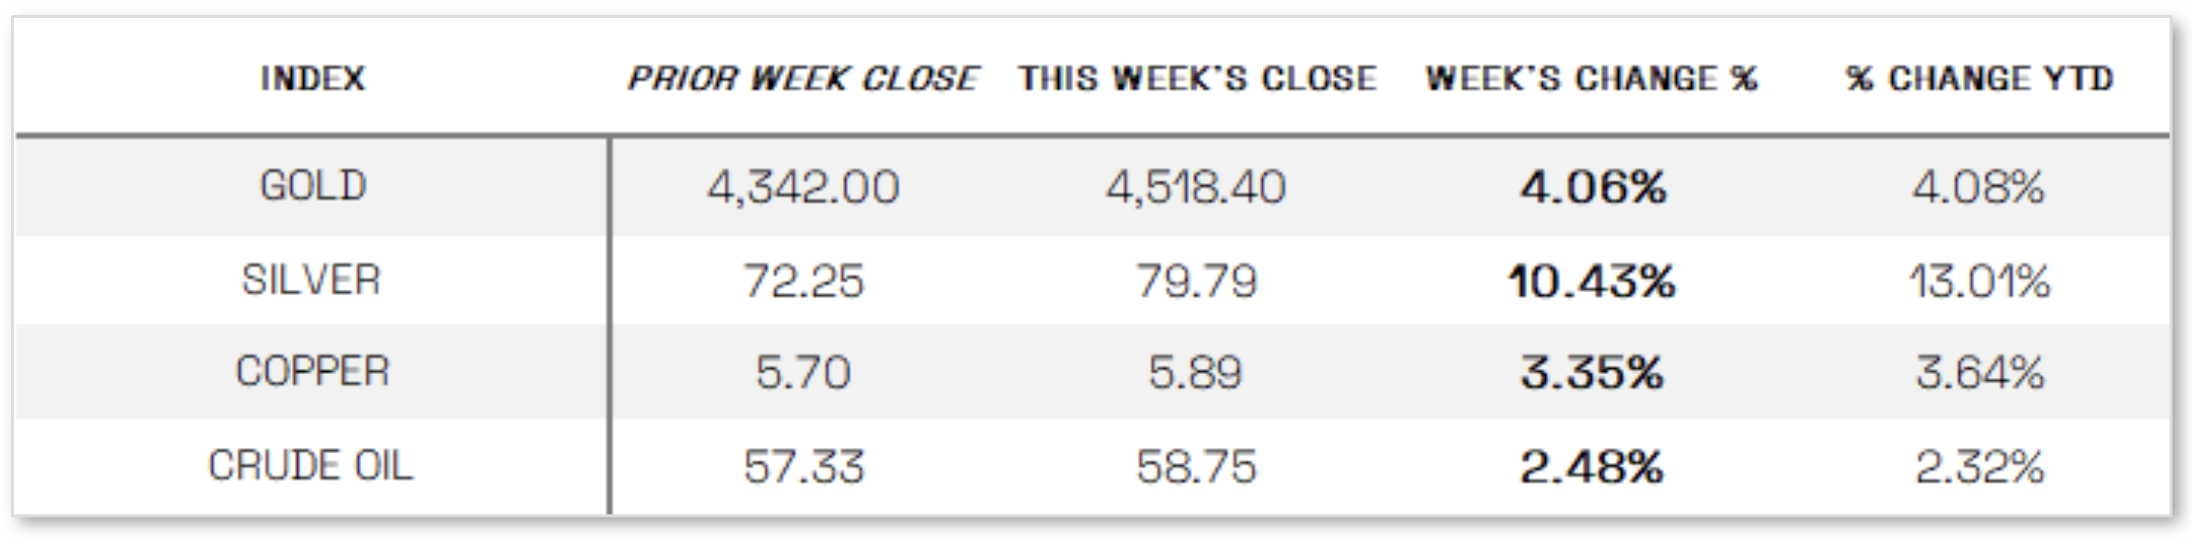
U.S. Commodities/Futures:
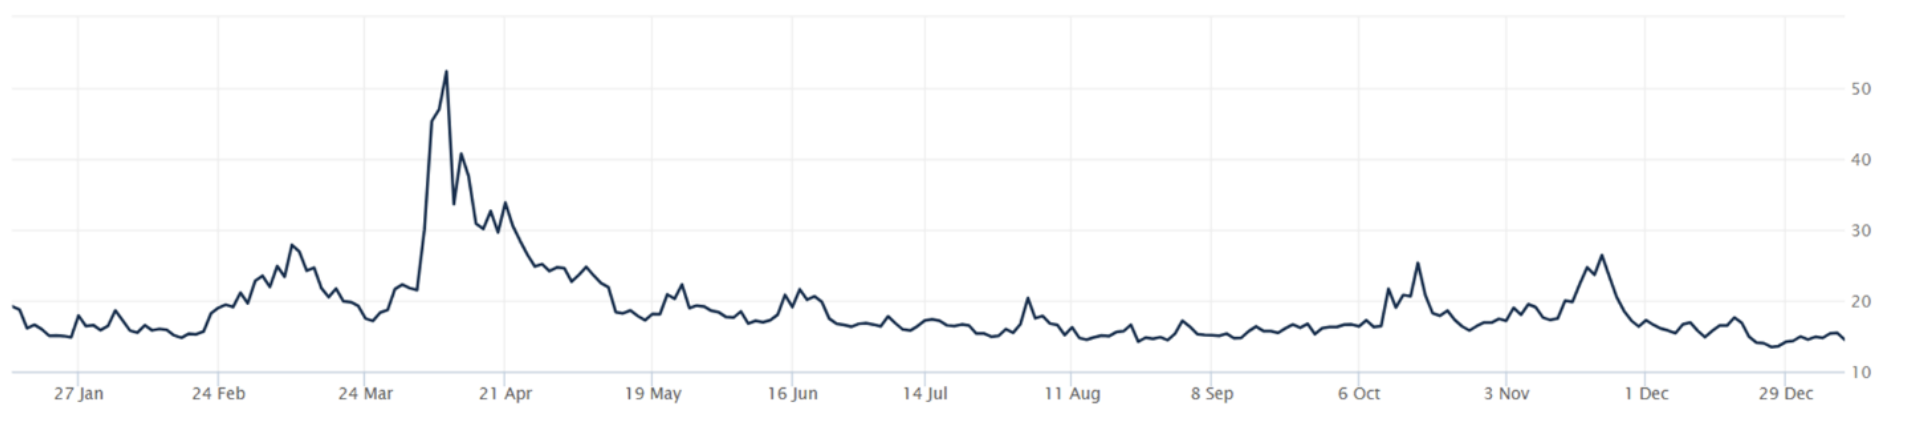
THE VOLATILITY INDEX (VIX) closed at 14.49 this week, a 0.1% decrease vs last week’s close of 14.51.
International Markets:
THIS WEEK’S ECONOMIC NEWS
U.S. Economic News:
Labor market cools
Economic data released during the week pointed to a cooling labor market and a mixed growth backdrop. The Labor Department’s December nonfarm payrolls report showed U.S. employers added a weaker-than-expected 50,000 jobs, while October and November payrolls were revised lower by a combined 76,000, though the unemployment rate edged down to 4.4%. Additional signs of moderation came from the Job Openings and Labor Turnover Summary, which showed hires falling to 5.1 million and job openings declining to 7.1 million, the lowest level since September 2024, as well as from ADP, which reported private-sector job growth of 41,000 in December, below expectations. Meanwhile, manufacturing activity remained under pressure, with the ISM Manufacturing PMI contracting for a 10th straight month and falling to 47.9, as employment stayed in contraction and input prices continued to rise. In contrast, the services sector remained resilient, with the ISM Services PMI expanding for the 10th consecutive month and reaching its highest level of the year, supported by stronger new orders, business activity, and a rebound in employment, even as price pressures eased modestly but remained elevated.
International Economic News:
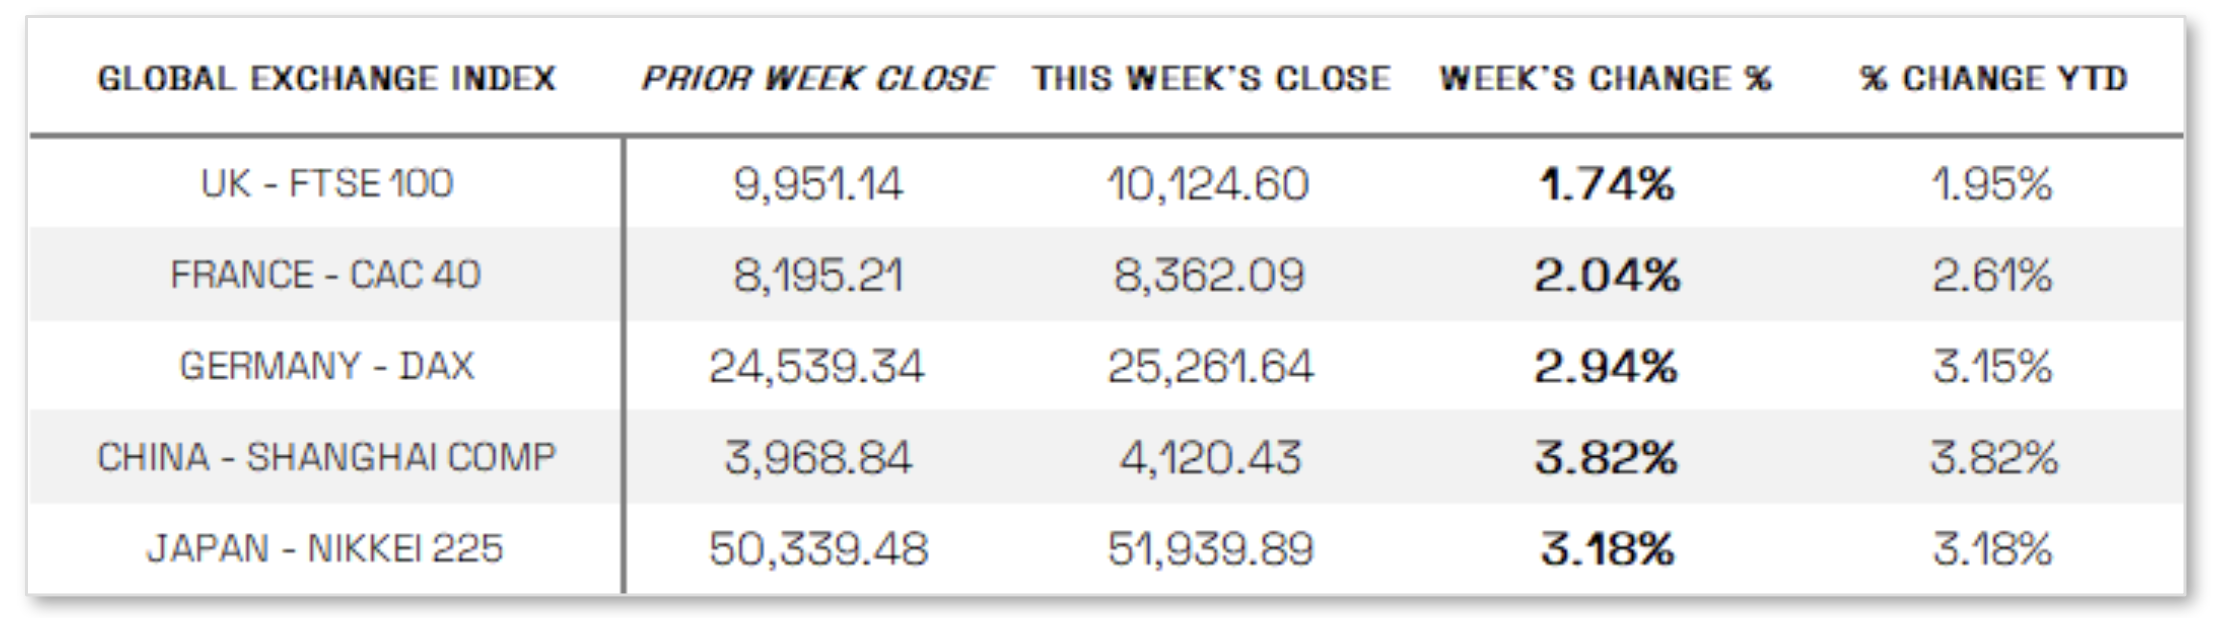
EUROPE: European equities advanced for the week, with the pan-European STOXX Europe 600 Index rising 2.27% in local currency terms, supported by optimism around economic momentum, corporate earnings, and a favorable interest rate environment, while major national indexes also posted solid gains, including Germany’s DAX up 2.94%, France’s CAC 40 higher by 2.04%, Italy’s FTSE MIB up 0.76%, and the UK’s FTSE 100 adding 1.74%. Economic data pointed to a strengthening eurozone economy and signs of a potential German turnaround, as November industrial production exceeded expectations in Germany, France, and Spain, with Germany posting a 0.8% sequential increase alongside a sharp 5.6% jump in manufacturing orders, while retail sales across the bloc rose 0.2% month over month and 2.3% year over year, beating forecasts. At the same time, euro area inflation slowed more than expected in December, with headline inflation easing to the ECB’s 2.0% target and core inflation slipping to 2.3%, although services inflation remained elevated at 3.4%, reinforcing concerns that underlying price pressures may keep the European Central Bank cautious and signal an end to its rate-cutting cycle.
JAPAN: Japanese equities posted strong gains for the week, with the Nikkei 225 rising 3.18% and the broader TOPIX Index up 3.08%, as markets advanced despite ongoing geopolitical and trade tensions with China. Technology shares continued to lead gains, while a weaker yen supported export-oriented companies and trading houses, with the currency depreciating to around JPY 157.6 per U.S. dollar from roughly JPY 156.8 the prior week amid investor concerns over the government’s expansive fiscal spending plans. Meanwhile, the 10-year Japanese government bond yield edged up to 2.09% from 2.07%, reflecting continued expectations for additional Bank of Japan rate hikes in 2026, reinforced by Governor Kazuo Ueda’s comments that the central bank will continue tightening policy in line with economic and inflation improvements and expects the link between moderate wage growth and inflation to persist.
CHINA: Mainland Chinese equities advanced over the week, driven by strong interest in artificial intelligence–related stocks, with the CSI 300 Index gaining 2.79% after pulling back from a four-year high reached earlier in the week and the Shanghai Composite rising 3.82%, while Hong Kong’s Hang Seng Index slipped 0.41%. Optimism around the domestic technology sector boosted trading activity, as onshore market turnover climbed to roughly CNY 2.8 trillion (about USD 400.6 billion) and margin financing remained near record levels. On the economic front, December inflation data showed modest improvement in consumer prices alongside continued deflationary pressure in producer prices, with headline CPI rising 0.8% year over year in line with expectations, core CPI increasing 1.2% for a third consecutive month, and the producer price index falling 1.9%, marking its 39th straight monthly decline but the smallest drop in more than a year.
Sources:
>> All index and returns data from Norgate Data and Commodity Systems Incorporated and Wall Street Journal.
>> News from Reuters, Barron’s, Wall St. Journal, Bloomberg.com, ft.com, guggenheimpartners.com, zerohedge.com, ritholtz.com, markit.com, financialpost.com, Eurostat, Statistics Canada, Yahoo! Finance, stocksandnews.com, marketwatch.com, visualcapitalist.com, wantchinatimes.com, BBC, 361capital.com, pensionpartners.com, cnbc.com, FactSet, Morningstar/Ibbotson Associates, Corporate Finance Institute.
>> Commentary from T Rowe Price Global markets weekly update — https://www.troweprice.com/personal-investing/resources/insights/global-markets-weekly-update.html
Disclosures: This material and any mention of specific investments is provided for informational purposes only and is not intended to be investment advice or a recommendation to take any action. The forecasts or forward-looking statements are based on assumptions, may not materialize, and are subject to revision without notice. The market indexes discussed are unmanaged, and generally, considered representative of their respective markets. Index performance is not indicative of the past performance of a particular investment. Indexes do not incur management fees, costs, and expenses. Individuals cannot directly invest in unmanaged indexes. Past performance does not guarantee future results.
