


THE COMPLETE PICTURE
>> Four indicators across three time frames.
>> When all the Sherman Portfolios indicators are positive status, we read the market as being in a Bull Market.
1. DELTA-V — Positive since June 27, 2025
2. GALACTIC SHIELD — Positive since April 1, 2023
3. STARFLUX — Positive since May 12, 2025
4. STARPATH — Positive since August 15, 2025
The shorter term picture:
>> GALACTIC SHIELD — POSITIVE for Q1 2026, This indicator is based on the combination of U.S. and International Equities trend statuses at the start of each quarter.
>> STARFLUX — POSITIVE, Starflux ended the week 7.08 (down 13.34% last week). This short-term indicator measures U.S. Equities. It measures the trend-strength of the Russell 3000 index.
>> STARPATH — POSITIVE, This indicator measures the interplay on dual timeframes of our Type 1s + the Russell 3000 + our four most ‘pro-cyclical’ Type 3s, vs. Cash.
The big picture:
The ‘big picture’ is the (typically) years-long timeframe, the same timeframe in which Cyclical Bulls and Bears operate.
>> The Sherman Portfolios DELTA-V Indicator measuring the Bull/Bear cycle finished the week in a Bull status at 66.42, down 2.32% from the prior week’s 68.00. It has signaled Bull since June 27, 2025.
>> The Sherman Portfolios DELTA-V Bond Indicator measuring the Bull/Bear cycle finished the week in BULL status at 59.71, down 2.99% from the prior week’s 61.55. It has signaled Bull since December 15, 2023.
The very big picture (a historical perspective): The CAPE is now at 40.30.
The cyclically adjusted price-to-earnings ratio (CAPE) can be used to smooth out the shorter-term earnings swings to get a longer-term assessment of market valuation. An extremely high CAPE ratio means that a company’s stock price is substantially higher than the company’s earnings would indicate and, therefore, overvalued. It is generally expected that the market will eventually correct the company’s stock price by pushing it down to its true value.
In the past, the CAPE ratio has proved its importance in identifying potential bubbles and market crashes. The historical average of the ratio for the S&P 500 Index is between 15-16, while the highest levels of the ratio have exceeded 30. The record-high levels occurred three times in the history of the U.S. financial markets. The first was in 1929 before the Wall Street crash that signaled the start of the Great Depression. The second was in the late 1990s before the Dotcom Crash, and the third came in 2007 before the 2007-2008 Financial Crisis. https://www.multpl.com/shiller-pe
 Note: We do not use CAPE as an official input into our methods. However, we think history serves as a guide and that it’s good to know where we are on the historic continuum.
THIS WEEK IN THE MARKETS
U.S. Markets:
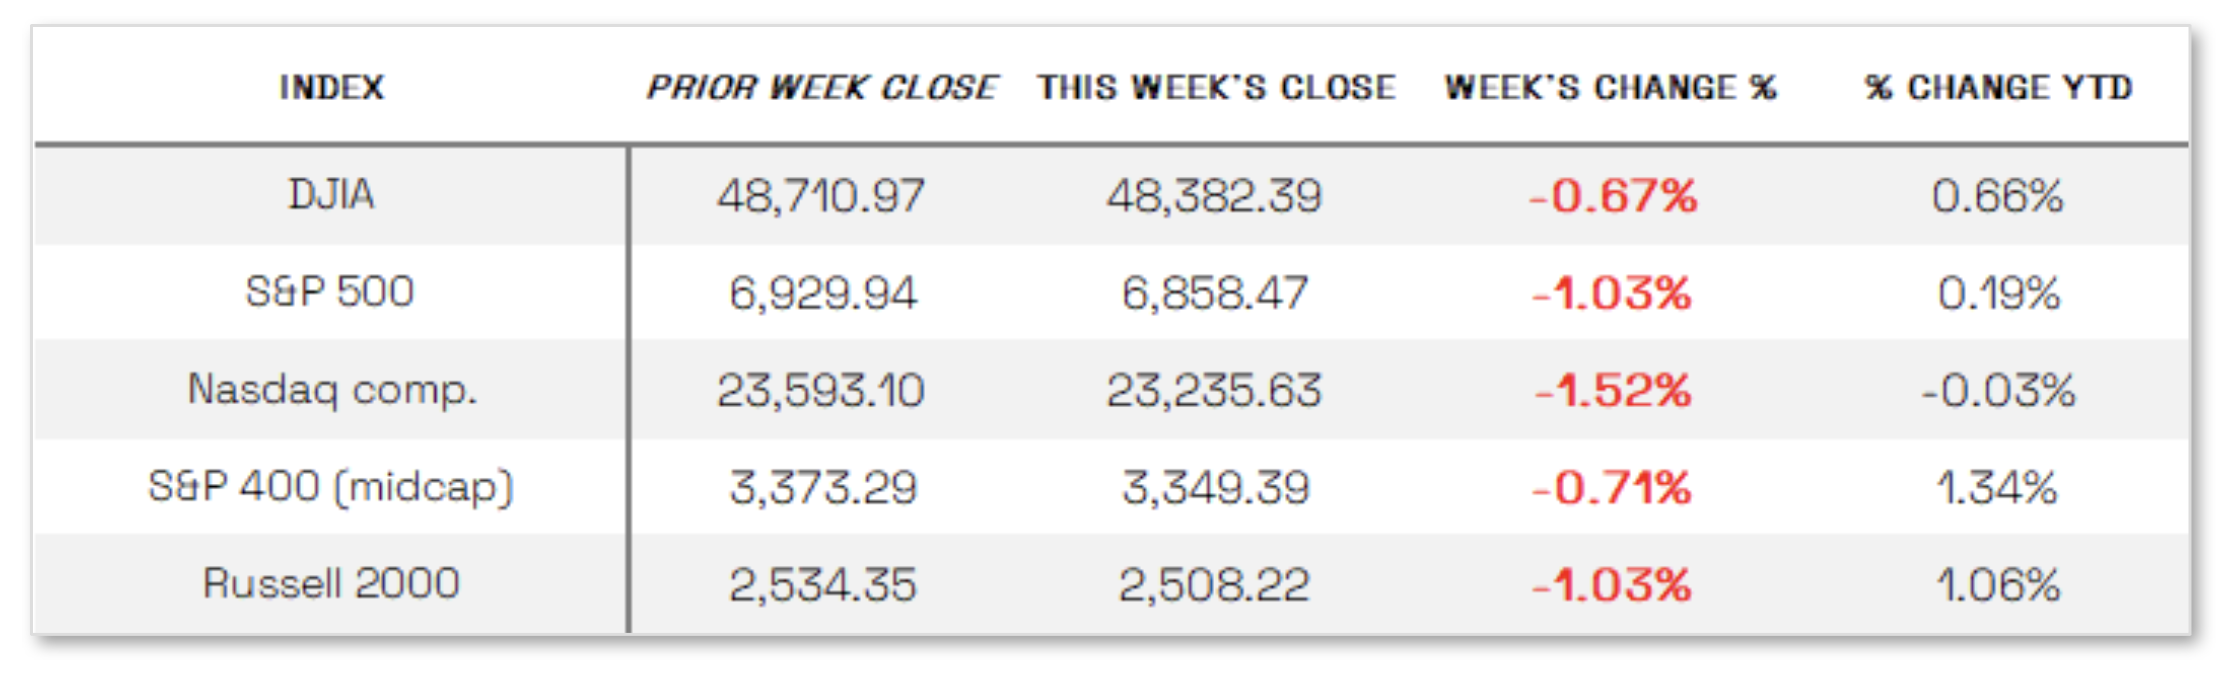
Stocks down in short week: U.S. stocks declined during the holiday-shortened week, though most major indexes still closed out 2025 on Wednesday with double-digit gains for the third consecutive year. The Nasdaq Composite posted the weakest weekly performance, followed by the Russell 2000 and the S&P 500, while the Dow Jones Industrial Average and the S&P MidCap 400 Index held up relatively better but still fell 0.67% and 0.71%, respectively. Within the S&P 500, the energy sector was one of the few areas to generate positive returns, supported by rising oil prices amid heightened geopolitical tensions, particularly early in the week.
Looking at the US Indexes:
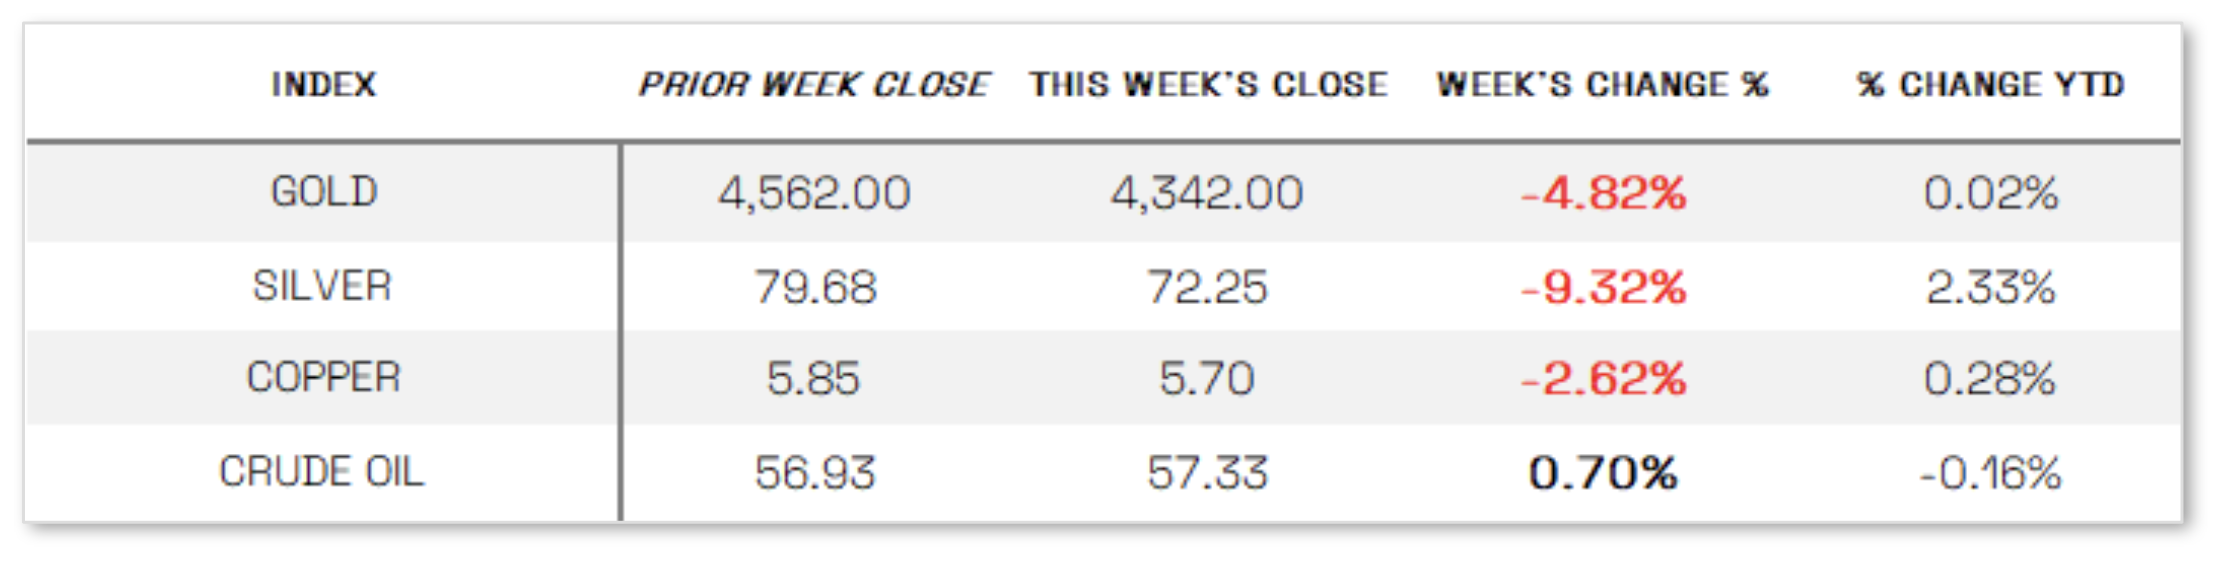
U.S. Commodities/Futures:
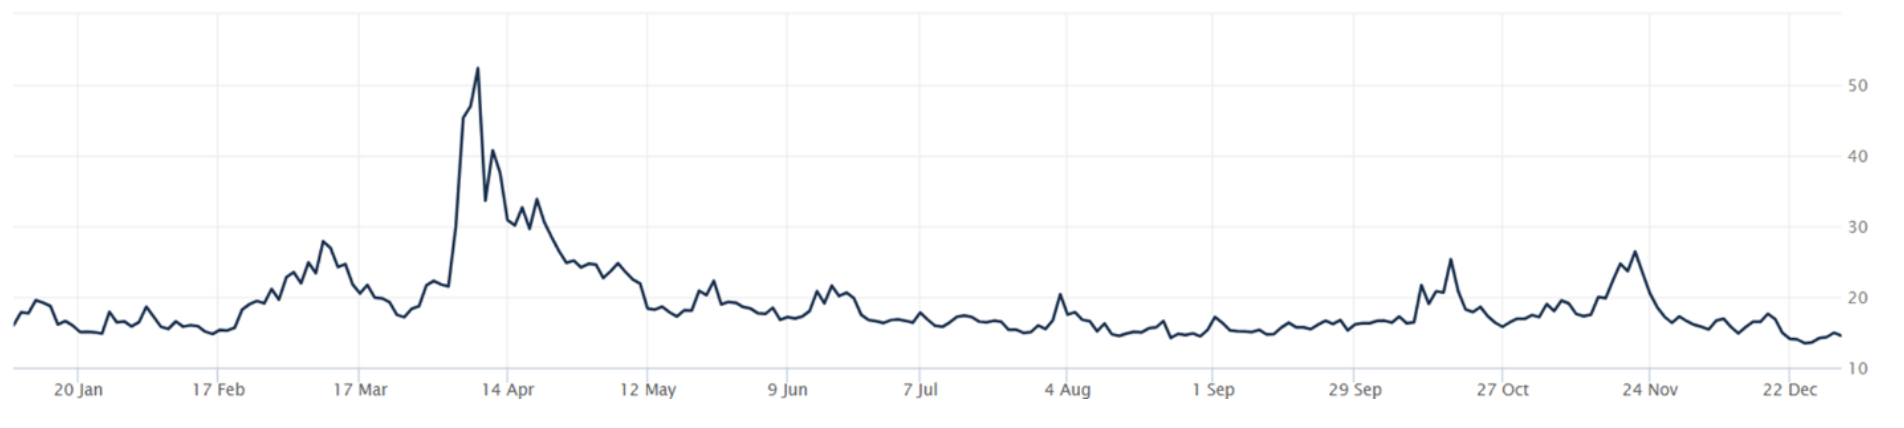
THE VOLATILITY INDEX (VIX) closed at 14.51 this week, a 6.7% increase vs last week’s close of 13.60.
International Markets:
THIS WEEK’S ECONOMIC NEWS
U.S. Economic News:
Positive Economic Data
Recent economic data pointed to continued resilience in the U.S. economy, led by improving housing and labor market conditions alongside a cautiously divided Federal Reserve. The National Association of Realtors reported that its Pending Home Sales Index rose 3.3% in November—the largest monthly increase since February 2023—reflecting strengthening homebuyer momentum supported by lower mortgage rates and wage growth outpacing home price appreciation. Consistent with this trend, the Federal Housing Finance Agency said U.S. house prices increased 0.4% in October after a modest prior-month decline and were up 1.7% year over year, with the strongest gains in the Middle Atlantic and East North Central regions. Meanwhile, minutes from the Federal Reserve’s December policy meeting showed policymakers split on the path ahead after approving a 25-basis-point rate cut, with most favoring additional easing if inflation continues to decline, while others preferred holding rates steady for some time; markets reacted little, and expectations for a January rate cut remained low. On the labor front, initial jobless claims fell for a third consecutive week to 199,000, one of the lowest readings of the year, while continuing claims also declined to 1.866 million, underscoring ongoing labor market strength.
International Economic News:
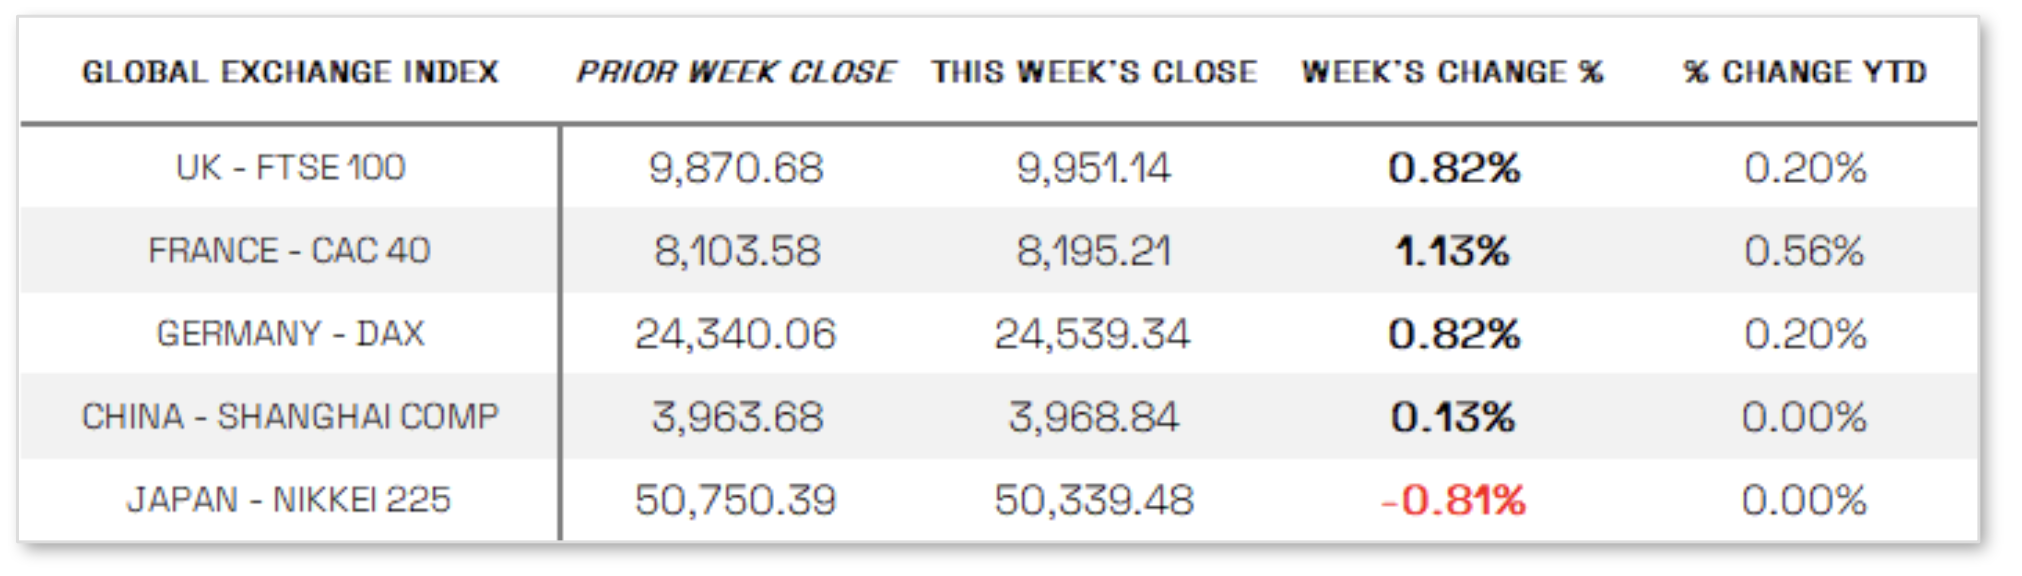
EUROPE: In local currency terms, the pan-European STOXX Europe 600 Index reached a new high during the week and finished up 1.26%, supported by an improving economic backdrop, while closing 2025 with an annual price return of nearly 17%, its strongest performance since 2021. Major regional markets also advanced, with Germany’s DAX rising 0.82%, France’s CAC 40 gaining 1.13%, and Italy’s FTSE MIB climbing 1.72%, while the UK’s FTSE 100 added 0.82% and briefly surpassed the 10,000-point mark for the first time earlier in the week.
JAPAN: In a holiday-shortened week, Japanese equities edged lower, with the Nikkei 225 Index declining 0.81% and the broader TOPIX Index falling 0.4%, even as markets posted strong gains for 2025, marking a third consecutive year of advances driven largely by chipmakers, AI-related technology firms, and construction stocks. Despite uncertainty surrounding the pace of monetary policy tightening by the Bank of Japan, equities were supported throughout the year by a favorable domestic economic backdrop, solid corporate earnings, and a smaller-than-feared impact from U.S. tariffs. Meanwhile, the yen traded around the JPY 156 level against the U.S. dollar and remained near its weakest point since January 2025, fueling expectations of possible currency intervention, although repeated verbal warnings from authorities have so far had limited success in generating sustained yen appreciation.
CHINA: Mainland Chinese equities finished the holiday-shortened week mixed, with the CSI 300 Index edging slightly lower while the Shanghai Composite Index posted a modest gain, and Hong Kong’s Hang Seng Index rising about 2.0%, according to FactSet. Meanwhile, official data showed that China’s manufacturing purchasing managers’ index increased to 50.1 in December from 49.2 in November, ending an eight-month period of contraction, which supports expectations among many economists that Beijing will pursue a measured approach to stimulus in 2026, though some analysts continue to argue for more aggressive policies to revive domestic consumption.
Sources:
>> All index and returns data from Norgate Data and Commodity Systems Incorporated and Wall Street Journal.
>> News from Reuters, Barron’s, Wall St. Journal, Bloomberg.com, ft.com, guggenheimpartners.com, zerohedge.com, ritholtz.com, markit.com, financialpost.com, Eurostat, Statistics Canada, Yahoo! Finance, stocksandnews.com, marketwatch.com, visualcapitalist.com, wantchinatimes.com, BBC, 361capital.com, pensionpartners.com, cnbc.com, FactSet, Morningstar/Ibbotson Associates, Corporate Finance Institute.
>> Commentary from T Rowe Price Global markets weekly update — https://www.troweprice.com/personal-investing/resources/insights/global-markets-weekly-update.html
Disclosures: This material and any mention of specific investments is provided for informational purposes only and is not intended to be investment advice or a recommendation to take any action. The forecasts or forward-looking statements are based on assumptions, may not materialize, and are subject to revision without notice. The market indexes discussed are unmanaged, and generally, considered representative of their respective markets. Index performance is not indicative of the past performance of a particular investment. Indexes do not incur management fees, costs, and expenses. Individuals cannot directly invest in unmanaged indexes. Past performance does not guarantee future results.
