


THE COMPLETE PICTURE
>> Four indicators across three time frames.
>> When all the Sherman Portfolios indicators are positive status, we read the market as being in a Bull Market.
1. DELTA-V — Positive since June 27, 2025
2. GALACTIC SHIELD — Positive since April 1, 2023
3. STARFLUX — Positive since May 12, 2025
4. STARPATH — Positive since August 15, 2025
The shorter term picture:
>> GALACTIC SHIELD — POSITIVE for Q4 2025, This indicator is based on the combination of U.S. and International Equities trend statuses at the start of each quarter.
>> STARFLUX — POSITIVE, Starflux ended the week 7.20 (up 0.28% last week). This short-term indicator measures U.S. Equities. It measures the trend-strength of the Russell 3000 index.
>> STARPATH — POSITIVE, This indicator measures the interplay on dual timeframes of our Type 1s + the Russell 3000 + our four most ‘pro-cyclical’ Type 3s, vs. Cash
The big picture:
The ‘big picture’ is the (typically) years-long timeframe, the same timeframe in which Cyclical Bulls and Bears operate.
>> The Sherman Portfolios DELTA-V Indicator measuring the Bull/Bear cycle finished the week in a Bull status at 66.39, down 0.34% from the prior week’s 66.62. It has signaled Bull since June 27, 2025.
>> The Sherman Portfolios DELTA-V Bond Indicator measuring the Bull/Bear cycle finished the week in BULL status at 60.84, up 2.17% from the prior week’s 59.55. It has signaled Bull since December 15, 2023.
The very big picture (a historical perspective): The CAPE is now at 40.15.
The cyclically adjusted price-to-earnings ratio (CAPE) can be used to smooth out the shorter-term earnings swings to get a longer-term assessment of market valuation. An extremely high CAPE ratio means that a company’s stock price is substantially higher than the company’s earnings would indicate and, therefore, overvalued. It is generally expected that the market will eventually correct the company’s stock price by pushing it down to its true value.
In the past, the CAPE ratio has proved its importance in identifying potential bubbles and market crashes. The historical average of the ratio for the S&P 500 Index is between 15-16, while the highest levels of the ratio have exceeded 30. The record-high levels occurred three times in the history of the U.S. financial markets. The first was in 1929 before the Wall Street crash that signaled the start of the Great Depression. The second was in the late 1990s before the Dotcom Crash, and the third came in 2007 before the 2007-2008 Financial Crisis. https://www.multpl.com/shiller-pe
 Note: We do not use CAPE as an official input into our methods. However, we think history serves as a guide and that it’s good to know where we are on the historic continuum.
THIS WEEK IN THE MARKETS
U.S. Markets:
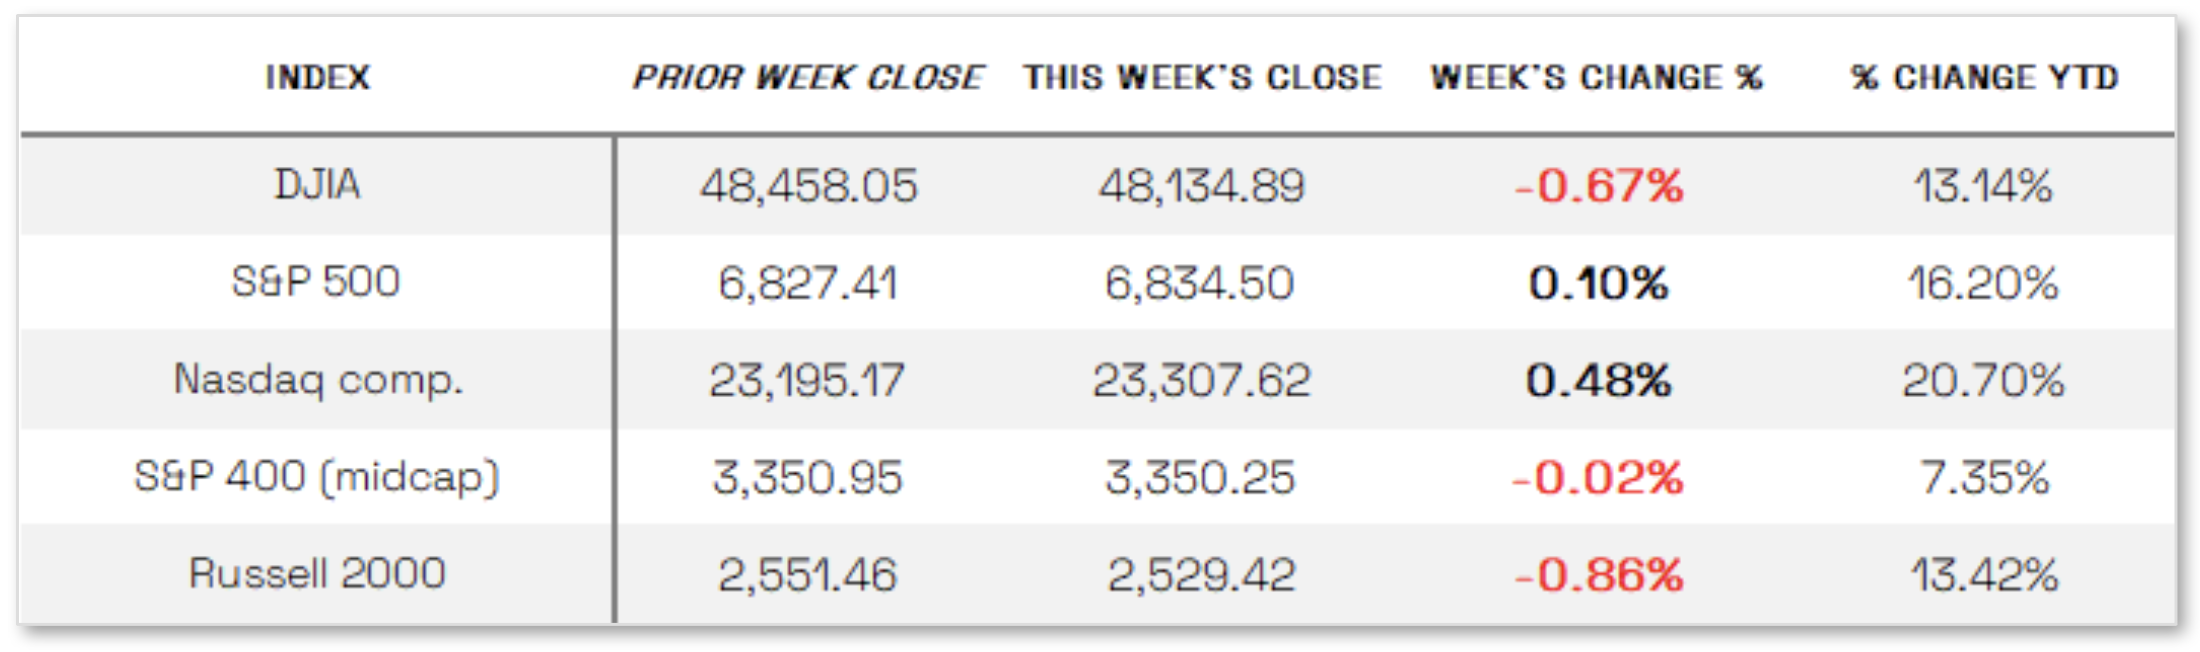
Stocks mixed this week: U.S. stock indexes finished the last full trading week of the year mixed, with the Russell 2000 Index posting the weakest performance, down 0.86%, followed by a 0.67% decline in the Dow Jones Industrial Average, while the S&P MidCap 400 and S&P 500 were little changed and the Nasdaq Composite gained 0.48%. Markets began the week broadly lower, extending the prior week’s technology-sector weakness amid ongoing concerns over valuations and spending in the artificial intelligence space, and sentiment was further pressured by mixed economic data, including November’s jobs report. By week’s end, however, equities rebounded as an encouraging inflation report and strong earnings from semiconductor maker Micron Technology helped improve investor confidence, particularly around AI-related themes.
Looking at the US Indexes:
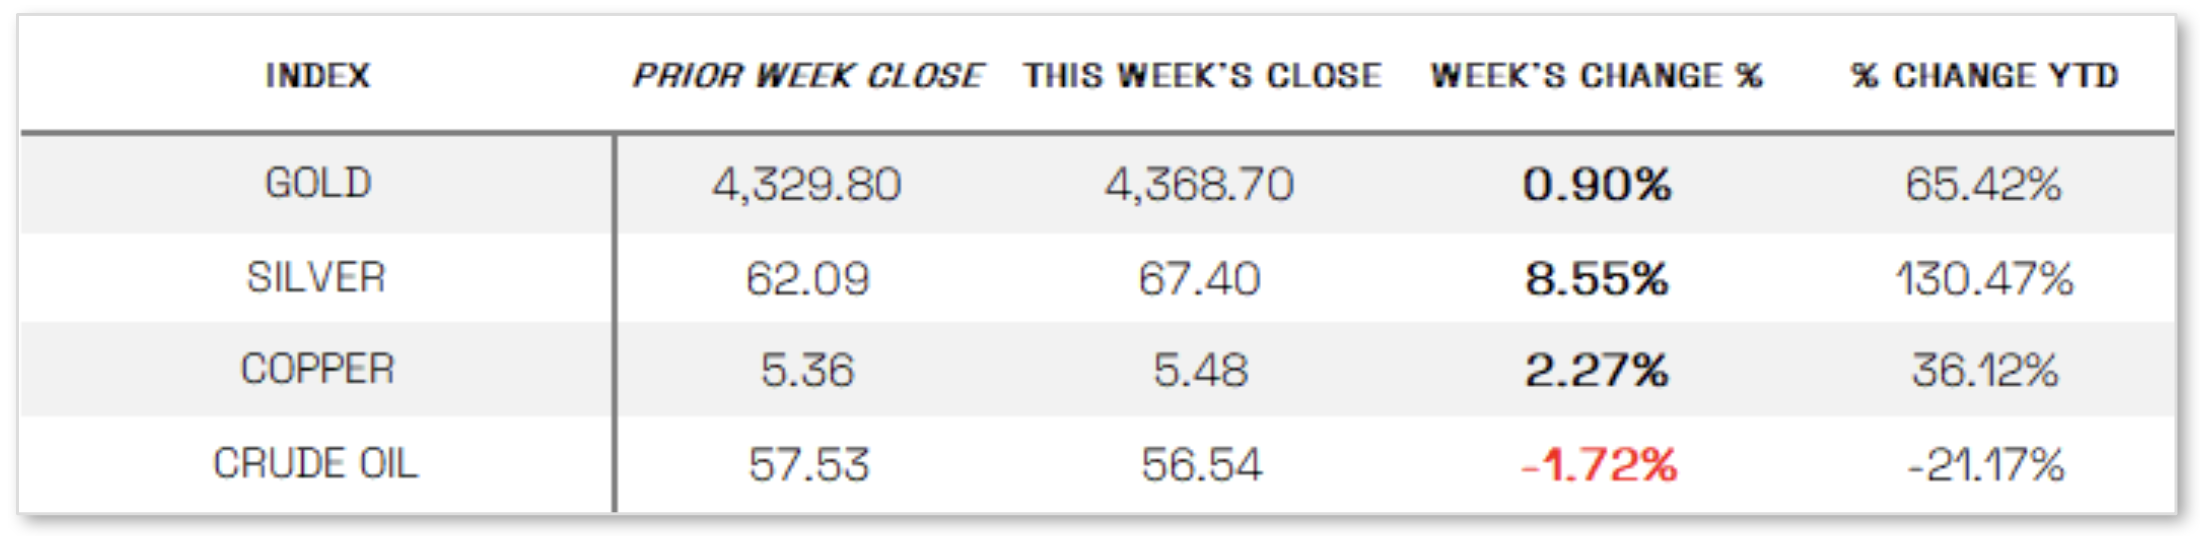
U.S. Commodities/Futures:
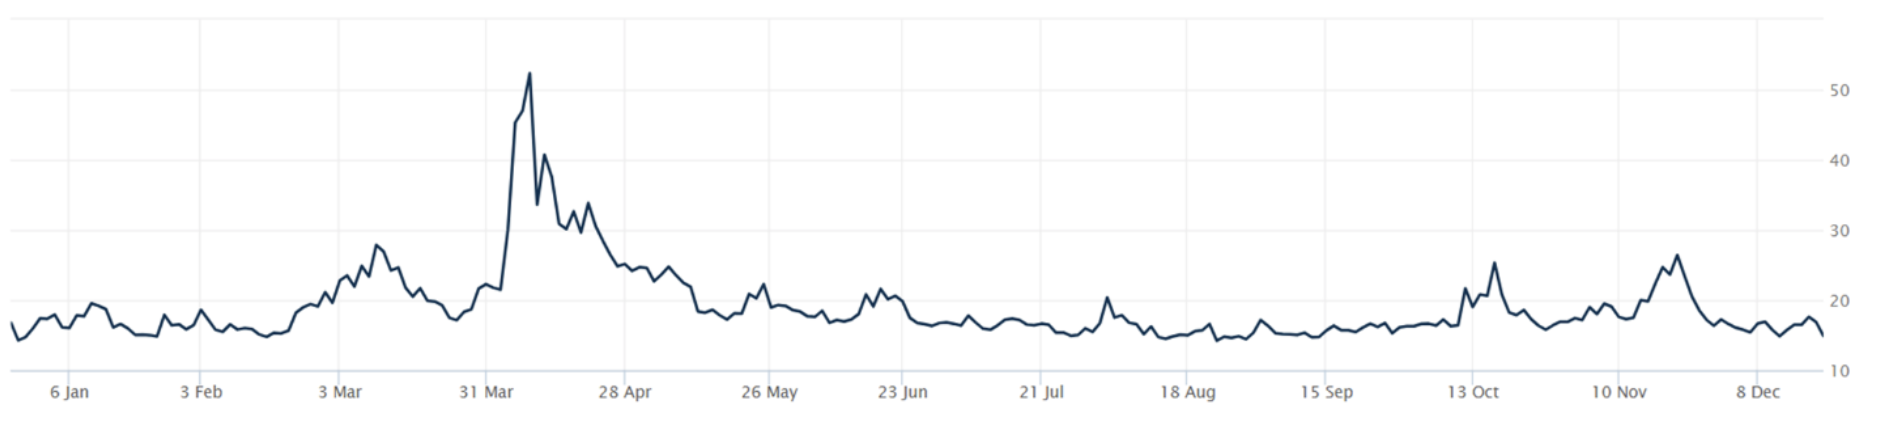
THE VOLATILITY INDEX (VIX) closed at 14.91 this week, a 5.3% decrease vs last week’s close of 15.74.
International Markets:
THIS WEEK’S ECONOMIC NEWS
U.S. Economic News:
Job market weakens
U.S. economic data sent mixed signals during the week, as the Bureau of Labor Statistics reported that employers added 64,000 jobs in November, exceeding expectations of roughly 45,000 and rebounding from a revised October decline of 105,000 jobs that was largely driven by a loss of 162,000 federal government positions due to the shutdown, with November gains led by health care and construction; however, the unemployment rate rose to 4.6%, its highest level in more than four years. Later in the week, inflation data were more encouraging, as the consumer price index showed prices rising 2.7% year over year in November, below expectations and down from September’s 3% increase, while core inflation slowed to 2.6%—its lowest level since March 2021—helped by easing shelter costs, which rose 3% year over year, the slowest pace since August 2021.
International Economic News:
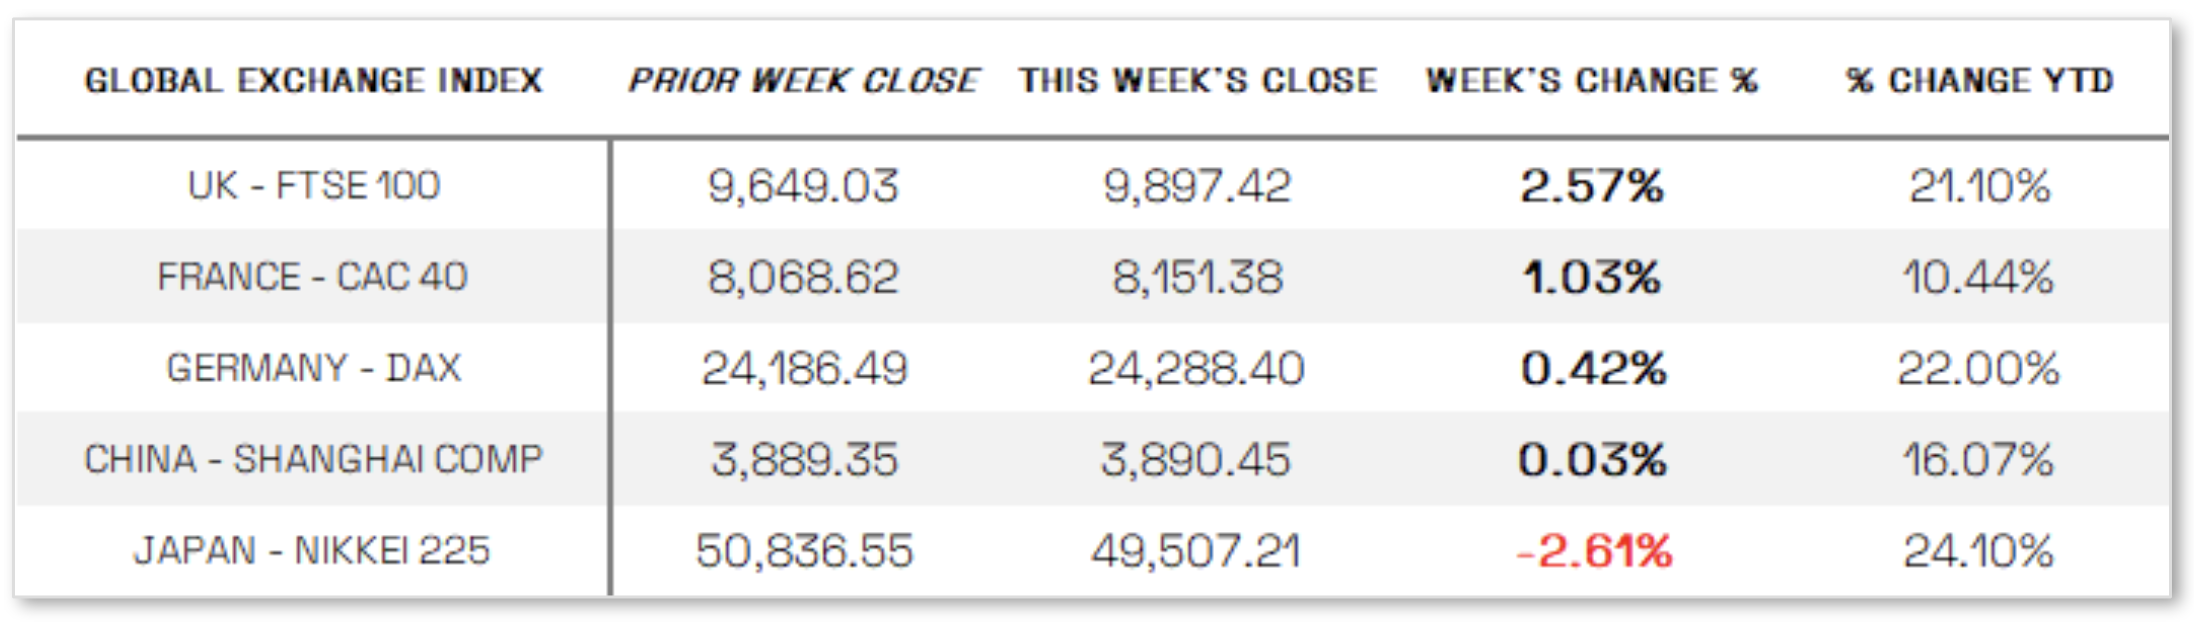
EUROPE: European equities advanced in local currency terms, with the STOXX Europe 600 Index rising 1.60% amid signs of steady economic growth and a more accommodative monetary policy backdrop, while major national indexes also posted gains, including Italy’s FTSE MIB up 2.86%, the UK’s FTSE 100 higher by 2.57%, France’s CAC 40 up 1.03%, and Germany’s DAX adding 0.42%. On the policy front, the European Central Bank kept its deposit rate unchanged at 2.0% for a fourth straight meeting, with President Christine Lagarde noting that policy remains “in a good place” but reiterating a data-dependent, meeting-by-meeting approach, alongside upgraded GDP growth forecasts and expectations for inflation to dip below target in 2026–27 before returning to 2.0% in 2028. In the UK, the Bank of England cut its policy rate by 25 basis points to 3.75% in a narrow 5–4 vote, signaling a more dovish tilt as inflation cooled and the labor market weakened, while emphasizing that further easing would be gradual and increasingly finely balanced.
JAPAN: Japanese equities declined over the week, with the Nikkei 225 Index falling 2.61% and the broader TOPIX Index down 1.17%, as technology shares weakened alongside their U.S. counterparts amid concerns over elevated valuations and aggressive spending in the artificial intelligence space. On the policy front, the Bank of Japan delivered a widely expected move, voting unanimously to raise its benchmark interest rate by 25 basis points from 0.50% to 0.75%—its highest level since 1995—citing greater confidence in its economic outlook, though it provided limited guidance on the timing of future hikes. The decision, which markets had largely priced in ahead of the December 18–19 meeting, pushed the 10-year Japanese government bond yield up to 2.01% from 1.95% the prior week.
CHINA: Mainland Chinese equities ended the week mixed amid a series of economic indicators highlighting sluggish growth, with the CSI 300 Index slipping 0.28%, the Shanghai Composite edging up 0.03%, and Hong Kong’s Hang Seng Index falling 1.10%. Data showed retail sales rising just 1.3% year over year in November—the slowest pace since the pandemic—while fixed asset investment fell 2.6% over the first 11 months of the year, putting it on track for its first annual contraction since records began in 1998, and industrial output grew 4.8%, below expectations, underscoring continued reliance on exports as domestic demand remains weak. Despite ongoing efforts to stimulate consumption, recent policy signals suggest a restrained approach, as Chinese leaders indicated they would not significantly ramp up stimulus next year, instead emphasizing flexible use of monetary tools to maintain liquidity and a “necessary” level of fiscal support, which analysts view as reinforcing Beijing’s commitment to a manufacturing-led growth strategy while taking incremental steps to bolster consumption.
Sources:
>> All index and returns data from Norgate Data and Commodity Systems Incorporated and Wall Street Journal.
>> News from Reuters, Barron’s, Wall St. Journal, Bloomberg.com, ft.com, guggenheimpartners.com, zerohedge.com, ritholtz.com, markit.com, financialpost.com, Eurostat, Statistics Canada, Yahoo! Finance, stocksandnews.com, marketwatch.com, visualcapitalist.com, wantchinatimes.com, BBC, 361capital.com, pensionpartners.com, cnbc.com, FactSet, Morningstar/Ibbotson Associates, Corporate Finance Institute.
>> Commentary from T Rowe Price Global markets weekly update — https://www.troweprice.com/personal-investing/resources/insights/global-markets-weekly-update.html
Disclosures: This material and any mention of specific investments is provided for informational purposes only and is not intended to be investment advice or a recommendation to take any action. The forecasts or forward-looking statements are based on assumptions, may not materialize, and are subject to revision without notice. The market indexes discussed are unmanaged, and generally, considered representative of their respective markets. Index performance is not indicative of the past performance of a particular investment. Indexes do not incur management fees, costs, and expenses. Individuals cannot directly invest in unmanaged indexes. Past performance does not guarantee future results.
