


THE COMPLETE PICTURE
>> Four indicators across three time frames.
>> When all the Sherman Portfolios indicators are positive status, we read the market as being in a Bull Market.
1. DELTA-V — Positive since June 27, 2025
2. GALACTIC SHIELD — Positive since April 1, 2023
3. STARFLUX — Positive since May 12, 2025
4. STARPATH — Positive since August 15, 2025
The shorter term picture:
>> GALACTIC SHIELD — POSITIVE, for Q3 2025, This indicator is based on the combination of U.S. and International Equities trend statuses at the start of each quarter.
>> STARFLUX — POSITIVE, Starflux ended the week at 8.50 (Up 4.81% last week) This short-term indicator measures U.S. Equities.
>> STARPATH — POSITIVE, This indicator measures the interplay on dual timeframes of our Type 1s + the Russell 3000 + our four most ‘pro-cyclical’ Type 3s, vs. Cash.
The big picture:
The ‘big picture’ is the (typically) years-long timeframe, the same timeframe in which Cyclical Bulls and Bears operate.
>> The Sherman Portfolios DELTA-V Indicator measuring the Bull/Bear cycle finished the week in a Bull status at 68.60, up 2.65% from the prior week’s 66.83. It has signaled Bull since June 27, 2025.
>> The Sherman Portfolios DELTA-V Bond Indicator measuring the Bull/Bear cycle finished the week in BULL status at 63.75, up 2.91% from the prior week’s 61.95. It has signaled Bull since December 15, 2023.
The very big picture (a historical perspective): The CAPE is now at 38.93.
The cyclically adjusted price-to-earnings ratio (CAPE) can be used to smooth out the shorter-term earnings swings to get a longer-term assessment of market valuation. An extremely high CAPE ratio means that a company’s stock price is substantially higher than the company’s earnings would indicate and, therefore, overvalued. It is generally expected that the market will eventually correct the company’s stock price by pushing it down to its true value.
In the past, the CAPE ratio has proved its importance in identifying potential bubbles and market crashes. The historical average of the ratio for the S&P 500 Index is between 15-16, while the highest levels of the ratio have exceeded 30. The record-high levels occurred three times in the history of the U.S. financial markets. The first was in 1929 before the Wall Street crash that signaled the start of the Great Depression. The second was in the late 1990s before the Dotcom Crash, and the third came in 2007 before the 2007-2008 Financial Crisis. https://www.multpl.com/shiller-pe
 Note: We do not use CAPE as an official input into our methods. However, we think history serves as a guide and that it’s good to know where we are on the historic continuum.
THIS WEEK IN THE MARKETS
U.S. Markets:
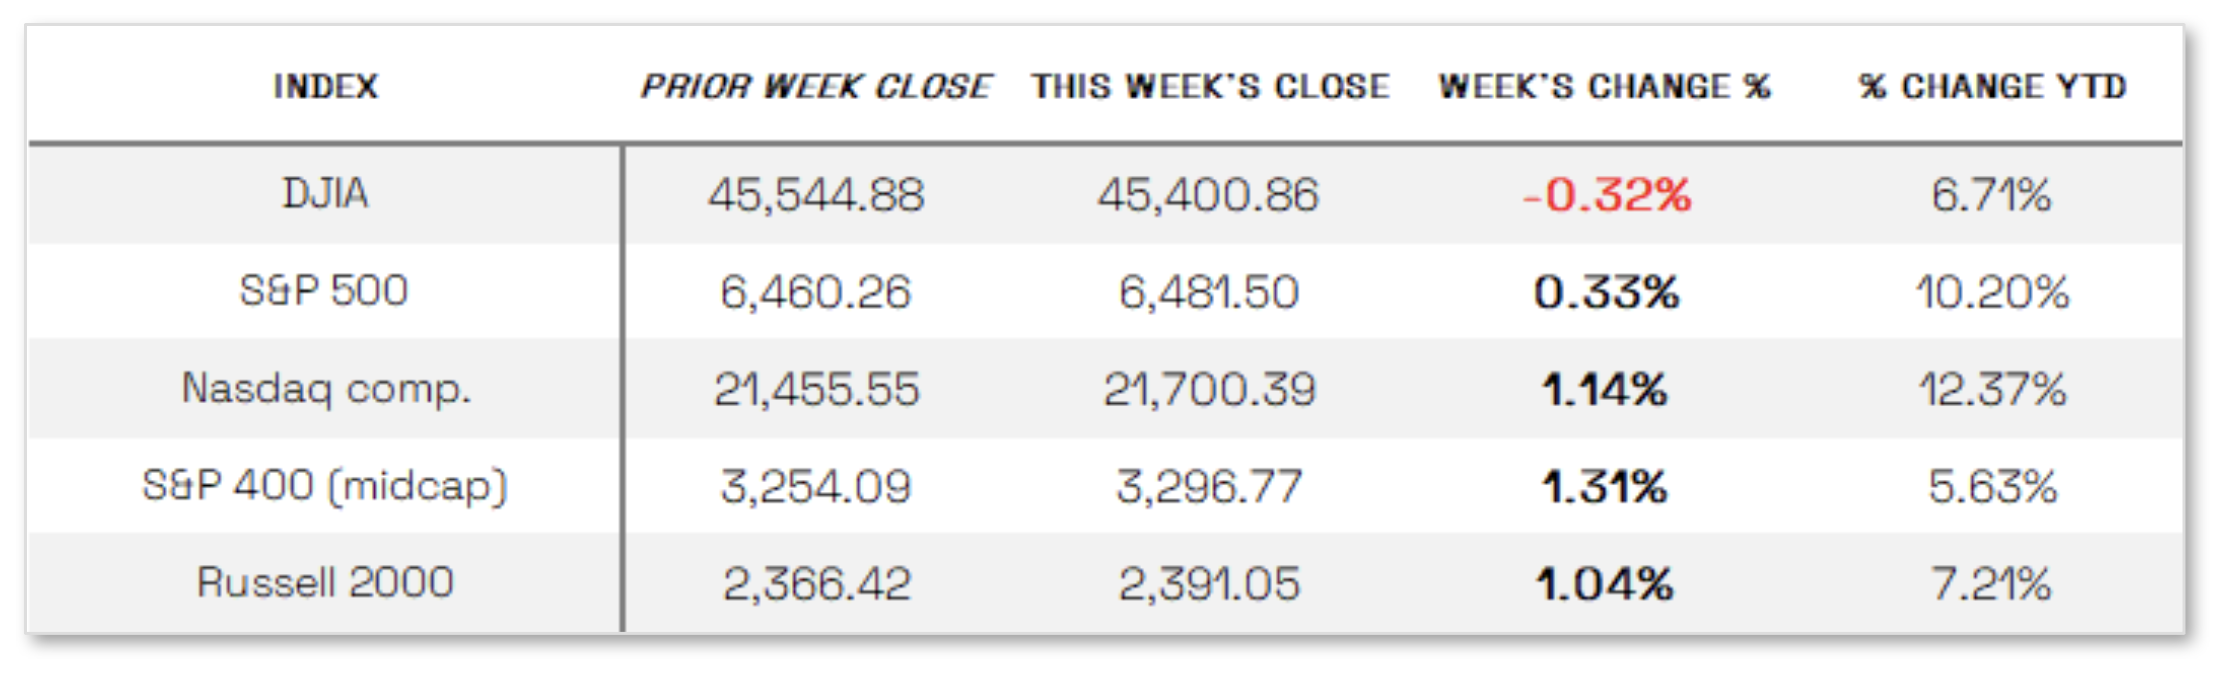
Markets mixed this week: Most U.S. equity indexes ended the holiday-shortened week higher, with stocks generally rising through Thursday and opening stronger Friday after weaker-than-expected labor market data fueled hopes of a Federal Reserve rate cut, though sentiment later reversed as concerns grew that cuts might not be enough to support growth. The Nasdaq Composite gained 1.14%, lifted by Apple and Alphabet after a less severe-than-expected antitrust ruling, while smaller-cap stocks also advanced on rate sensitivity. The S&P 500 added 0.33%, but the Dow Jones Industrial Average slipped 0.32%.
Looking at the US Indexes:
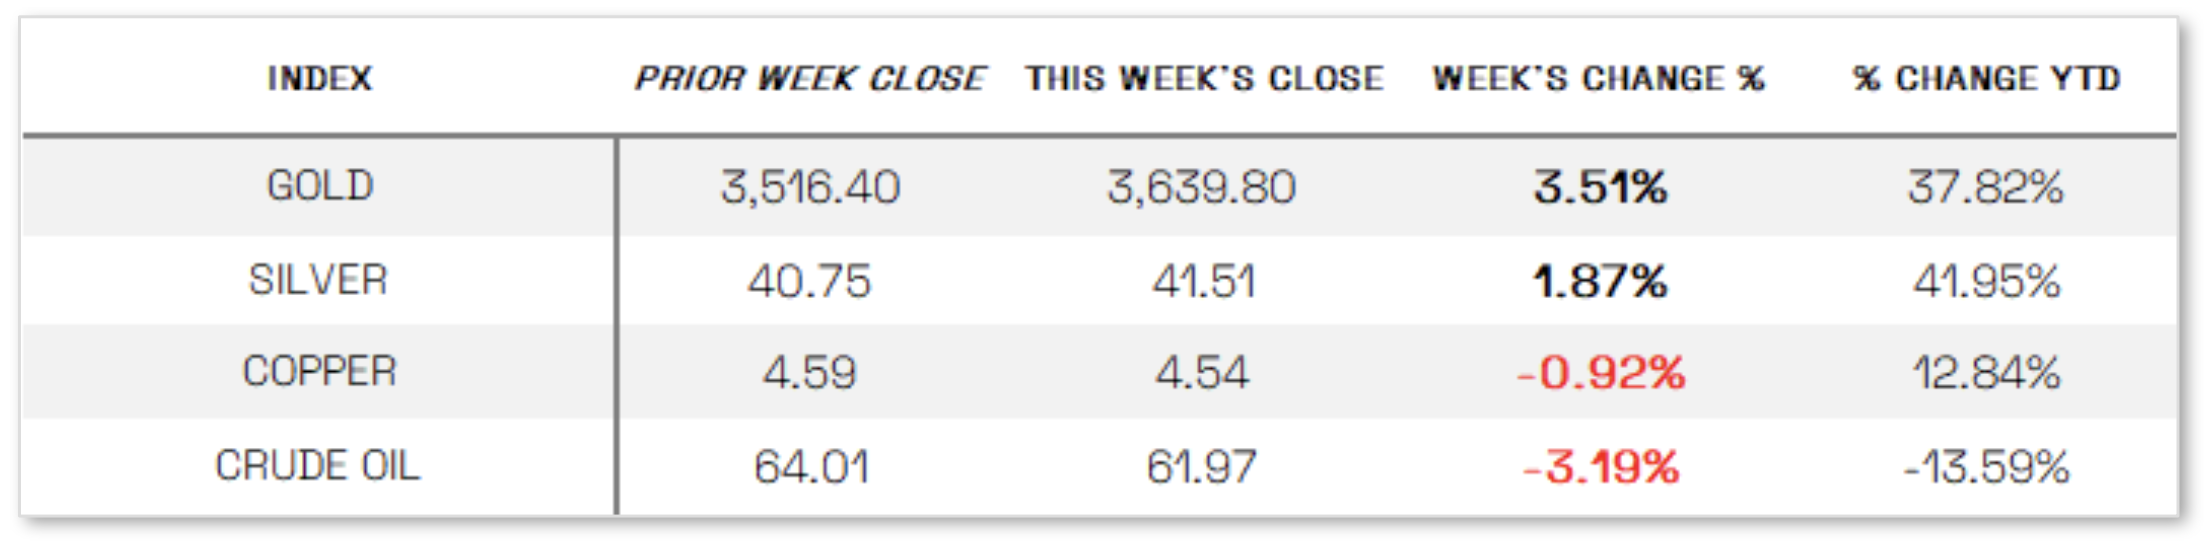
U.S. Commodities/Futures:
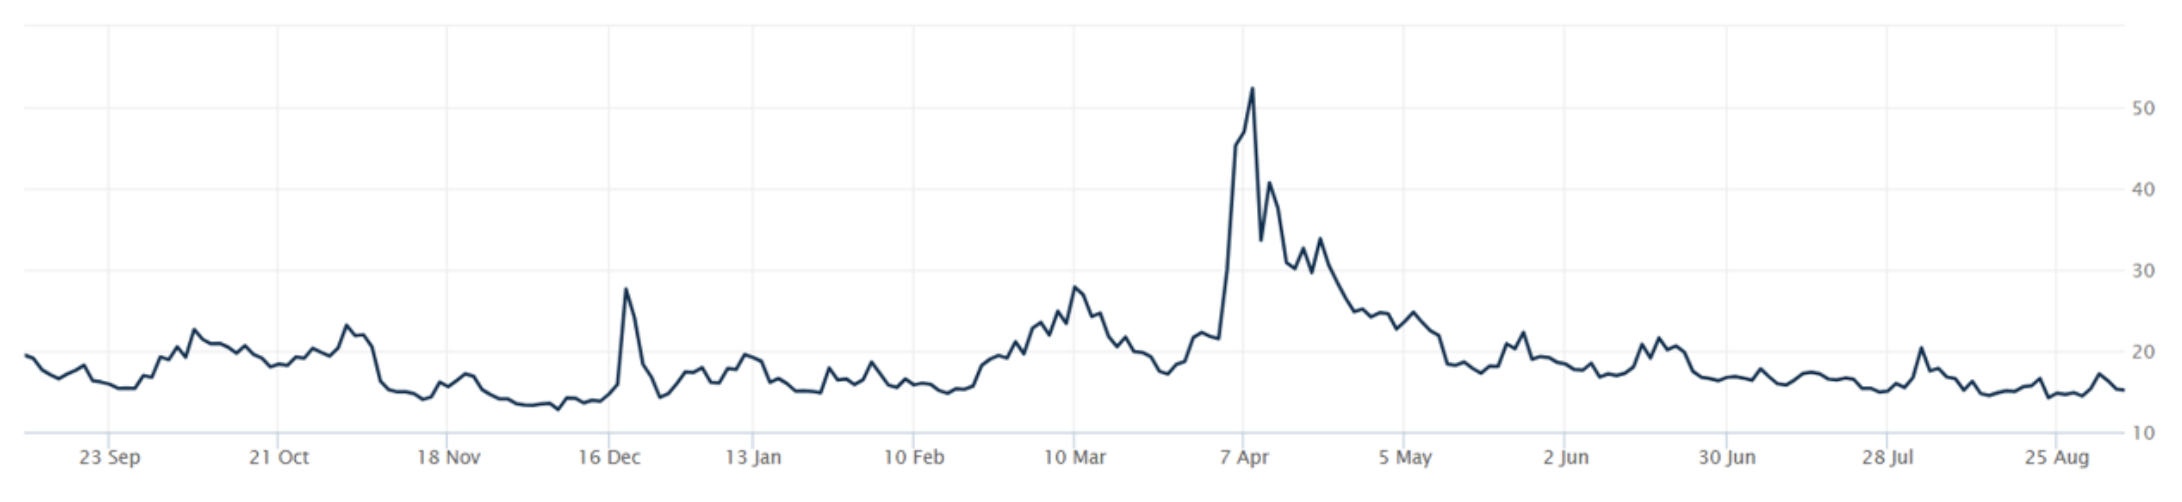
THE VOLATILITY INDEX (VIX) closed at 15.18 this week, a 1.2% decrease vs last week’s close of 15.36.
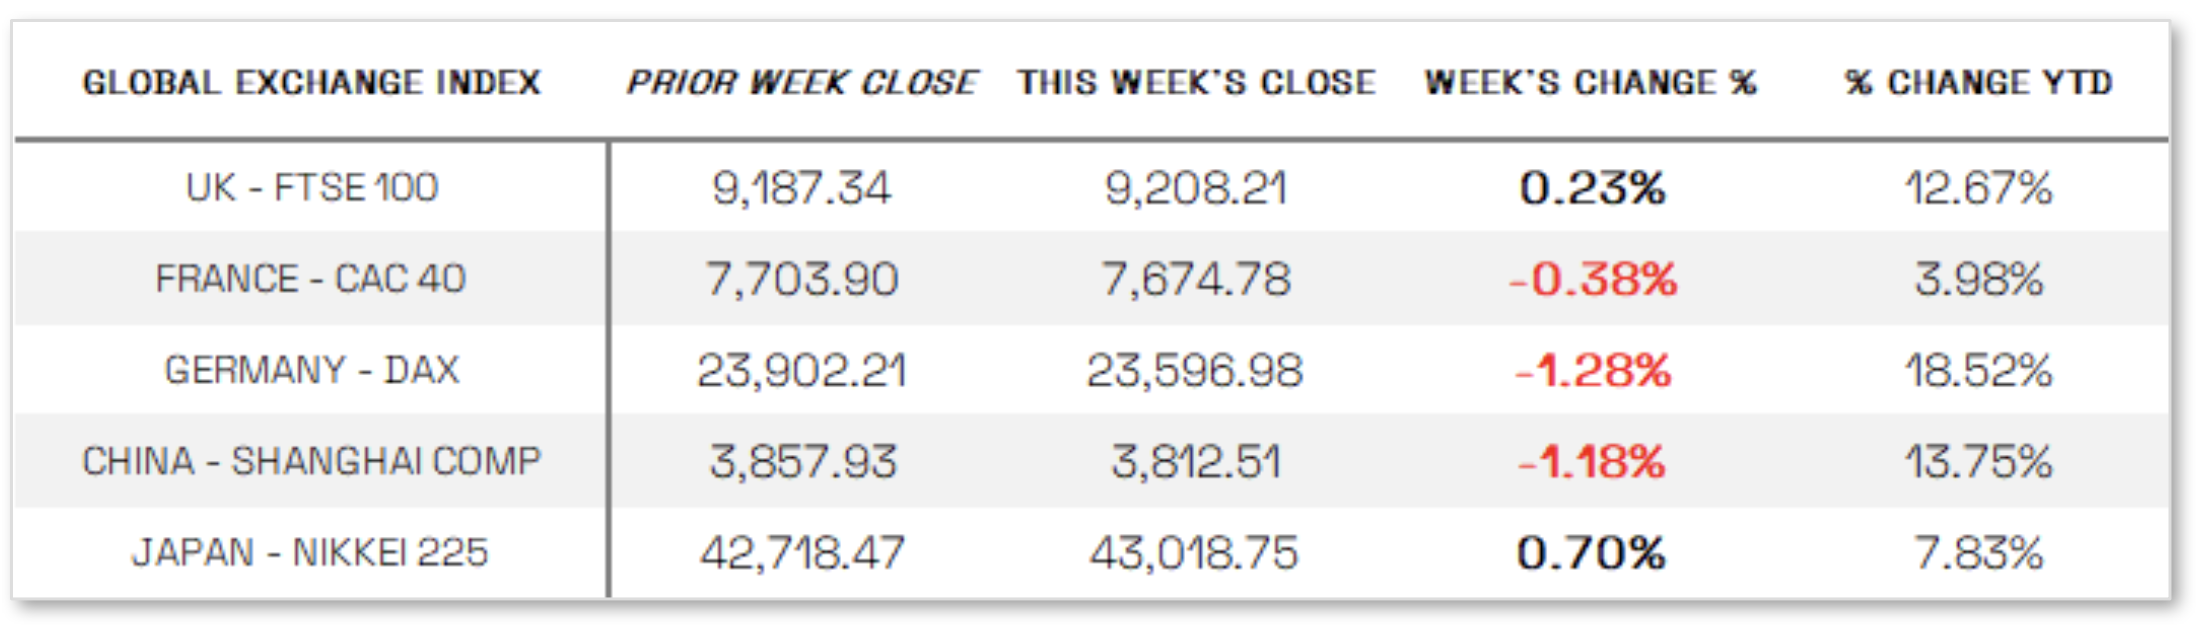
International Markets:
THIS WEEK’S ECONOMIC NEWS
U.S. Economic News:
Weakened Labor market:
Weak labor market data heightened expectations for a September rate cut as several reports pointed to slowing job growth and rising unemployment. The Labor Department’s nonfarm payrolls report showed just 22,000 jobs added in August—well below forecasts and July’s revised 79,000—while June’s figure was revised to a loss of 13,000, the first negative reading since 2020; the unemployment rate also rose to 4.3%, the highest since 2021. ADP’s private payrolls report reflected similar weakness, with only 54,000 jobs added versus 106,000 in July, and job openings fell to the lowest since September 2024, with unemployed Americans outnumbering openings for the first time since 2021. In response, futures markets priced in a 100% chance of a 25-basis-point rate cut and about a 10% chance of a 50-basis-point cut at the Fed’s next meeting, while Treasury yields fell sharply, driving the 10-year note to its lowest since April. Beyond labor data, the ISM reported that manufacturing activity contracted for a sixth straight month, with the PMI at 48.7% but showing improvement in new orders, while the services sector expanded more strongly, with its PMI climbing to 52%, supported by faster growth in business activity and new orders despite still-elevated price pressures.
International Economic News:
EUROPE: In local currency terms, the pan-European STOXX Europe 600 Index slipped 0.17% as weak U.S. jobs data and a stronger euro fueled concerns about global growth, with major indexes mixed: Italy’s FTSE MIB fell 1.39%, Germany’s DAX dropped 1.28%, France’s CAC 40 declined 0.38%, while the UK’s FTSE 100 rose 0.23%. Eurozone inflation in August edged up to 2.1%, remaining near the ECB’s 2% target, while core inflation held steady at 2.3% and services inflation eased slightly to 3.1%. ECB policymakers signaled rates would likely stay unchanged in September and beyond, with most economists expecting the central bank to have ended its easing cycle given stable inflation and economic resilience.
JAPAN: Japan’s stock markets advanced over the week, with the Nikkei 225 rising 0.70% and the TOPIX up 0.98%, helped by auto shares after the U.S. implemented a July trade deal that capped tariffs on most Japanese goods, including autos, at 15% in exchange for Japan’s USD 550 billion investment commitment and expanded U.S. market access. The 10-year Japanese government bond yield fell to 1.57% from 1.61%, having touched 17-year highs midweek amid political uncertainty as Prime Minister Shigeru Ishiba faced calls to resign, while the yen weakened to around JPY 148 per dollar from JPY 147. Speculation grew about a possible Bank of Japan rate hike as early as October after July wage data showed nominal wages rising 4.1% year on year, well above expectations, with real wages turning positive for the first time this year; BoJ Deputy Governor Ryozo Himino reiterated that the central bank would raise rates if economic and price developments align with forecasts, expecting wage-price dynamics to eventually lift inflation to the 2% target.
CHINA: Mainland Chinese stocks retreated as investors took profits following a strong rally, with the CSI 300 Index down 0.81% and the Shanghai Composite off 1.18%, while Hong Kong’s Hang Seng Index gained 1.36%. Markets have surged since April—driven more by abundant domestic liquidity than earnings or economic strength—with the CSI 300 jumping 10% in August, its best showing since last September, and climbing over 20% from this year’s low. Trading activity has been robust, with turnover and margin financing hitting records, signaling strong retail risk appetite. Sentiment has been boosted by optimism around China’s advances in artificial intelligence, the government’s “anti-involution” campaign to curb overcapacity, and cash-rich households seeking returns amid low rates and limited alternatives. Still, economic indicators suggest a broad slowdown, with headwinds from higher U.S. tariffs, a prolonged property slump, and ongoing deflation, leading many economists to expect further stimulus as growth weakens under trade war pressures.
Sources:
>> All index and returns data from Norgate Data and Commodity Systems Incorporated and Wall Street Journal.
>> News from Reuters, Barron’s, Wall St. Journal, Bloomberg.com, ft.com, guggenheimpartners.com, zerohedge.com, ritholtz.com, markit.com, financialpost.com, Eurostat, Statistics Canada, Yahoo! Finance, stocksandnews.com, marketwatch.com, visualcapitalist.com, wantchinatimes.com, BBC, 361capital.com, pensionpartners.com, cnbc.com, FactSet, Morningstar/Ibbotson Associates, Corporate Finance Institute.
>> Commentary from T Rowe Price Global markets weekly update — https://www.troweprice.com/personal-investing/resources/insights/global-markets-weekly-update.html
Disclosures: This material and any mention of specific investments is provided for informational purposes only and is not intended to be investment advice or a recommendation to take any action. The forecasts or forward-looking statements are based on assumptions, may not materialize, and are subject to revision without notice. The market indexes discussed are unmanaged, and generally, considered representative of their respective markets. Index performance is not indicative of the past performance of a particular investment. Indexes do not incur management fees, costs, and expenses. Individuals cannot directly invest in unmanaged indexes. Past performance does not guarantee future results.
