


THE COMPLETE PICTURE
>> Four indicators across three time frames.
>> When the Sherman Portfolios indicators are mixed status, we read the market as being in a Mixed Market.
1. DELTA-V — Positive since June 27, 2025
2. GALACTIC SHIELD — Positive since April 1, 2023
3. STARFLUX — Positive since May 12, 2025
4. STARPATH — Negative since August 1, 2025
The shorter term picture:
>> GALACTIC SHIELD — POSITIVE, This indicator is based on the combination of U.S. and International Equities trend statuses at the start of each quarter.
>> STARFLUX — POSITIVE, Starflux ended the week at 6.87 (Down 30.18% last week) This short-term indicator measures U.S. Equities.
>> STARPATH — NEGATIVE, This indicator measures the interplay on dual timeframes of our Type 1s + the Russell 3000 + our four most ‘pro-cyclical’ Type 3s, vs. Cash.
The big picture:
The ‘big picture’ is the (typically) years-long timeframe, the same timeframe in which Cyclical Bulls and Bears operate.
>> The Sherman Portfolios DELTA-V Indicator measuring the Bull/Bear cycle finished the week in a Bull status at 62.42, down 3.36% from the prior week’s 64.59. It has signaled Bull since June 27, 2025.
>> The Sherman Portfolios DELTA-V Bond Indicator measuring the Bull/Bear cycle finished the week in BULL status at 57.79, up 4.26% from the prior week’s 55.43. It has signaled Bull since December 15, 2023.
The very big picture (a historical perspective): The CAPE is now at 38.00.
The cyclically adjusted price-to-earnings ratio (CAPE) can be used to smooth out the shorter-term earnings swings to get a longer-term assessment of market valuation. An extremely high CAPE ratio means that a company’s stock price is substantially higher than the company’s earnings would indicate and, therefore, overvalued. It is generally expected that the market will eventually correct the company’s stock price by pushing it down to its true value.
In the past, the CAPE ratio has proved its importance in identifying potential bubbles and market crashes. The historical average of the ratio for the S&P 500 Index is between 15-16, while the highest levels of the ratio have exceeded 30. The record-high levels occurred three times in the history of the U.S. financial markets. The first was in 1929 before the Wall Street crash that signaled the start of the Great Depression. The second was in the late 1990s before the Dotcom Crash, and the third came in 2007 before the 2007-2008 Financial Crisis. https://www.multpl.com/shiller-pe
 Note: We do not use CAPE as an official input into our methods. However, we think history serves as a guide and that it’s good to know where we are on the historic continuum.
THIS WEEK IN THE MARKETS
U.S. Markets:
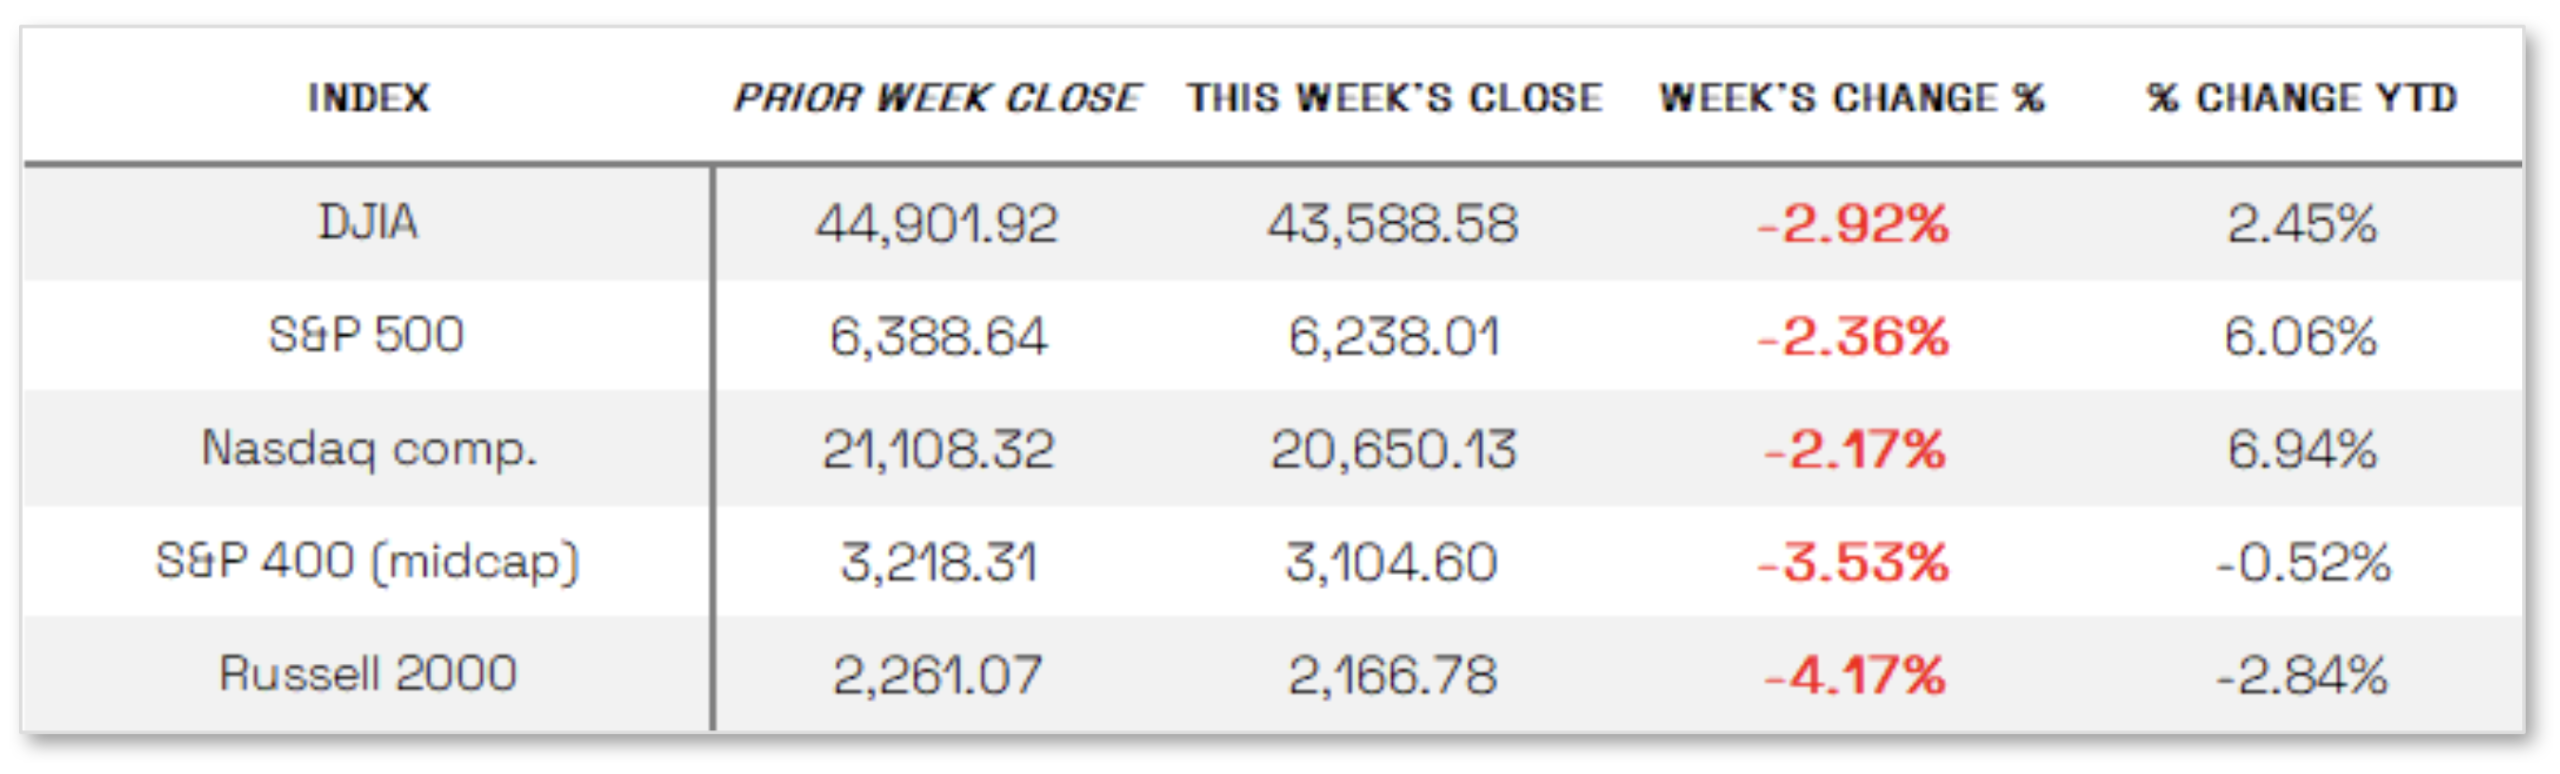
Stocks down this week: U.S. stocks declined sharply over the week amid renewed tariff pressures, trade policy uncertainty, and disappointing economic data, marking the worst performance for some indexes since early April’s tariff-driven sell-off. Smaller-cap indexes were hit hardest, with the Russell 2000 and S&P MidCap 400 falling 4.17% and 3.53%, respectively, while the Dow Jones Industrial Average dropped 2.92% and the S&P 500 lost 2.36%. The Nasdaq Composite fared slightly better, declining 2.17% and retaining its year-to-date lead. Market sentiment was heavily influenced by trade developments, especially President Trump’s August 1 deadline for new trade deals, culminating in Thursday’s executive order raising tariffs on most U.S. trading partners, effective August 7. This move, coupled with announcements of new deals with the EU and South Korea and an extended negotiation window for Mexico, weighed on markets. Earnings reports also shaped the week’s activity, with FactSet data showing 82% of S&P 500 companies beating estimates, despite concerns from firms like Ford Motor, which warned of a $2 billion tariff impact. Meanwhile, shares of Microsoft and Meta Platforms rose on stronger-than-expected earnings, buoyed by optimism around artificial intelligence.
Looking at the US Indexes:
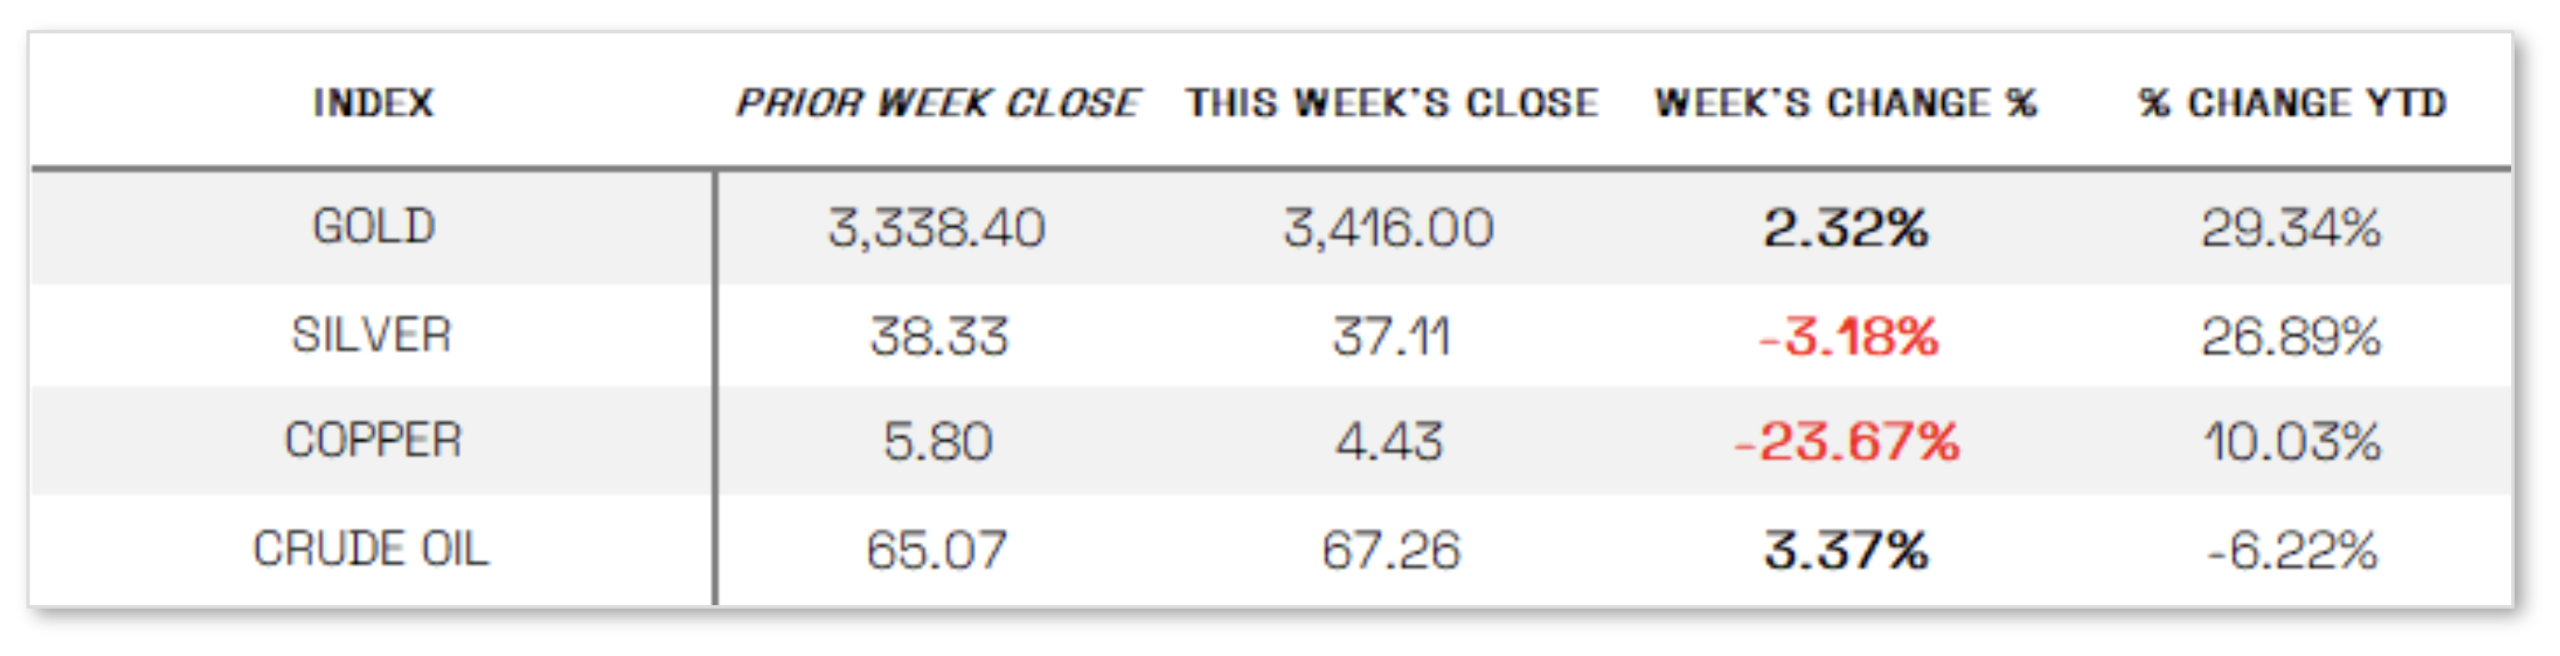
U.S. Commodities/Futures:
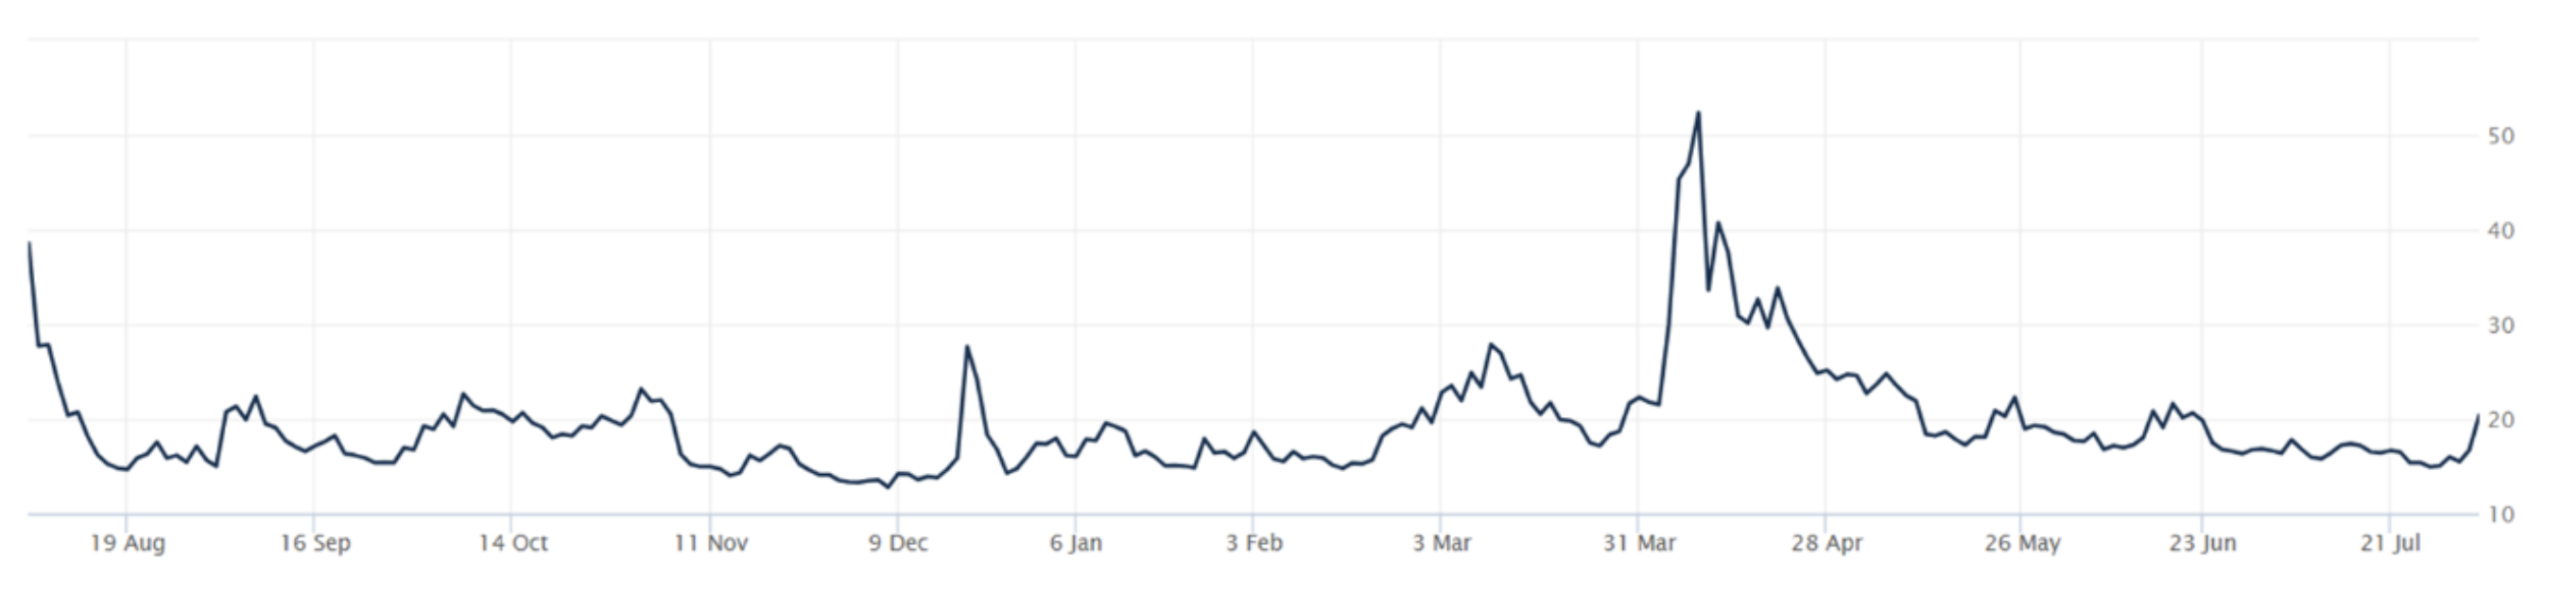
THE VOLATILITY INDEX (VIX) closed at 20.38 this week, a 36.5% increase vs last week’s close of 14.93.
International Markets:
THIS WEEK’S ECONOMIC NEWS
U.S. Economic News:
No change to Fed Rates:
The Federal Reserve held interest rates steady for the fifth consecutive meeting, keeping its target range at 4.25% to 4.50%, as expected, though two Fed governors dissented in favor of an immediate rate cut. The post-meeting statement noted that economic activity had moderated in the first half of the year, which some interpreted as dovish, but Fed Chair Jerome Powell struck a more cautious tone, emphasizing persistent inflation and the Fed’s data-dependent approach, dampening expectations for a September rate cut. Meanwhile, inflation data from the Bureau of Economic Analysis showed the Fed’s preferred core PCE index rose 0.3% in June, up from 0.2% in May, pushing the year-over-year increase to 2.8%—well above the 2% target. The BEA also reported a surprising 3% annualized GDP growth rate in the second quarter, rebounding from a 0.5% decline in Q1, with the jump largely attributed to a sharp drop in imports, which subtract from GDP calculations.
International Economic News:
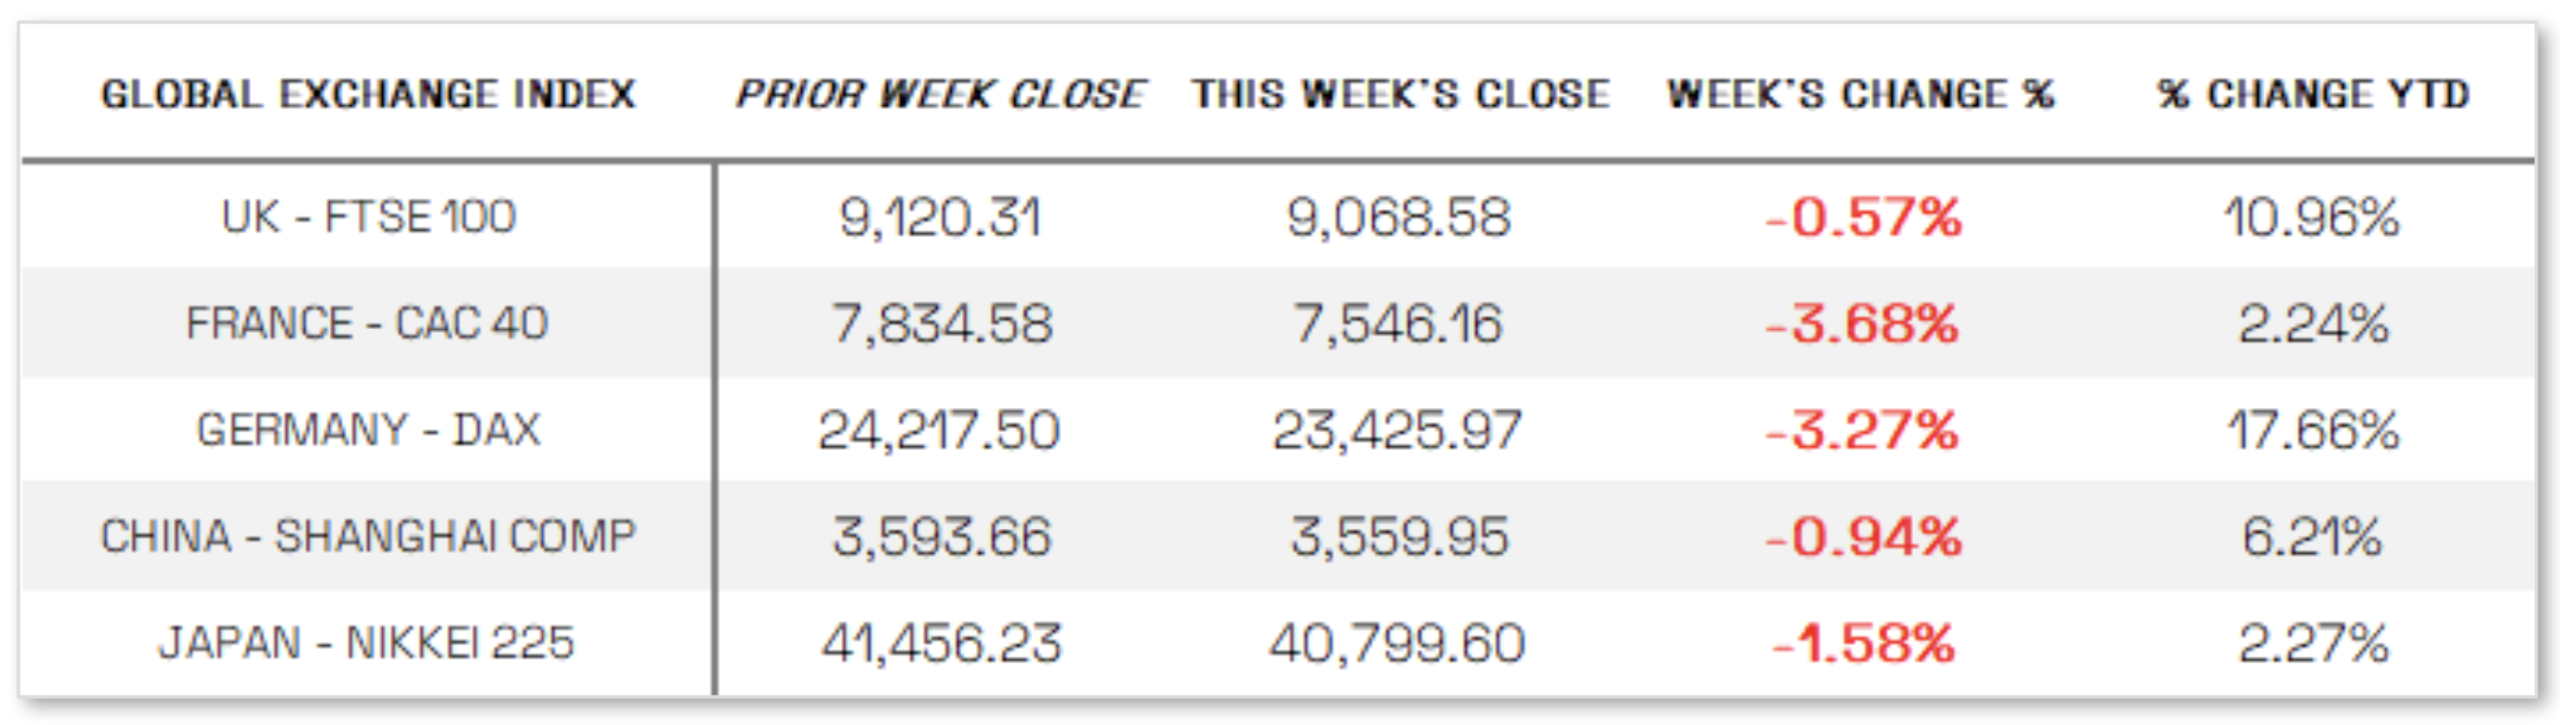
EUROPE: The pan-European STOXX Europe 600 Index fell 2.57% in local currency terms, pressured by disappointment over the U.S.-EU framework trade deal, with major national indexes also retreating—France’s CAC 40 dropped 3.68%, Germany’s DAX slid 3.27%, and Italy’s FTSE MIB declined 1.92%. The UK’s FTSE 100 dipped a more modest 0.57%, cushioned in part by a weakening pound, which benefits the index’s multinational-heavy composition due to increased overseas revenue. Meanwhile, eurozone economic data showed resilience but continued stagnation, easing pressure on the European Central Bank to cut rates further. Headline inflation remained at 2.0% in July—matching the ECB’s target and slightly above expectations—while core inflation held at 2.3%. Second-quarter GDP grew 0.1% from the prior quarter, below the 0.6% gain in Q1 but ahead of flat growth projections, and year-over-year output rose 1.4%, narrowly missing last year’s 1.5% but beating forecasts of 1.3%.
JAPAN: Japan’s stock markets declined over the week, with the Nikkei 225 falling 1.58% and the TOPIX slipping 0.11%, as weakness in the technology sector due to disappointing earnings and renewed global trade tensions dampened investor sentiment. The yield on the 10-year Japanese government bond declined to 1.55% from 1.59% the previous week. Meanwhile, the yen weakened beyond JPY 150 per U.S. dollar—its lowest in four months—prompting Finance Minister Katsunobu Kato to voice concern over speculative currency movements and emphasize the need for exchange rate stability. At its July 30–31 policy meeting, the Bank of Japan held its key interest rate steady at 0.5%, as expected, but raised its inflation outlook in its quarterly report, now projecting core CPI to rise 2.7% in fiscal 2025, up from the previous 2.2% forecast, citing persistent food price pressures. The central bank also slightly increased its inflation forecasts for fiscal 2026 and 2027 and now expects real GDP to grow 0.6% in fiscal 2025, up from its earlier estimate of 0.5%.
CHINA: Mainland Chinese stock markets fell as new U.S. tariff rates dimmed the global growth outlook and fresh data signaled a slowdown in China’s economy, with the CSI 300 Index down 1.75% and the Shanghai Composite declining 0.94% in local currency terms, according to FactSet, while Hong Kong’s Hang Seng Index dropped 3.47%. The S&P Global manufacturing PMI for China fell to 49.5 in July—below the 50 mark that signals contraction and down from June’s 50.4—missing expectations and following the official PMI reading of 49.3, a three-month low that also disappointed forecasts. China’s statistics bureau attributed the weakness to extreme weather conditions, including heatwaves, heavy rains, and flooding that disrupted manufacturing activity. The disappointing PMI data reinforced concerns that China’s economy may face slower growth ahead, as domestic demand remains soft and global trade uncertainty lingers. While the economy showed resilience in the first half of the year, supported by front-loaded exports, shipments to non-U.S. markets, and fiscal stimulus, many economists now expect momentum to ease as these temporary boosts wane.
Sources:
>> All index and returns data from Norgate Data and Commodity Systems Incorporated and Wall Street Journal.
>> News from Reuters, Barron’s, Wall St. Journal, Bloomberg.com, ft.com, guggenheimpartners.com, zerohedge.com, ritholtz.com, markit.com, financialpost.com, Eurostat, Statistics Canada, Yahoo! Finance, stocksandnews.com, marketwatch.com, visualcapitalist.com, wantchinatimes.com, BBC, 361capital.com, pensionpartners.com, cnbc.com, FactSet, Morningstar/Ibbotson Associates, Corporate Finance Institute.
>> Commentary from T Rowe Price Global markets weekly update — https://www.troweprice.com/personal-investing/resources/insights/global-markets-weekly-update.html
Disclosures: This material and any mention of specific investments is provided for informational purposes only and is not intended to be investment advice or a recommendation to take any action. The forecasts or forward-looking statements are based on assumptions, may not materialize, and are subject to revision without notice. The market indexes discussed are unmanaged, and generally, considered representative of their respective markets. Index performance is not indicative of the past performance of a particular investment. Indexes do not incur management fees, costs, and expenses. Individuals cannot directly invest in unmanaged indexes. Past performance does not guarantee future results.
