


THE COMPLETE PICTURE
>> Four indicators across three time frames.
>> When the Sherman Portfolios indicators are positive status, we read the market as being in a Bull Market.
1. DELTA-V — Positive since June 27, 2025
2. GALACTIC SHIELD — Positive since April 1, 2023
3. STARFLUX — Positive since May 12, 2025
4. STARPATH — Positive since May 14, 2025
The shorter term picture:
>> GALACTIC SHIELD — POSITIVE for Q2 2025, This indicator is based on the combination of U.S. and International Equities trend statuses at the start of each quarter.
>> STARFLUX — POSITIVE, Starflux ended the week at 12.03 (Up 2.56% last week) This short-term indicator measures U.S. Equities.
>> STARPATH — POSITIVE, This indicator measures the interplay on dual timeframes of our Type 1s + the Russell 3000 + our four most ‘pro-cyclical’ Type 3s, vs. Cash.
The big picture:
The ‘big picture’ is the (typically) years-long timeframe, the same timeframe in which Cyclical Bulls and Bears operate.
>> The Sherman Portfolios DELTA-V Indicator measuring the Bull/Bear cycle finished the week in Bull status at 56.74, up 4.74% from the prior week’s 54.31. It has signaled Bull since June 27, 2025.
>> The Sherman Portfolios DELTA-V Bond Indicator measuring the Bull/Bear cycle finished the week in BULL status at 57.91, up 4.59% from the prior week’s 55.37. It has signaled Bull since December 15, 2023.
The very big picture (a historical perspective): The CAPE is now at 37.65.
The cyclically adjusted price-to-earnings ratio (CAPE) can be used to smooth out the shorter-term earnings swings to get a longer-term assessment of market valuation. An extremely high CAPE ratio means that a company’s stock price is substantially higher than the company’s earnings would indicate and, therefore, overvalued. It is generally expected that the market will eventually correct the company’s stock price by pushing it down to its true value.
In the past, the CAPE ratio has proved its importance in identifying potential bubbles and market crashes. The historical average of the ratio for the S&P 500 Index is between 15-16, while the highest levels of the ratio have exceeded 30. The record-high levels occurred three times in the history of the U.S. financial markets. The first was in 1929 before the Wall Street crash that signaled the start of the Great Depression. The second was in the late 1990s before the Dotcom Crash, and the third came in 2007 before the 2007-2008 Financial Crisis. https://www.multpl.com/shiller-pe
 Note: We do not use CAPE as an official input into our methods. However, we think history serves as a guide and that it’s good to know where we are on the historic continuum.
THIS WEEK IN THE MARKETS
U.S. Markets:
Stocks hit all-time highs:
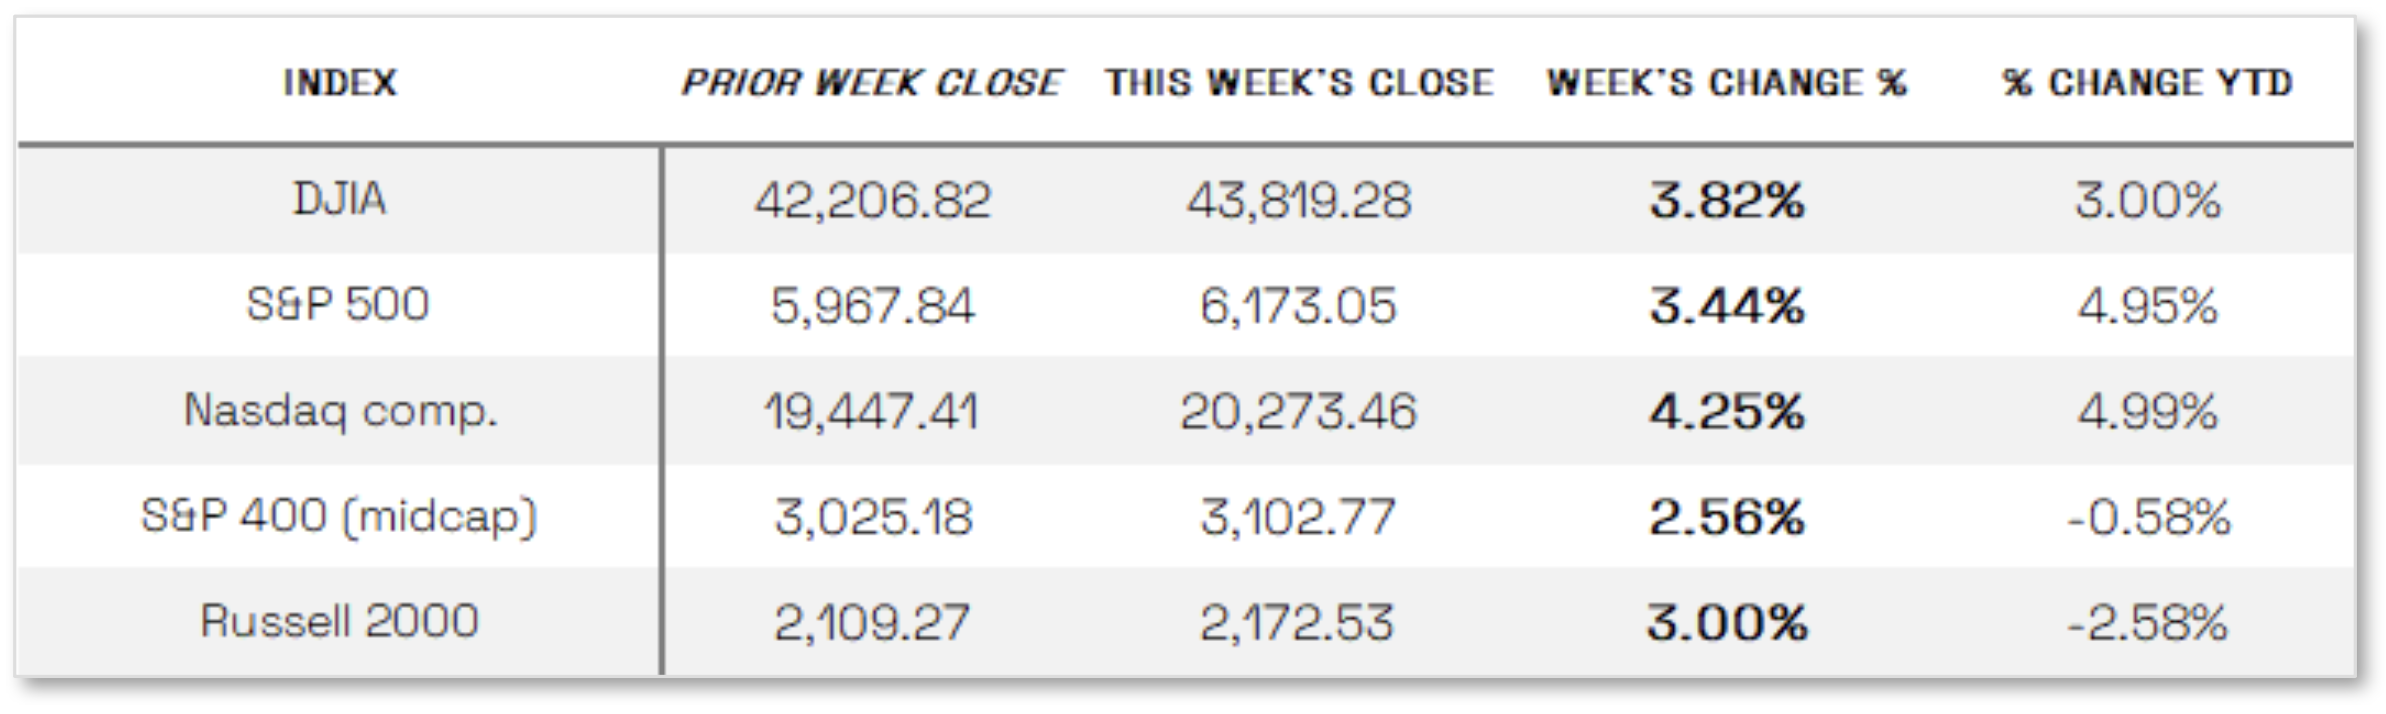
Stocks surged over the week, with the S&P 500 Index and Nasdaq Composite climbing 3.44% and 4.25%, respectively, to close at record highs, driven by positive developments such as easing tensions in the Middle East, dovish remarks from Federal Reserve officials, reports of a new U.S.-China trade deal, and signals from U.S. government officials that additional agreements were nearing completion; meanwhile, the Dow Jones Industrial Average, S&P MidCap 400 Index, and Russell 2000 Index each rose more than 2.5%. U.S. Treasuries also posted positive returns as yields fell in response to softer-than-expected economic data and comments from Fed officials suggesting rate cuts could come sooner than anticipated, with the probability of a rate cut in July rising from 14.5% the previous week to around 19% by Friday afternoon, according to the CME FedWatch Tool.
Looking at the US Indexes:
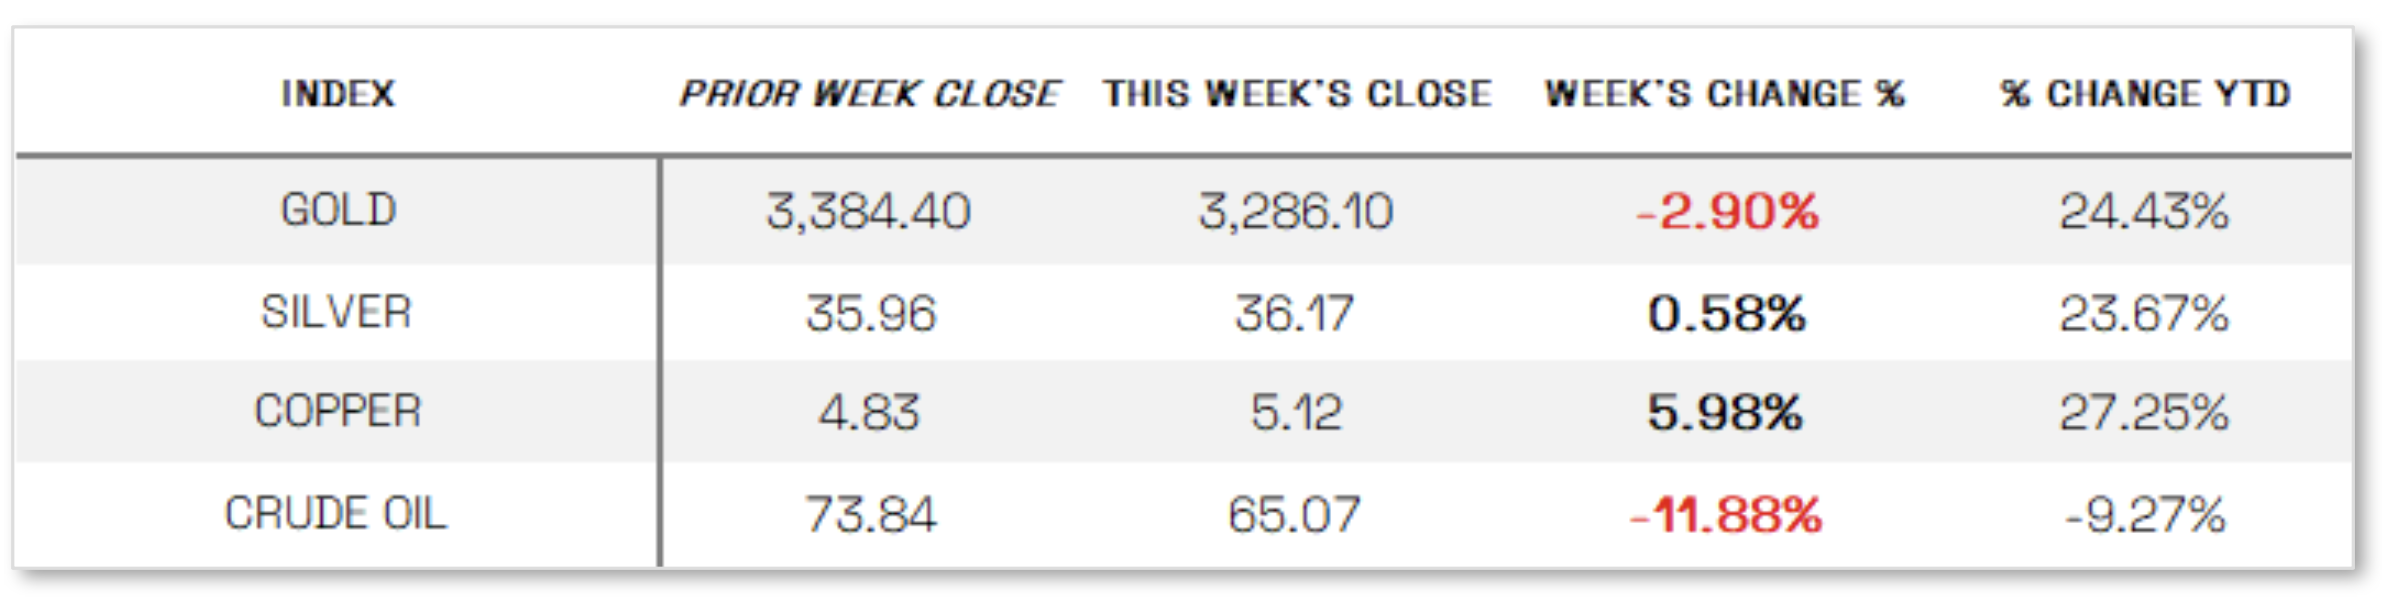
U.S. Commodities/Futures:
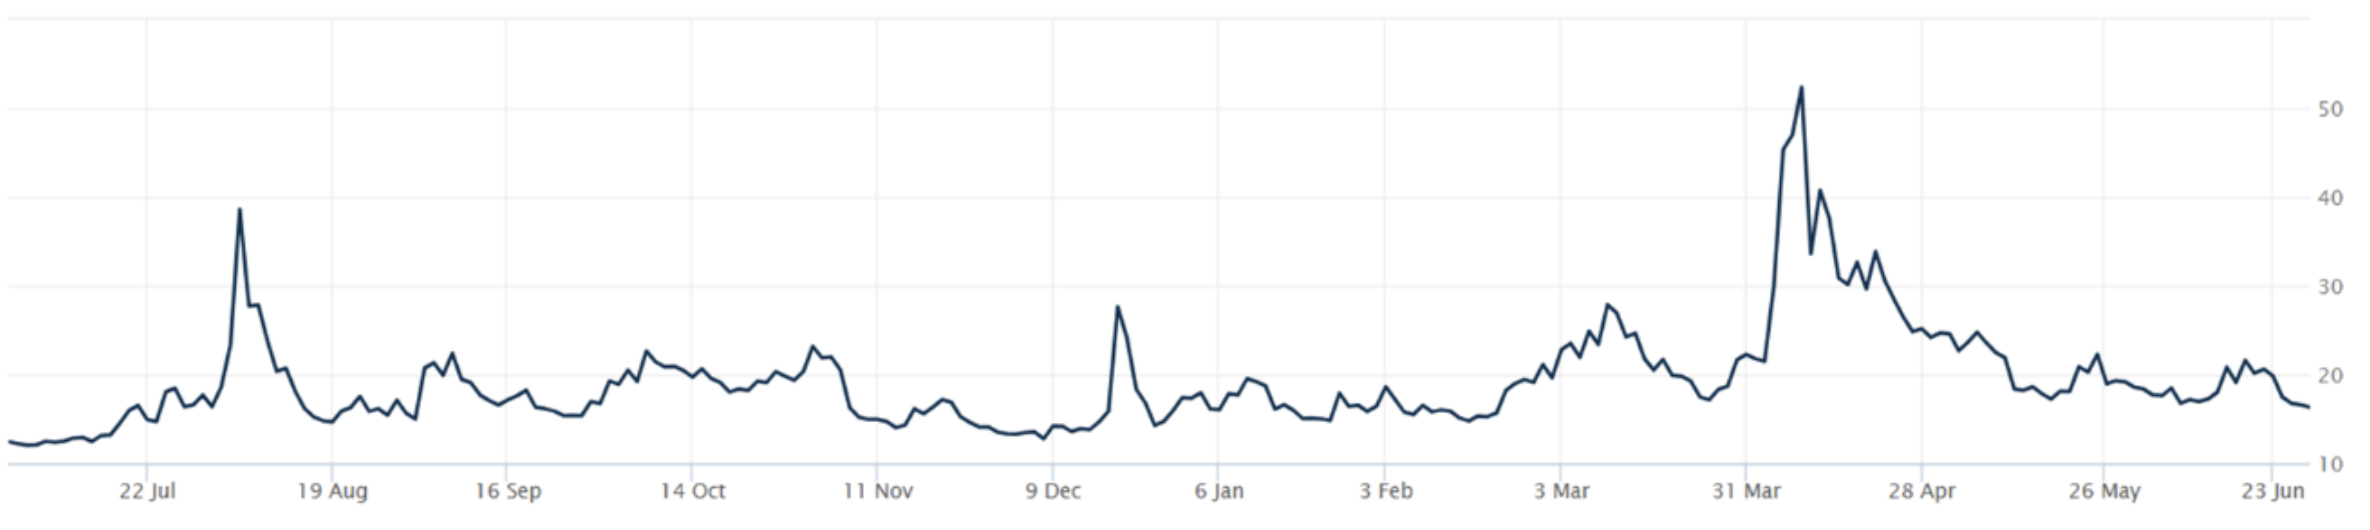
THE VOLATILITY INDEX (VIX) closed at 16.32 this week, a 20.9% decrease vs last week’s close of 20.62.
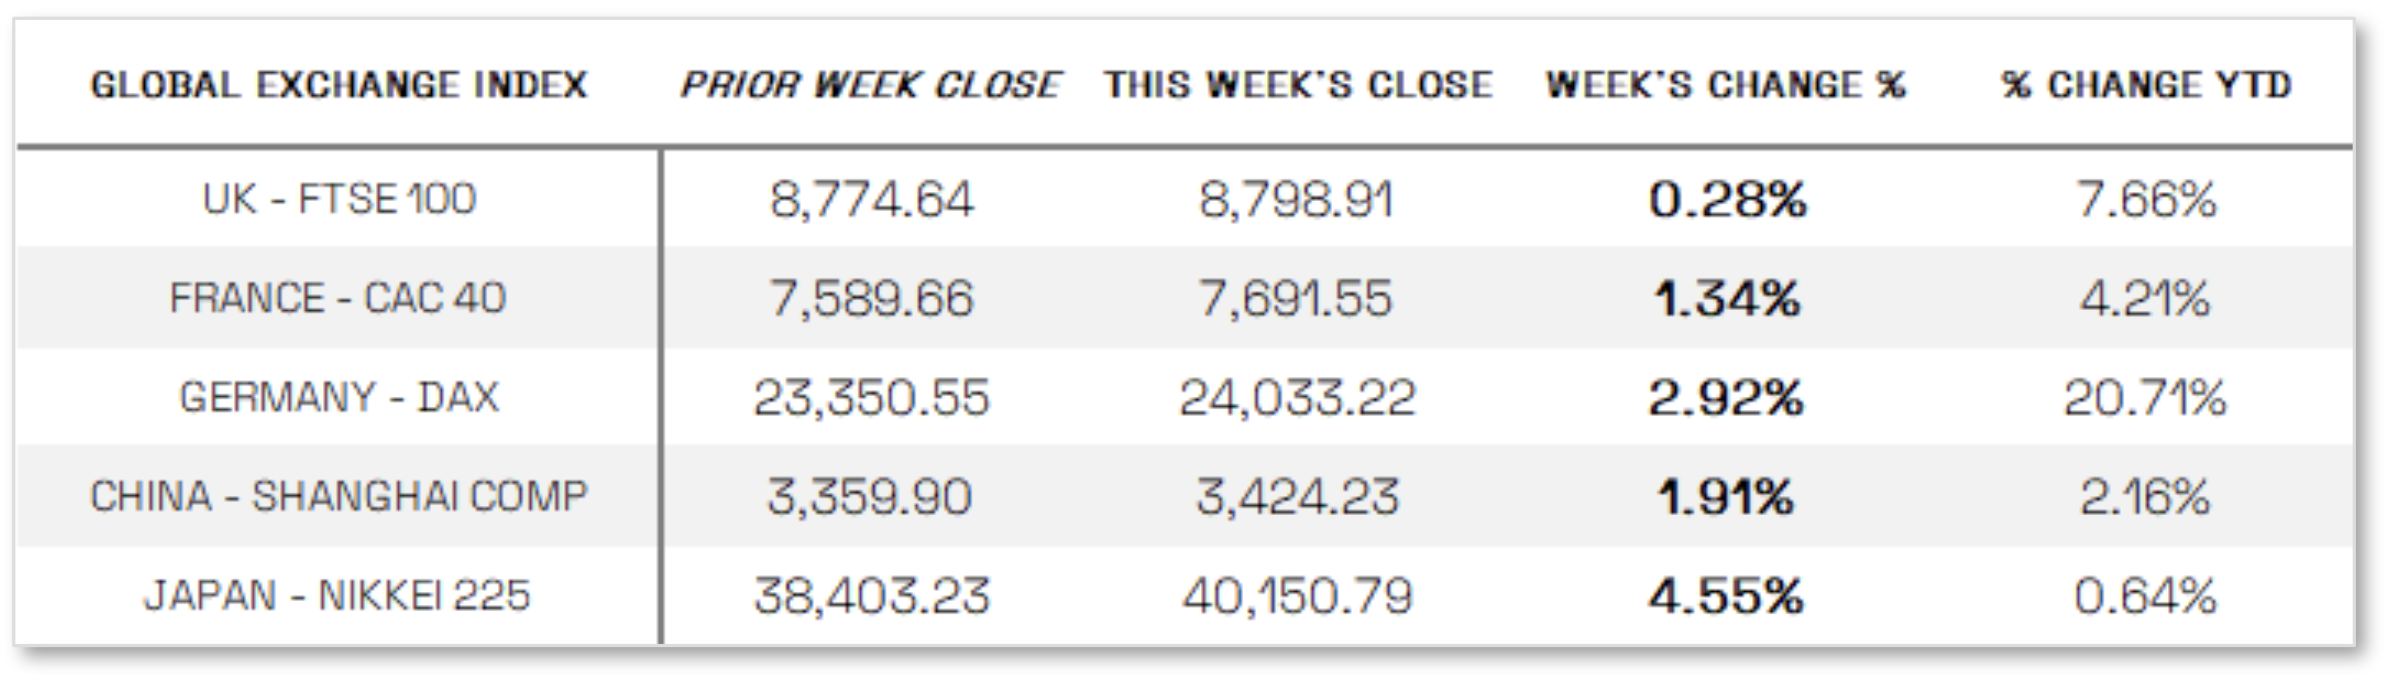
International Markets:
THIS WEEK’S ECONOMIC NEWS
U.S. Economic News:
Slight increase in inflation, while business grows: Inflation edged slightly higher in May, with the Bureau of Economic Analysis’ personal consumption expenditures (PCE) price index—considered the Fed’s preferred inflation gauge—showing core PCE rose 0.2% month over month and 2.7% year over year, both just above expectations and up from April’s 0.1% and 2.6% readings; the headline index matched forecasts with a 0.1% monthly and 2.3% annual increase, while personal income and spending unexpectedly declined despite estimates for modest gains. Meanwhile, the University of Michigan’s final June Index of Consumer Sentiment showed consumer expectations for year-ahead inflation fell sharply from 6.6% in May to 5% in June, with the sentiment index itself climbing 16% to 60.7 as concerns over tariff-related inflation eased. In business activity, S&P Global reported that U.S. growth continued at a modest pace in June, with the Flash U.S. Composite Output PMI dipping slightly to 52.8 from May’s 53.0, supported by the first increase in manufacturing output since February despite a slight slowdown in services, while inflationary pressures persisted with costs rising at the second-fastest pace since early 2023, largely attributed to tariffs.
International Economic News:
EUROPE: In local currency terms, the pan-European STOXX Europe 600 Index rose 1.32% as a ceasefire between Israel and Iran appeared to hold and fears of an extended trade conflict subsided, while prospects for German economic stimulus and increased NATO military spending also supported equities; Germany’s DAX surged 2.92%, France’s CAC 40 Index gained 1.34%, Italy’s FTSE MIB advanced 1.30%, and the UK’s FTSE 100 Index edged up 0.28%. Meanwhile, June purchasing managers’ surveys signaled the eurozone economy remained sluggish, with the preliminary HCOB Eurozone Composite PMI holding steady at 50.2—barely indicating expansion—as services activity improved slightly, German output rebounded from a five-month low to show modest growth, but France’s economy continued to struggle with its composite PMI staying in contractionary territory for a 10th consecutive month.
JAPAN: Japan’s stock markets posted strong gains over the week, with the Nikkei 225 Index climbing 4.55% and the broader TOPIX Index rising 2.50%, driven by solid advances in technology stocks and improved investor risk appetite amid easing fears of a global trade war and signs that the Iran-Israel ceasefire was holding. Meanwhile, the yield on the 10-year Japanese government bond stayed around the low 1.4% range as the Bank of Japan maintained its cautious approach to monetary policy normalization, while the yen strengthened to approximately JPY 144 per U.S. dollar from about JPY 146 the week before. In inflation data, the Tokyo-area core consumer price index, a leading indicator for national trends, rose 3.1% year over year in June—below the 3.3% consensus and down from May’s 3.6%—as renewed government subsidies helped moderate price increases, though inflation remains well above the BoJ’s 2% target, bolstering expectations for further interest rate hikes.
CHINA: Mainland Chinese stock markets advanced after news that the U.S. and China had finalized a trade understanding reached in Geneva last month, with the onshore CSI 300 Index rising 1.95% and the Shanghai Composite Index gaining 1.91% in local currency terms, while Hong Kong’s Hang Seng Index rallied 3.2%, according to FactSet. The framework, announced Thursday by U.S. Commerce Secretary Howard Lutnick, temporarily eased trade tensions, and Beijing confirmed parts of the accord on Friday, which reportedly included China’s pledge to supply rare earths, though details were sparse and key issues like fentanyl trafficking were not addressed. Economically, the People’s Bank of China noted signs of improving confidence but highlighted weak domestic demand and ongoing deflationary pressures, stating after its quarterly policy meeting that it would maintain a flexible, “moderately loose” monetary policy aimed at sustaining stable growth and keeping prices within a reasonable range.
Sources:
>> All index and returns data from Norgate Data and Commodity Systems Incorporated and Wall Street Journal.
>> News from Reuters, Barron’s, Wall St. Journal, Bloomberg.com, ft.com, guggenheimpartners.com, zerohedge.com, ritholtz.com, markit.com, financialpost.com, Eurostat, Statistics Canada, Yahoo! Finance, stocksandnews.com, marketwatch.com, visualcapitalist.com, wantchinatimes.com, BBC, 361capital.com, pensionpartners.com, cnbc.com, FactSet, Morningstar/Ibbotson Associates, Corporate Finance Institute.
>> Commentary from T Rowe Price Global markets weekly update — https://www.troweprice.com/personal-investing/resources/insights/global-markets-weekly-update.html
Disclosures: This material and any mention of specific investments is provided for informational purposes only and is not intended to be investment advice or a recommendation to take any action. The forecasts or forward-looking statements are based on assumptions, may not materialize, and are subject to revision without notice. The market indexes discussed are unmanaged, and generally, considered representative of their respective markets. Index performance is not indicative of the past performance of a particular investment. Indexes do not incur management fees, costs, and expenses. Individuals cannot directly invest in unmanaged indexes. Past performance does not guarantee future results.
