


THE COMPLETE PICTURE
>> Four indicators across three time frames.
>> When the Sherman Portfolios indicators are not all the same status, we read the market as being in a Mixed Market.
1. DELTA-V — Negative since April 4, 2025
2. GALACTIC SHIELD — Positive since April 1, 2023
3. STARFLUX— Positive since May 12, 2025
4. STARPATH — Positive since May 14, 2025
The shorter term picture:
>> GALACTIC SHIELD — POSITIVE for Q2 2025, This indicator is based on the combination of U.S. and International Equities trend statuses at the start of each quarter.
>> STARFLUX — POSITIVE, Starflux ended the week at 11.73 (Down 0.93% last week) This short-term indicator measures U.S. Equities.
>> STARPATH — POSITIVE, This indicator measures the interplay on dual timeframes of our Type 1s + the Russell 3000 + our four most ‘pro-cyclical’ Type 3s, vs. Cash.
The big picture:
The ‘big picture’ is the (typically) years-long timeframe, the same timeframe in which Cyclical Bulls and Bears operate.
>> The Sherman Portfolios DELTA-V Indicator measuring the Bull/Bear cycle finished the week in BEAR status at 54.31, up 0.89% from the prior week’s 53.83. It has signaled Bear since April 4, 2025.
>> The Sherman Portfolios DELTA-V Bond Indicator measuring the Bull/Bear cycle finished the week in BULL status at 55.37, up 1.99% from the prior week’s 54.29. It has signaled Bull since December 15, 2023.
The very big picture (a historical perspective): The CAPE is now at 36.35.
The cyclically adjusted price-to-earnings ratio (CAPE) can be used to smooth out the shorter-term earnings swings to get a longer-term assessment of market valuation. An extremely high CAPE ratio means that a company’s stock price is substantially higher than the company’s earnings would indicate and, therefore, overvalued. It is generally expected that the market will eventually correct the company’s stock price by pushing it down to its true value.
In the past, the CAPE ratio has proved its importance in identifying potential bubbles and market crashes. The historical average of the ratio for the S&P 500 Index is between 15-16, while the highest levels of the ratio have exceeded 30. The record-high levels occurred three times in the history of the U.S. financial markets. The first was in 1929 before the Wall Street crash that signaled the start of the Great Depression. The second was in the late 1990s before the Dotcom Crash, and the third came in 2007 before the 2007-2008 Financial Crisis. https://www.multpl.com/shiller-pe
 Note: We do not use CAPE as an official input into our methods. However, we think history serves as a guide and that it’s good to know where we are on the historic continuum.
THIS WEEK IN THE MARKETS
U.S. Markets:
Stocks mixed this week:
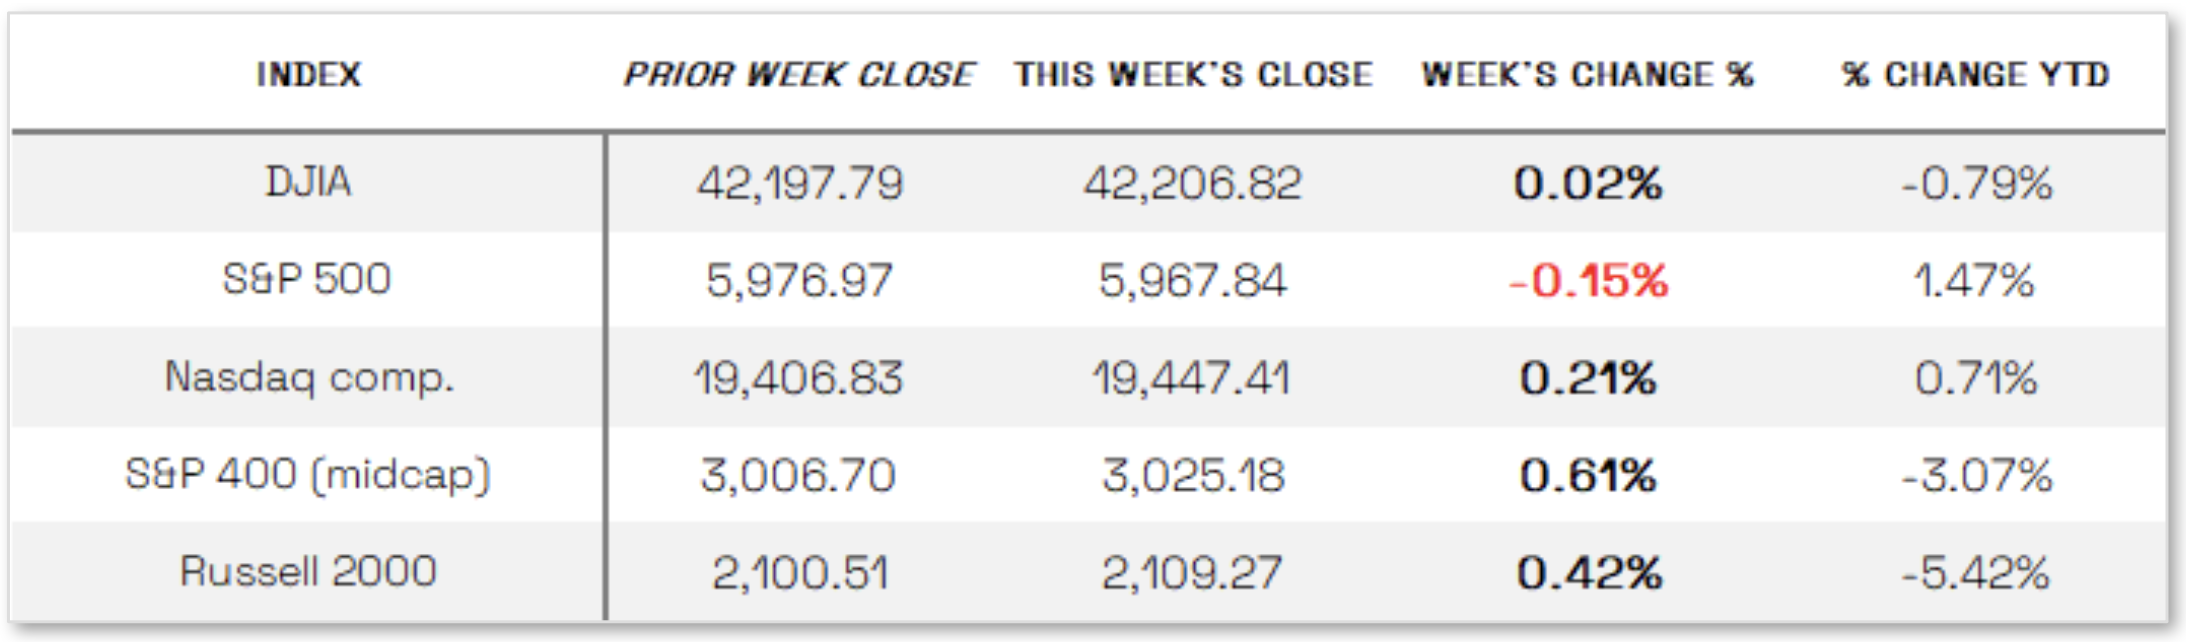
U.S. stocks ended a holiday-shortened week with mixed results as markets reacted to ongoing geopolitical tensions in the Middle East and a series of related headlines. A key development came Thursday when President Donald Trump suggested a “substantial chance of negotiations” with Iran, which helped lift stocks on Friday. Smaller-cap indexes led performance, followed by modest gains in the Nasdaq Composite, while the Dow Jones Industrial Average remained flat and the S&P 500 posted a slight decline. Markets were closed Thursday in observance of Juneteenth. U.S. Treasuries gained as yields fell across most maturities due to heightened geopolitical concerns and economic data, with investment-grade corporate bonds also advancing and new issuance generally oversubscribed. In contrast, the high yield bond market saw softer sentiment and increased volatility amid macroeconomic uncertainty, though the issuance calendar remained active ahead of the holiday.
Looking at the US Indexes:
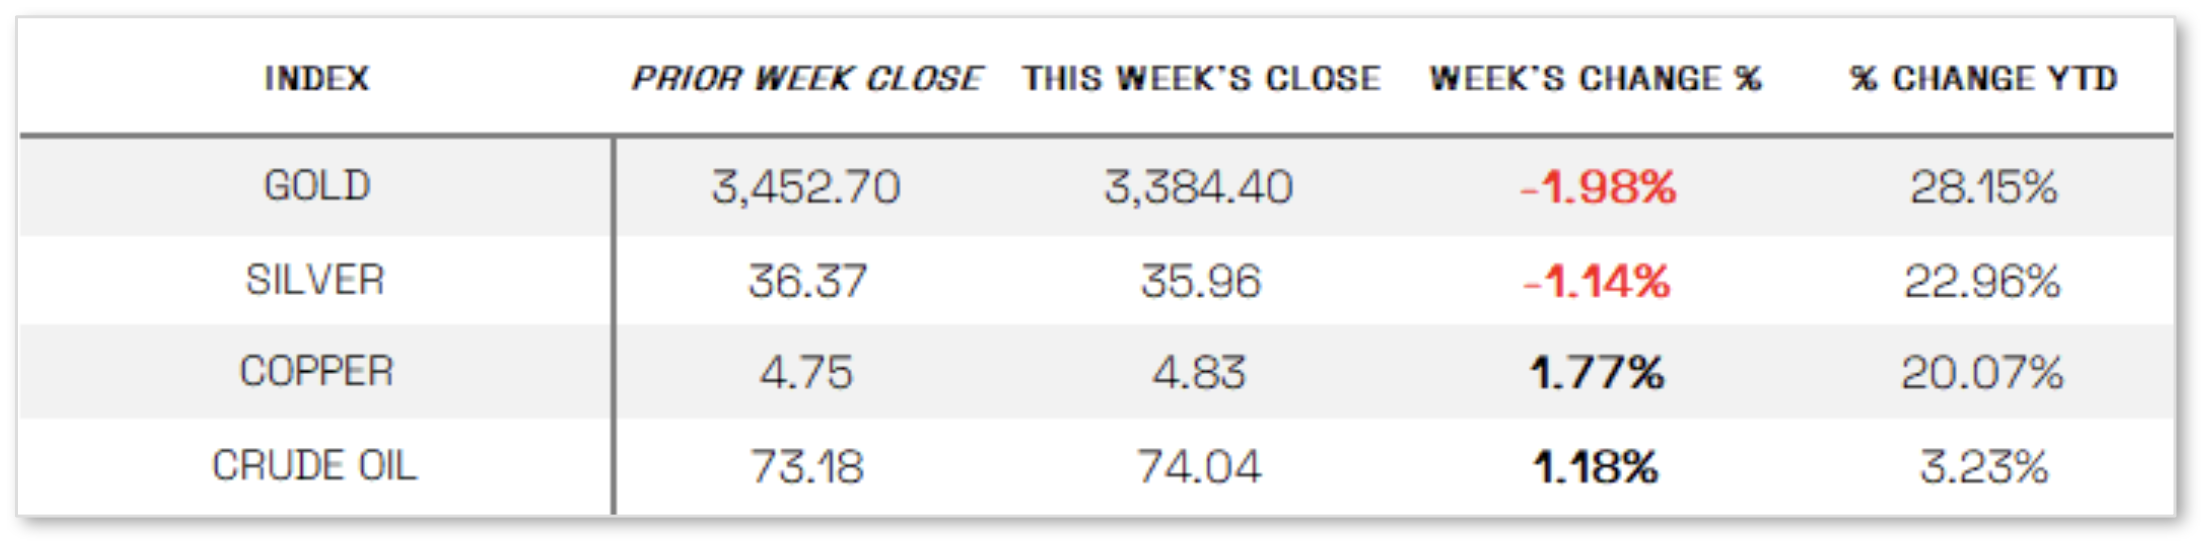
U.S. Commodities/Futures:
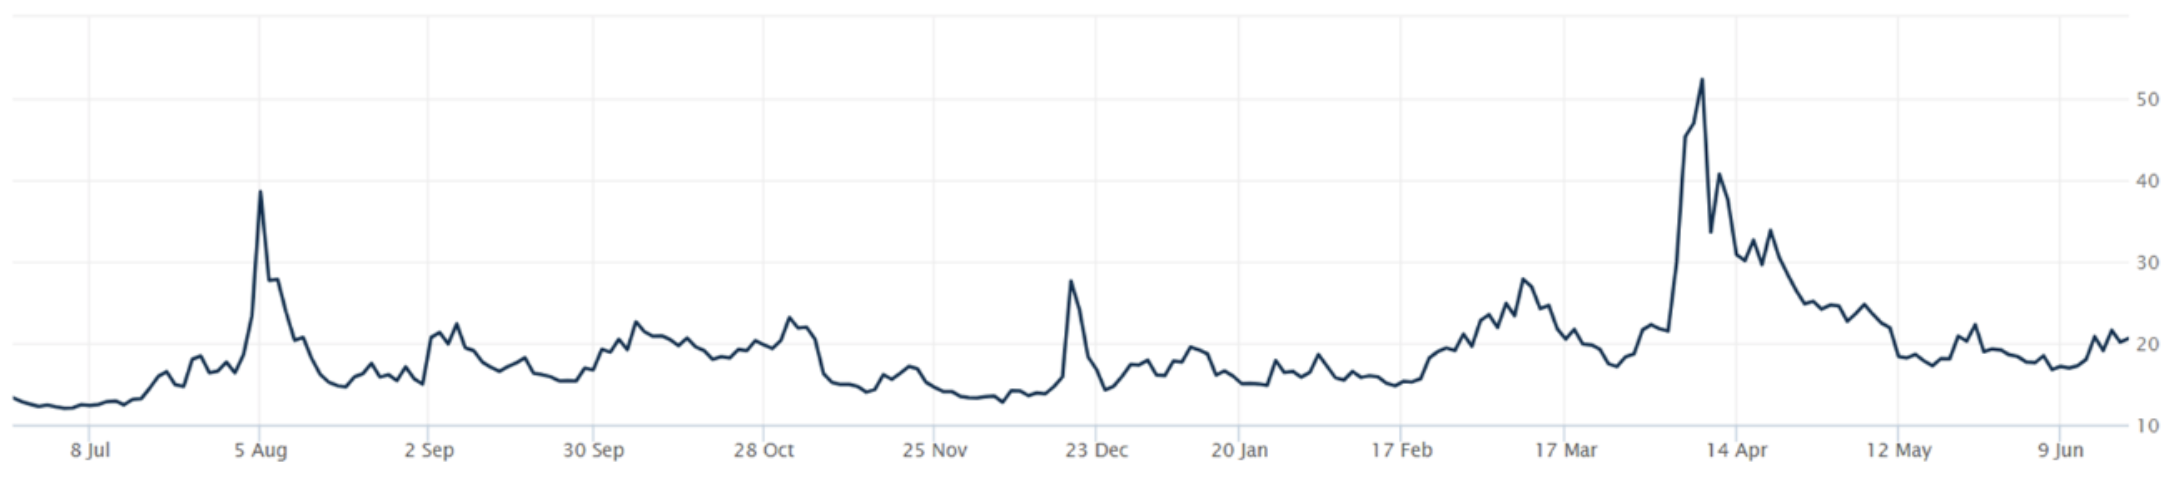
THE VOLATILITY INDEX (VIX) closed at 20.62 this week, a 1.0% decrease vs last week’s close of 20.82.
International Markets:
THIS WEEK’S ECONOMIC NEWS
U.S. Economic News:
No change in Fed rates: The Federal Reserve left interest rates unchanged at 4.25% to 4.5% following its June policy meeting, marking the fourth straight meeting with no change, and noted that while uncertainty has diminished, it remains elevated. Fed Chair Jerome Powell emphasized that the economy is in a solid position and the Fed is prepared to respond to future developments. The Fed’s updated Summary of Economic Projections maintained expectations for two rate cuts later this year but reflected rising forecasts for inflation and unemployment by the end of 2025, along with a downward revision to GDP growth. Comments from Fed Governor Christopher Waller on Friday suggested rate cuts could begin as early as July, offering some early support to equity markets. Meanwhile, economic data released during the week was generally weaker than expected, with May retail sales falling 0.9%, driven by a sharp drop in auto sales, though core retail sales rose 0.4% on strength in sporting goods and furniture. In housing, the NAHB’s Home Builders Index dropped to 32 in June—its lowest since December 2022—indicating worsening sentiment amid high mortgage rates and economic uncertainty, while housing starts plunged 9.8% to a five-year low of 1.26 million annualized units in May.
International Economic News:
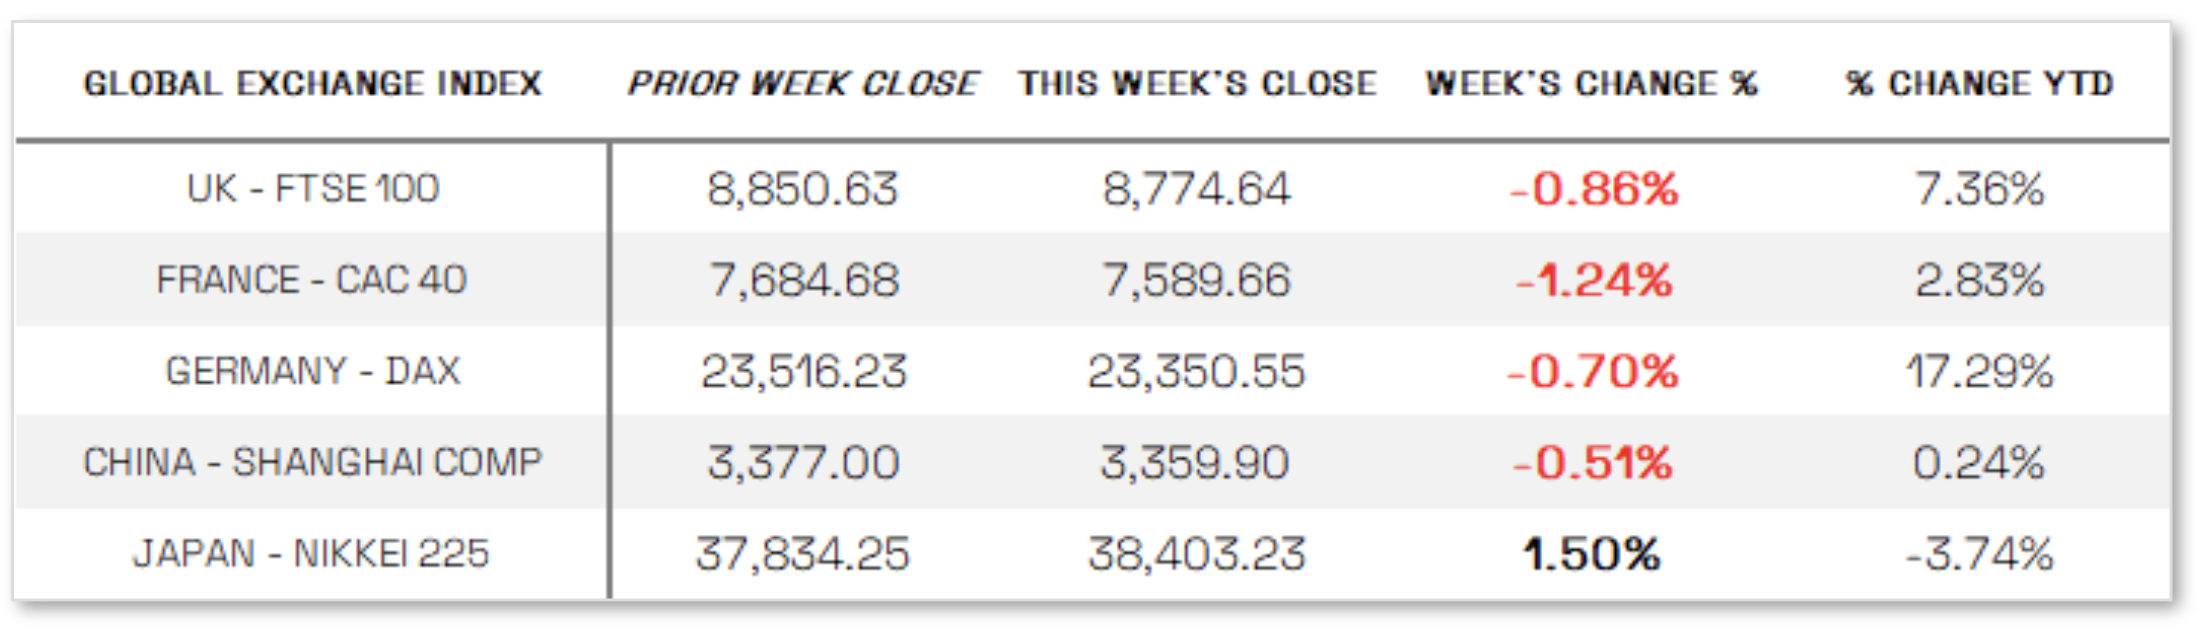
EUROPE: European markets declined, with the pan-European STOXX Europe 600 Index falling 1.54% amid concerns over Middle East tensions; Italy’s FTSE MIB dropped 0.53%, Germany’s DAX fell 0.70%, France’s CAC 40 lost 1.24%, and the UK’s FTSE 100 slipped 0.86%. The Bank of England held interest rates steady at 4.25% amid global uncertainty and persistent inflation, though Governor Andrew Bailey indicated a gradual downward path for rates; inflation eased slightly in May to 3.4%, with services inflation falling to 4.7%. Meanwhile, the Swiss National Bank cut rates to 0% to counter low inflation and a strong franc, and Norges Bank unexpectedly lowered its key rate to 4.25%, the first cut in five years. In Germany, investor sentiment surged, with ZEW’s index jumping to 47.5 in June following a major tax relief package, while in France, manufacturing confidence slipped further below average, with INSEE projecting flat output and modest 0.2% GDP growth through the year’s remaining quarters.
JAPAN: Japan’s stock markets advanced over the week, with the Nikkei 225 rising 1.50% and the TOPIX up 0.54%, while the yen weakened to the lower end of the JPY 145 range against the U.S. dollar. Despite rising Middle East tensions, attention centered on the Bank of Japan’s June policy meeting, where the BoJ kept its interest rate steady at 0.5% and indicated it would slow the tapering of Japanese government bond purchases starting in April 2026 to avoid market disruption after a recent spike in yields; the 10-year JGB yield edged up to 1.42%. Some market participants continue to expect another rate hike this year. On the trade front, the U.S. and Japan failed to reach a tariff agreement at the G7 summit, with the U.S. set to raise tariffs on Japanese imports from 10% to 24% on July 9, though Japan emphasized that this date is not a firm deadline. Meanwhile, Japan’s core consumer price index rose 3.7% year-on-year in May, driven largely by rising non-fresh food prices, particularly rice, exceeding both April’s 3.5% increase and market expectations.
CHINA: Mainland Chinese stock markets declined as investors weighed mixed economic data, with the CSI 300 Index down 0.45% and the Shanghai Composite slipping 0.51%, while Hong Kong’s Hang Seng Index fell 1.52%. Although retail sales in May rose 6.4% year-on-year—the fastest pace since December 2023—industrial output and fixed-asset investment came in below expectations, and analysts cautioned that the retail boost was likely driven by short-term factors such as a government trade-in program. Meanwhile, China’s property sector remained under pressure, with new home prices in 70 cities falling 0.22% in May—the sharpest monthly decline in seven months—and used home prices dropping 0.5%, the biggest fall in eight months. These figures suggest that the effects of Beijing’s property stimulus program, launched in September, are fading, posing ongoing challenges for policymakers seeking to stimulate consumption and offset the impact of rising U.S. tariffs.
Sources:
>> All index and returns data from Norgate Data and Commodity Systems Incorporated and Wall Street Journal.
>> News from Reuters, Barron’s, Wall St. Journal, Bloomberg.com, ft.com, guggenheimpartners.com, zerohedge.com, ritholtz.com, markit.com, financialpost.com, Eurostat, Statistics Canada, Yahoo! Finance, stocksandnews.com, marketwatch.com, visualcapitalist.com, wantchinatimes.com, BBC, 361capital.com, pensionpartners.com, cnbc.com, FactSet, Morningstar/Ibbotson Associates, Corporate Finance Institute.
>> Commentary from T Rowe Price Global markets weekly update — https://www.troweprice.com/personal-investing/resources/insights/global-markets-weekly-update.html
Disclosures: This material and any mention of specific investments is provided for informational purposes only and is not intended to be investment advice or a recommendation to take any action. The forecasts or forward-looking statements are based on assumptions, may not materialize, and are subject to revision without notice. The market indexes discussed are unmanaged, and generally, considered representative of their respective markets. Index performance is not indicative of the past performance of a particular investment. Indexes do not incur management fees, costs, and expenses. Individuals cannot directly invest in unmanaged indexes. Past performance does not guarantee future results.
