


THE COMPLETE PICTURE
>> Four indicators across three time frames.
>> When the Sherman Portfolios indicators are not all the same status, we read the market as being in a Mixed Market.
1. DELTA-V — Negative since April 4, 2025
2. GALACTIC SHIELD — Positive since April 1, 2023
3. STARFLUX— Positive since May 12, 2025
4. STARPATH — Positive since May 14, 2025
The shorter term picture:
>> GALACTIC SHIELD — POSITIVE for Q2 2025, This indicator is based on the combination of U.S. and International Equities trend statuses at the start of each quarter.
>> STARFLUX — POSITIVE, Starflux ended the week at 11.84 (Down 13.26% last week). This short-term indicator measures U.S. Equities.
>> STARPATH — POSITIVE, This indicator measures the interplay on dual timeframes of our Type 1s + the Russell 3000 + our four most ‘pro-cyclical’ Type 3s, vs. Cash.
The big picture:
The ‘big picture’ is the (typically) years-long timeframe, the same timeframe in which Cyclical Bulls and Bears operate.
>> The Sherman Portfolios DELTA-V Indicator measuring the Bull/Bear cycle finished the week in BEAR status at 53.83, up 1.15% from the prior week’s 53.22. It has signaled Bear since April 4, 2025.
>> The Sherman Portfolios DELTA-V Bond Indicator measuring the Bull/Bear cycle finished the week in BULL status at 54.29, down 0.82% from the prior week’s 54.74. It has signaled Bull since December 15, 2023.
The very big picture (a historical perspective): The CAPE is now at 36.52.
The cyclically adjusted price-to-earnings ratio (CAPE) can be used to smooth out the shorter-term earnings swings to get a longer-term assessment of market valuation. An extremely high CAPE ratio means that a company’s stock price is substantially higher than the company’s earnings would indicate and, therefore, overvalued. It is generally expected that the market will eventually correct the company’s stock price by pushing it down to its true value.
In the past, the CAPE ratio has proved its importance in identifying potential bubbles and market crashes. The historical average of the ratio for the S&P 500 Index is between 15-16, while the highest levels of the ratio have exceeded 30. The record-high levels occurred three times in the history of the U.S. financial markets. The first was in 1929 before the Wall Street crash that signaled the start of the Great Depression. The second was in the late 1990s before the Dotcom Crash, and the third came in 2007 before the 2007-2008 Financial Crisis. https://www.multpl.com/shiller-pe
 Note: We do not use CAPE as an official input into our methods. However, we think history serves as a guide and that it’s good to know where we are on the historic continuum.
THIS WEEK IN THE MARKETS
U.S. Markets:
Stocks down over Middle East Tensions:
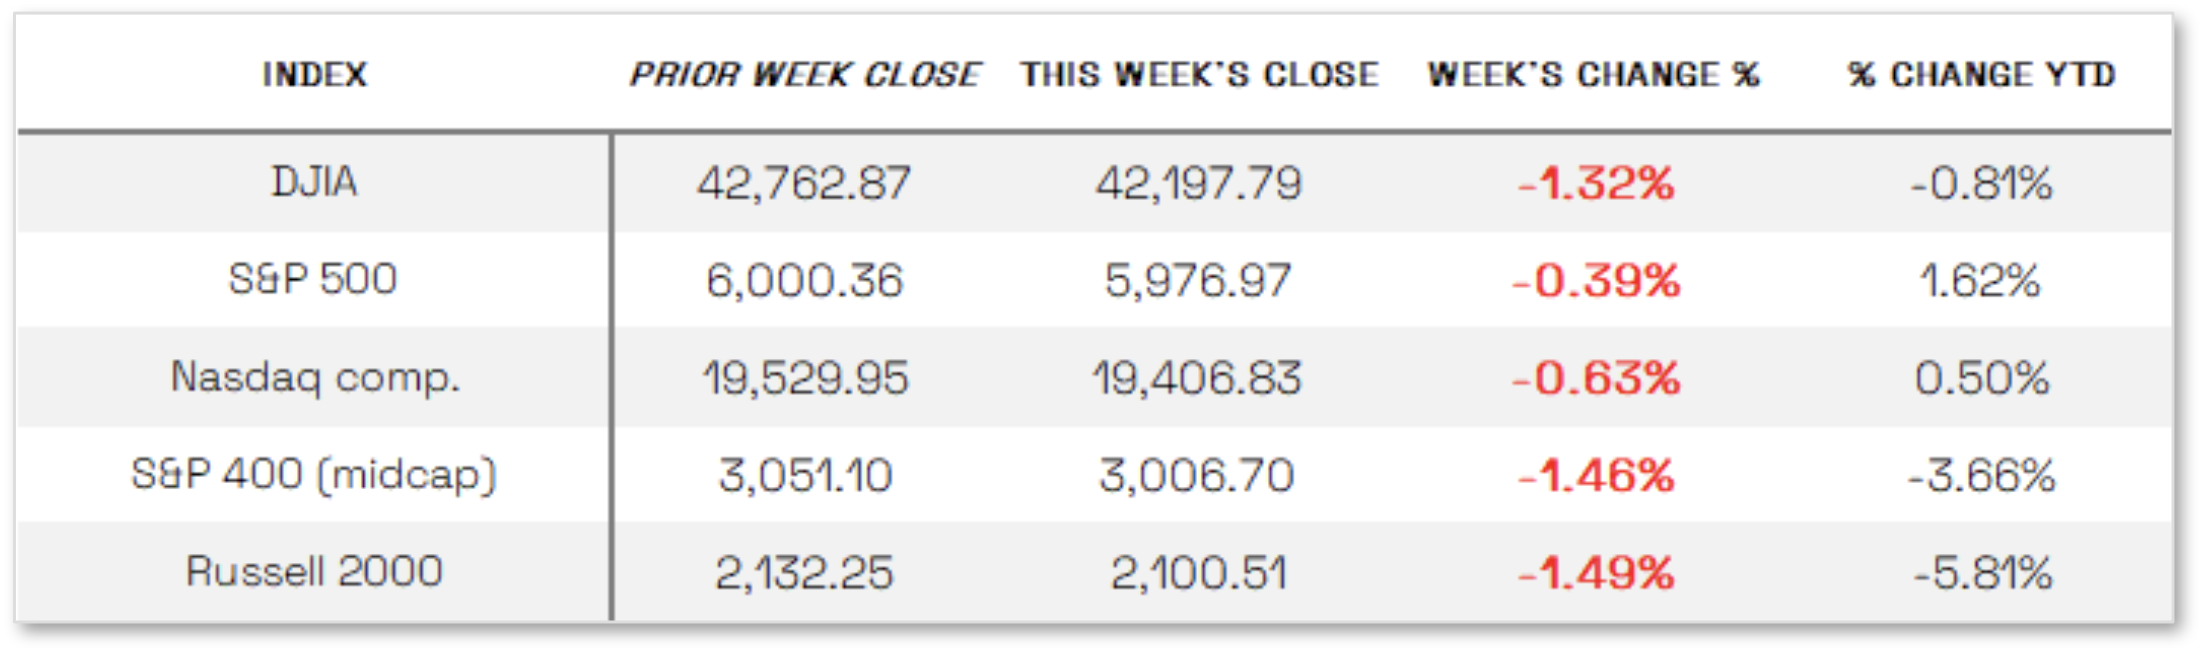
U.S. stocks reversed early gains and declined for the week amid escalating tensions in the Middle East. While markets were broadly higher through Thursday—bolstered by better-than-expected economic data and progress in U.S.-China trade talks, including the possibility of an extended tariff pause—sentiment soured on Friday following reports that Israel had launched airstrikes on Iranian nuclear facilities and military leaders, prompting a retaliatory response from Iran. This sharp escalation drove oil prices higher, lifting energy stocks but weighing heavily on broader indexes. The Dow Jones Industrial Average fell 1.32%, slipping back into negative territory for the year, while the S&P MidCap 400 and Russell 2000 dropped 1.46% and 1.49%, respectively; the S&P 500 and Nasdaq Composite declined more modestly but remained positive year-to-date.
Looking at the US Indexes:
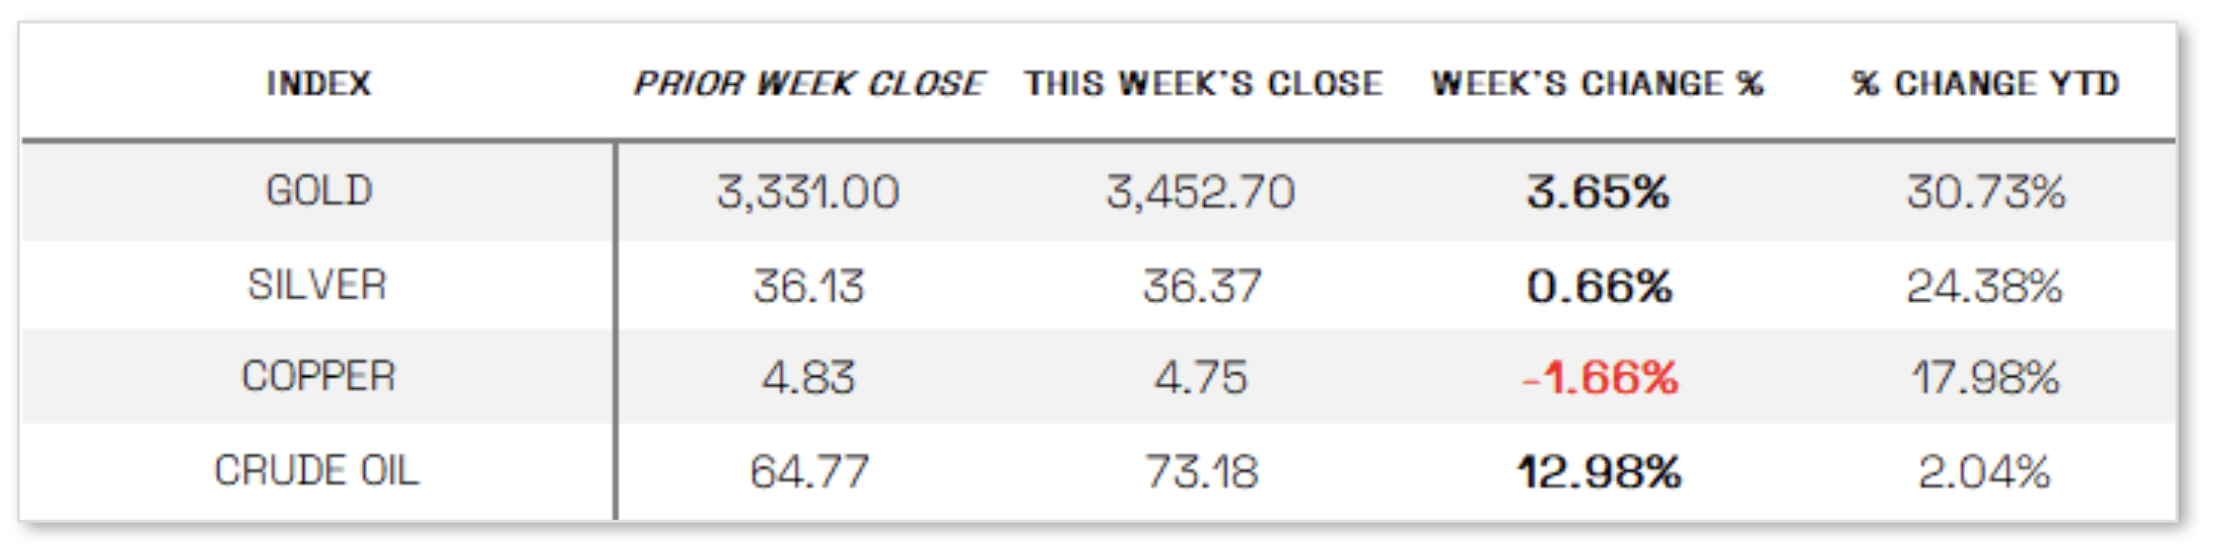
U.S. Commodities/Futures:
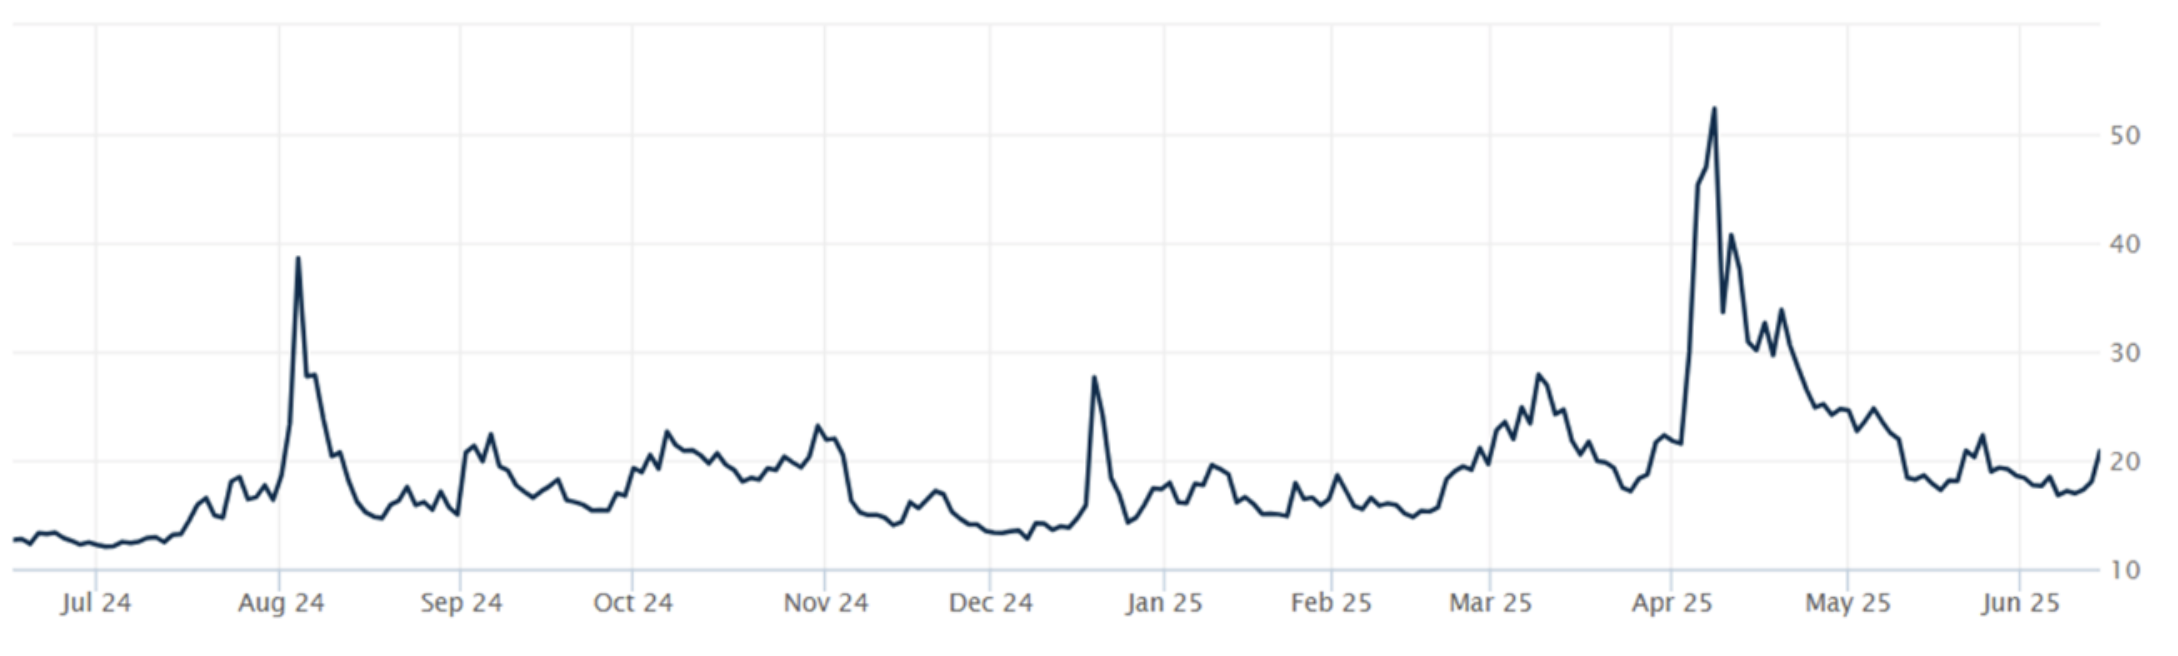
THE VOLATILITY INDEX (VIX) closed at 20.82 this week, a 24.2% increase vs last week’s close of 16.77.
International Markets:
THIS WEEK’S ECONOMIC NEWS
U.S. Economic News:
Prices rise while sentiment improves: Prices rose modestly in May, helping boost early-week market optimism alongside positive trade developments. The Bureau of Labor Statistics reported that the consumer price index (CPI) increased just 0.1% month over month—below expectations and down from April’s 0.2%—while the year-over-year rise of 2.4% remained below forecasts despite a slight uptick from April’s 2.3% low. Core CPI held steady at 2.8% annually, slightly under projections. Producer inflation also came in below expectations, with the producer price index rising 0.1%, suggesting limited pricing pressure from tariffs. Meanwhile, sentiment indicators showed signs of recovery: the NFIB small business optimism index rose to 98.8 in May after four months of decline, as owners expressed improved expectations for business conditions and sales, though uncertainty remained elevated. On the consumer side, the University of Michigan’s preliminary June sentiment reading jumped to 60.5 from 52.2 in May, breaking a six-month losing streak, with inflation expectations for the year ahead dropping sharply to 5.1% from 6.6%.
International Economic News:
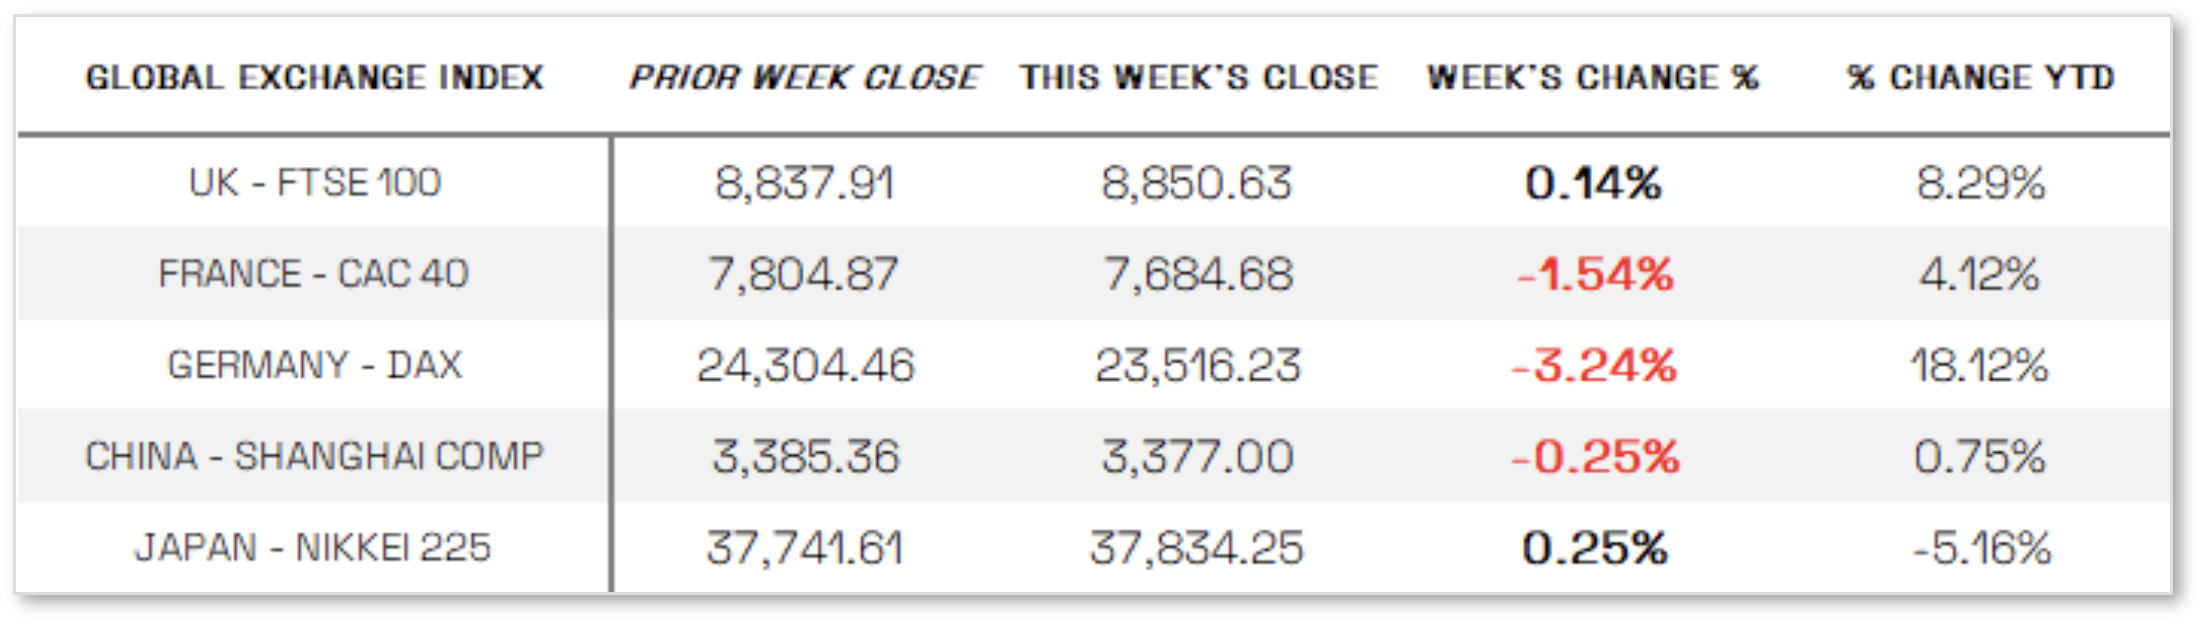
EUROPE: The pan-European STOXX Europe 600 Index fell 1.57% in local currency terms, weighed down by renewed uncertainty surrounding U.S. trade policy and escalating geopolitical tensions in the Middle East, with major national indexes also posting losses—Germany’s DAX dropped 3.24%, Italy’s FTSE MIB fell 2.86%, and France’s CAC 40 declined 1.54%, while the UK’s FTSE 100 was little changed. In the UK, the economy contracted by 0.3% in April—the sharpest monthly decline since October 2023—following a 0.2% expansion in March, driven by drops in services and production output, though GDP for the three months through April still grew 0.7%. Goods exports to the U.S. plunged by GBP 2 billion, the largest monthly decline on record since 1997. The UK labor market showed further signs of cooling as unemployment rose to a four-year high of 4.6% and private-sector pay growth slowed to 5.2%, its weakest pace since Q3 2024. In the eurozone, industrial production contracted by a sharper-than-expected 2.4% in April, while the region’s trade surplus narrowed significantly to EUR 9.9 billion from EUR 37.3 billion in March, highlighting broader economic headwinds across the bloc.
JAPAN: Amid rising geopolitical tensions in the Middle East and renewed trade-related concerns, Japan’s stock market delivered mixed results for the week, with the Nikkei 225 Index edging up 0.25% while the broader TOPIX Index declined 0.46%. A flight to safety strengthened the yen to the high end of the JPY 143 range against the U.S. dollar, up from around JPY 144.8 the prior week, pressuring Japan’s export-driven sectors. The yield on the 10-year Japanese government bond fell to 1.40% from 1.46%, as investors focused on the upcoming G7 summit, hoping it would help advance U.S.-Japan trade talks. However, Prime Minister Shigeru Ishiba cautioned against rushing a deal, stressing the importance of a mutually beneficial agreement. Revised economic data showed Japan’s GDP was flat in Q1 2025, an improvement from the initial estimate of a 0.2% contraction, with private consumption slightly exceeding expectations. Meanwhile, industrial production declined 1.1% in April, deeper than preliminary estimates and reversing March’s modest gain.
CHINA: Mainland Chinese stock markets declined over the week as deflationary pressures continued to weigh on the economy, with the CSI 300 Index and the Shanghai Composite Index both falling 0.25% in local currency terms, according to FactSet, while Hong Kong’s Hang Seng Index edged up 0.42%. China’s consumer price index declined year over year in May for the fourth consecutive month, and producer prices sank at their fastest pace in nearly two years, marking the 32nd straight month of factory deflation—signs of persistent economic weakness amid a prolonged property crisis. Despite this, Chinese stocks hit their weekly high on Wednesday following news that U.S. and Chinese officials had reached a preliminary agreement to ease trade tensions after meetings in London, though the deal remains subject to approval by both governments. Economists maintain a weak outlook for Chinese prices, even as broader near-term economic sentiment improved after May’s temporary tariff reprieve between Beijing and Washington.
Sources:
>> All index and returns data from Norgate Data and Commodity Systems Incorporated and Wall Street Journal.
>> News from Reuters, Barron’s, Wall St. Journal, Bloomberg.com, ft.com, guggenheimpartners.com, zerohedge.com, ritholtz.com, markit.com, financialpost.com, Eurostat, Statistics Canada, Yahoo! Finance, stocksandnews.com, marketwatch.com, visualcapitalist.com, wantchinatimes.com, BBC, 361capital.com, pensionpartners.com, cnbc.com, FactSet, Morningstar/Ibbotson Associates, Corporate Finance Institute.
>> Commentary from T Rowe Price Global markets weekly update — https://www.troweprice.com/personal-investing/resources/insights/global-markets-weekly-update.html
Disclosures: This material and any mention of specific investments is provided for informational purposes only and is not intended to be investment advice or a recommendation to take any action. The forecasts or forward-looking statements are based on assumptions, may not materialize, and are subject to revision without notice. The market indexes discussed are unmanaged, and generally, considered representative of their respective markets. Index performance is not indicative of the past performance of a particular investment. Indexes do not incur management fees, costs, and expenses. Individuals cannot directly invest in unmanaged indexes. Past performance does not guarantee future results.
