


THE COMPLETE PICTURE
>> Four indicators across three time frames.
>> When the Sherman Portfolios indicators are not all the same status, we read the market as being in a Mixed Market.
1. DELTA-V — Negative since April 4, 2025
2. GALACTIC SHIELD — Positive since April 1, 2023
3. STARFLUX— Positive since May 12, 2025
4. STARPATH — Positive since May 14, 2025
The shorter term picture:
>> GALACTIC SHIELD — POSITIVE, for Q2 2025, This indicator is based on the combination of U.S. and International Equities trend statuses at the start of each quarter.
>> STARFLUX — POSITIVE, Starflux ended the week at 18.41 (up 19.17 last week) This short-term indicator measures U.S. Equities.
>> STARPATH — POSITIVE, This indicator measures the interplay on dual timeframes of our Type 1s + the Russell 3000 + our four most ‘pro-cyclical’ Type 3s, vs. Cash.
The big picture:
The ‘big picture’ is the (typically) years-long timeframe, the same timeframe in which Cyclical Bulls and Bears operate.
>> The Sherman Portfolios DELTA-V Indicator measuring the Bull/Bear cycle finished the week in BEAR status at 50.45, up 5.94% from the prior week’s 47.62. It has signaled Bear since April 4, 2025.
>> The Sherman Portfolios DELTA-V Bond Indicator measuring the Bull/Bear cycle finished the week in BULL status at 55.44, down 3.73% from the prior week’s 57.59. It has signaled Bull since December 15, 2023.
THIS WEEK IN THE MARKETS
U.S. Markets:
Stocks up as Tariffs Recede:
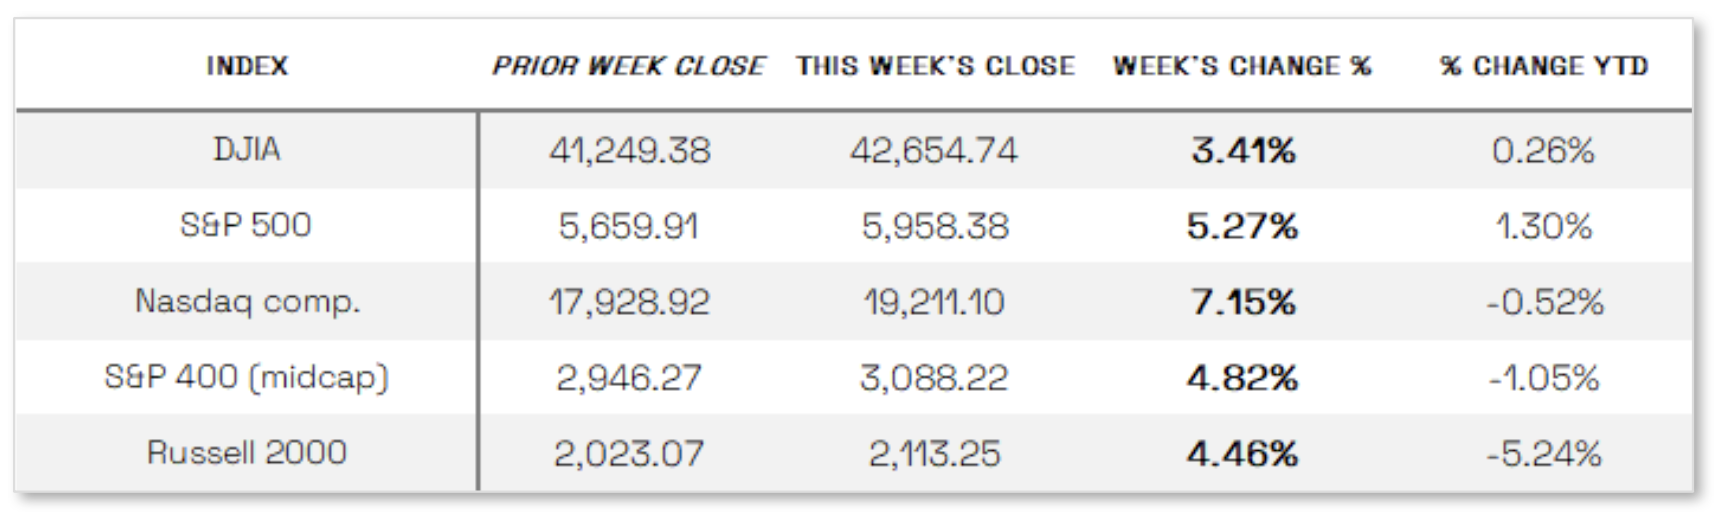
U.S. stocks rallied strongly for the week, buoyed by a significant easing of trade tensions between the U.S. and China following talks in Switzerland. The two nations agreed to suspend most recently imposed tariffs for 90 days while further negotiations continue, reducing U.S. tariffs on Chinese goods from 145% to 30% and China’s levies on U.S. imports from 125% to 10%. This development drove a wave of positive sentiment across markets, with the Nasdaq Composite leading major indexes with a 7.15% gain, followed by the S&P 500 and Dow Jones Industrial Average, which rose 5.27% and 3.41%, respectively. The S&P MidCap 400 and Russell 2000 Indexes also posted gains for a sixth consecutive week. Additional trade-related news, including a deal allowing Saudi Arabia to purchase advanced AI chips from U.S. companies, further fueled the rally, lifting most indexes above their April 2 levels by the week’s end.
Looking at the US Indexes:
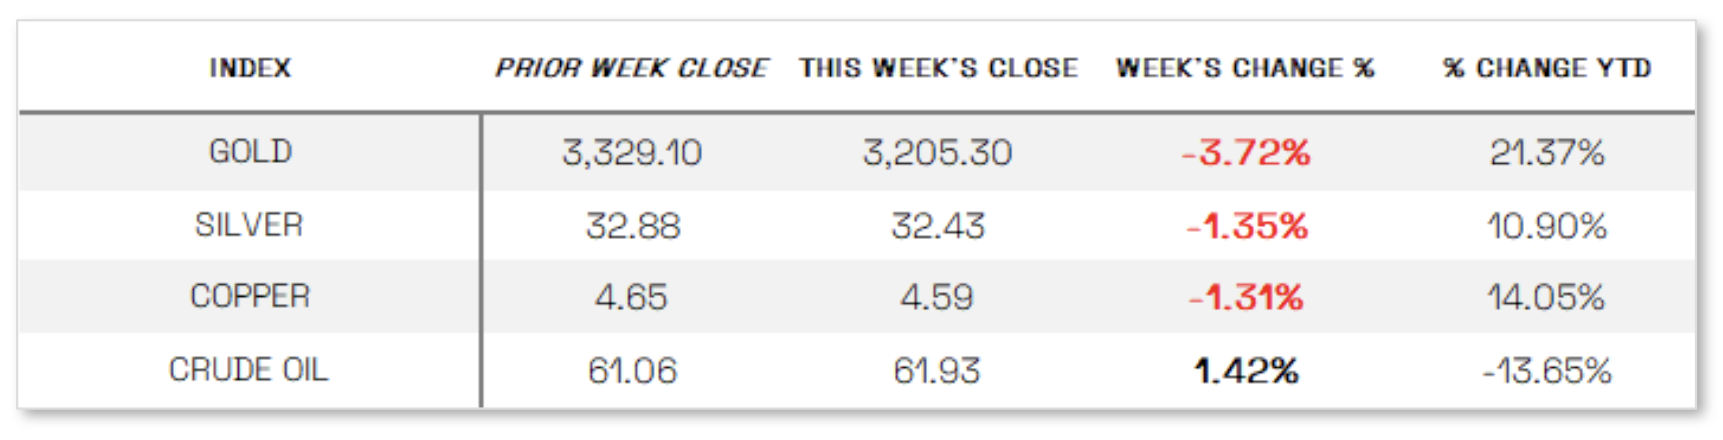
U.S. Commodities/Futures:
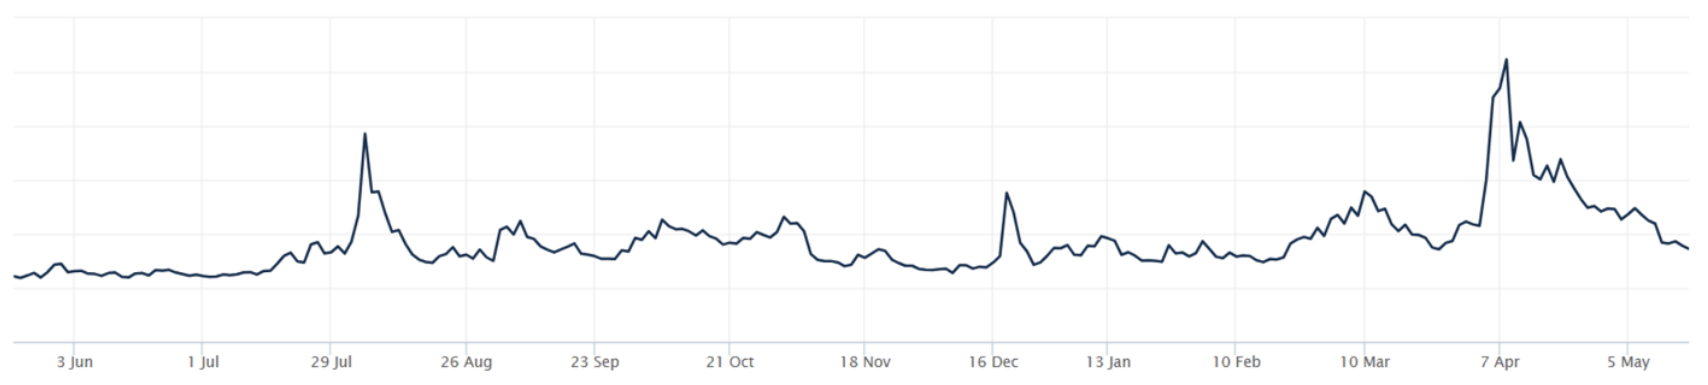
THE VOLATILITY INDEX (VIX) closed at 17.24 this week, a 21.3% decrease vs last week’s close of 21.90.
International Markets:
THIS WEEK’S ECONOMIC NEWS
U.S. Economic News:
Optimistic Economic Data: The rally in U.S. stocks that began with news of a U.S.-China tariff suspension continued into Tuesday, bolstered by the Bureau of Labor Statistics’ (BLS) report showing cooler-than-expected inflation in April. The Consumer Price Index (CPI) rose 2.3% year-over-year—slightly below forecasts and marking the slowest annual increase since early 2021—while both headline and core monthly CPI rose just 0.2%, under expectations of 0.3%. Adding to the optimism, the BLS reported an unexpected 0.5% drop in the Producer Price Index (PPI) for April, suggesting companies may be absorbing some tariff-related costs due to shrinking margins. However, signs of economic strain emerged as the Census Bureau reported that retail sales in April grew only 0.1%, a sharp slowdown from March’s 1.7% increase, reflecting reduced consumer spending in categories like vehicles, sporting goods, and apparel. Meanwhile, consumer sentiment declined for the fifth straight month, with the University of Michigan’s index falling to 50.8 in May and inflation expectations rising to 7.3%, as growing concern over tariffs continued to weigh heavily on public perception of the economy.
International Economic News:
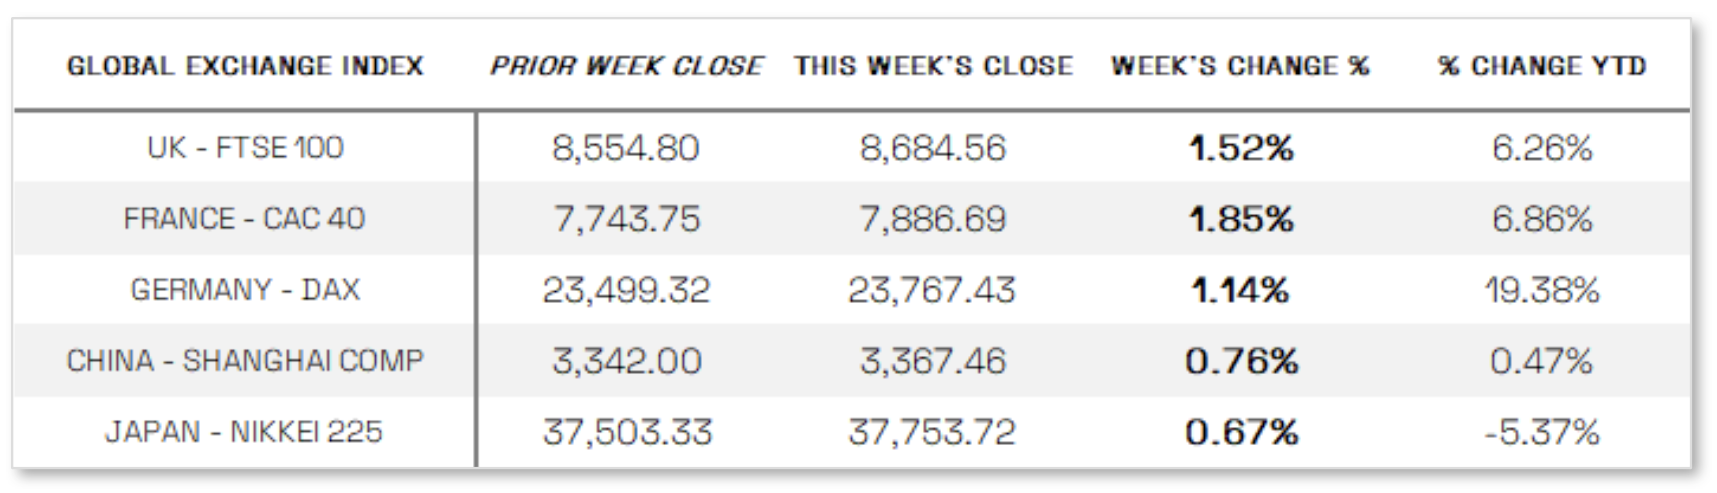
EUROPE: In local currency terms, the pan-European STOXX Europe 600 Index rose 2.10% as investor sentiment improved following a de-escalation in the U.S.-China trade war, with major European indices also posting gains—Germany’s DAX rose 1.14%, France’s CAC 40 added 1.85%, Italy’s FTSE MIB climbed 3.27%, and the UK’s FTSE 100 advanced 1.52%. In the UK, the economy grew at its fastest pace in a year, with first-quarter GDP expanding 0.7%, exceeding expectations and driven by strong gains in services, investment, and exports. However, labor market data pointed to some softening, as the unemployment rate ticked up to 4.5%, and the number of payrolled employees saw the steepest decline in a year. Meanwhile, private sector wage growth excluding bonuses—closely watched by the Bank of England—slowed to 5.6% year-over-year in the January–March period, marking its weakest pace since the three months through November 2024.
JAPAN: Japan’s stock markets posted modest gains for the week, with the Nikkei 225 rising 0.67% and the broader TOPIX Index up 0.25%, supported by improved sentiment following a temporary de-escalation in the U.S.-China trade dispute, which saw both nations agree to significantly reduce tariffs. Japan, engaged in its own trade talks with the U.S., continued to advocate for a comprehensive review of all U.S.-imposed tariffs, particularly on autos and related goods. The yield on the 10-year Japanese government bond climbed to 1.46% from 1.35% as easing global trade tensions reduced demand for safe-haven assets. Although the yen weakened early in the week on diminished safe-haven appeal, it later rebounded, ending roughly unchanged in the low JPY 145 range against the U.S. dollar amid a broader rally in Asian currencies, partly driven by speculation that the U.S. might favor a weaker dollar in ongoing trade talks. However, Japan’s economic outlook dimmed as GDP contracted an annualized 0.7% quarter over quarter in the first quarter of 2025—well below expectations—largely due to weak private consumption and reduced demand from key trade partners like China. In response, the Bank of Japan downgraded its growth and inflation forecasts but maintained that it would consider raising interest rates if economic conditions evolve in line with its projections.
CHINA: Mainland Chinese stock markets rose over the week, driven by optimism following a de-escalation in U.S.-China trade tensions, with the CSI 300 Index gaining 1.12% and the Shanghai Composite Index up 0.76% in local currency terms, while Hong Kong’s Hang Seng Index advanced 2.09%, according to FactSet. Early in the week, Chinese stocks rallied after a trade deal with the U.S.—which included a temporary mutual reduction of tariffs—exceeded expectations and addressed nearly all of Beijing’s key demands. However, gains began to fade midweek as the improved trade outlook reduced the likelihood of aggressive stimulus measures from the Chinese government. Investor sentiment in recent weeks had been buoyed by expectations that escalating trade tensions would prompt Beijing to increase economic support, and earlier in May, the People’s Bank of China responded by cutting the reserve requirement ratio by 0.5 percentage points and trimming the seven-day reverse repo rate by 10 basis points to 1.4%. Still, hopes for further stimulus have cooled in the near term as the U.S. and China continue negotiations aimed at reaching a broader agreement over the next three months.
Sources:
>> All index and returns data from Norgate Data and Commodity Systems Incorporated and Wall Street Journal.
>> News from Reuters, Barron’s, Wall St. Journal, Bloomberg.com, ft.com, guggenheimpartners.com, zerohedge.com, ritholtz.com, markit.com, financialpost.com, Eurostat, Statistics Canada, Yahoo! Finance, stocksandnews.com, marketwatch.com, visualcapitalist.com, wantchinatimes.com, BBC, 361capital.com, pensionpartners.com, cnbc.com, FactSet, Morningstar/Ibbotson Associates, Corporate Finance Institute.
>> Commentary from T Rowe Price Global markets weekly update — https://www.troweprice.com/personal-investing/resources/insights/global-markets-weekly-update.html
Disclosures: This material and any mention of specific investments is provided for informational purposes only and is not intended to be investment advice or a recommendation to take any action. The forecasts or forward-looking statements are based on assumptions, may not materialize, and are subject to revision without notice. The market indexes discussed are unmanaged, and generally, considered representative of their respective markets. Index performance is not indicative of the past performance of a particular investment. Indexes do not incur management fees, costs, and expenses. Individuals cannot directly invest in unmanaged indexes. Past performance does not guarantee future results.
