


THE COMPLETE PICTURE
>> Four indicators across three time frames.
>> When the Sherman Portfolios indicators are not all the same status, we read the market as being in a Mixed Market.
1. DELTA-V — Negative since April 4, 2025
2. GALACTIC SHIELD — Positive since April 1, 2023
3. STARFLUX— Negative since March 10, 2025
4. STARPATH — Negative since March 7, 2025
The shorter term picture:
>> GALACTIC SHIELD — POSITIVE, for Q2 2025, This indicator is based on the combination of U.S. and International Equities trend statuses at the start of each quarter.
>> STARFLUX— NEGATIVE, Starflux ended the week at -3.31 (up 57.0% last week) This short-term indicator measures U.S. Equities.
>> STARPATH — NEGATIVE, This indicator measures the interplay on dual timeframes of our Type 1s + the Russell 3000 + our four most ‘pro-cyclical’ Type 3s, vs. Cash.
The big picture:
The ‘big picture’ is the (typically) years-long timeframe, the same timeframe in which Cyclical Bulls and Bears operate.
>> The Sherman Portfolios DELTA-V Indicator measuring the Bull/Bear cycle finished the week in BEAR status at 43.25, up 4.22% from the prior week’s 41.50. It has signaled Bear since April 4, 2025.
>> The Sherman Portfolios DELTA-V Bond Indicator measuring the Bull/Bear cycle finished the week in BULL status at 60.23, up 0.25% from the prior week’s 60.08. It has signaled Bull since December 15, 2023.
THIS WEEK IN THE MARKETS
U.S. Markets:
Markets up as trade tensions ease:
U.S. stocks rose over the week, boosted by encouraging reports suggesting a possible easing of trade tensions between the U.S. and China, as well as speculation about near-term agreements with other trading partners. Positive sentiment was further supported by President Donald Trump’s comments that appeared to soften his earlier threat to fire Federal Reserve Chair Jerome Powell. The Nasdaq Composite led the major indexes with a sharp rebound from the prior week, while small- and mid-cap stocks posted gains for a third straight week. Better-than-expected corporate earnings also fueled optimism, with FactSet data showing that 73% of companies reporting first-quarter results through Friday morning had exceeded consensus expectations. Despite the gains, market activity and trading volumes remained light, staying below year-to-date averages.
Looking at the US Indexes:
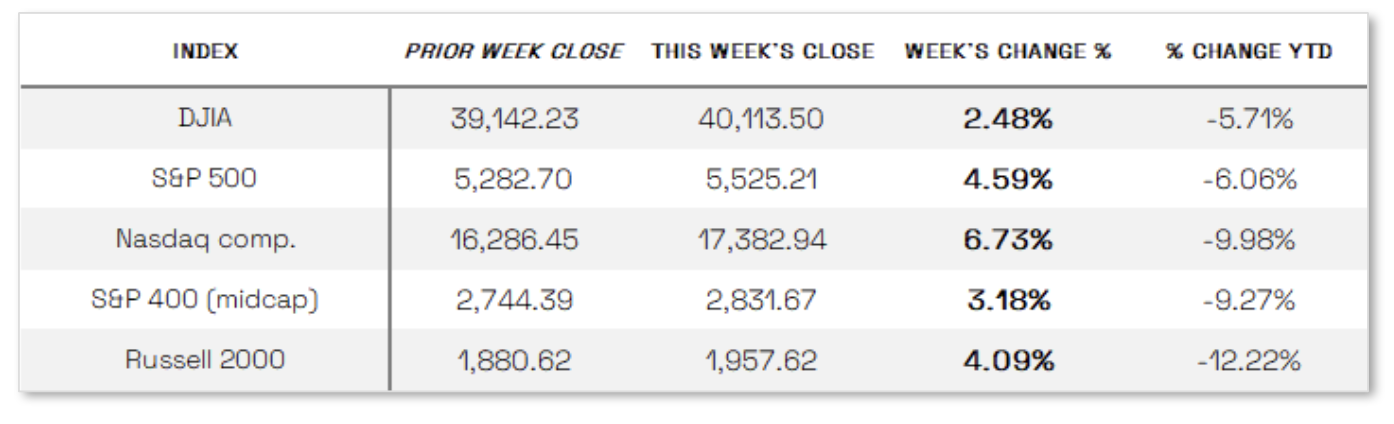
> The Dow Jones Industrial Average (DJIA) is the oldest continuing U.S. market index with over 100 years of history and is made up of 30 highly reputable “blue-chip” U.S. stocks (e.g. Coca-Cola Co., Microsoft). The Dow ended the week up 2.48% at 40,113.50 vs the prior week of 39,142.23.
> The Nasdaq Composite Index tracks most of the stocks listed on the Nasdaq Stock Market – the second-largest stock exchange in the world. Over half of all stocks on the NASDAQ are tech stocks. The tech-driven Nasdaq ended the week up 6.73%, closing at 17,382.94 vs. the prior week of 16,286.45.
> The S&P 500 large-cap index is a market-capitalization-weighted index of 500 leading publicly traded companies in the U.S. The S&P 500 is regarded as one of the best gauges of prominent American equities’ performance, and by extension, that of the stock market overall. The S&P 500 ended the week up 4.59%, closing at 5,525.21 compared to last week’s 5,282.70.
> The S&P 400 mid-cap index is the benchmark index made up of 400 stocks that broadly represent companies with midrange market capitalization between $3.6 billion and $13.1 billion. It is used by investors as a gauge for market performance and directional trends in U.S. stocks. The S&P 400 mid-cap ended the week up 3.18%, closing at 2,831.67 compared to last week’s 2,744.39.
> The Russell 2000 (RUT) small-cap index measures the performance of the 2,000 smaller companies included in the Russell 3000 Index. The Russell 2000 is managed by London’s FTSE Russell Group and is widely regarded as a leading indicator of the U.S. economy because of its focus on smaller companies that focus on the U.S. market. The Russell 2000 ended the week up 4.09%, closing at 1,957.62 compared to last week’s 1,880.62.
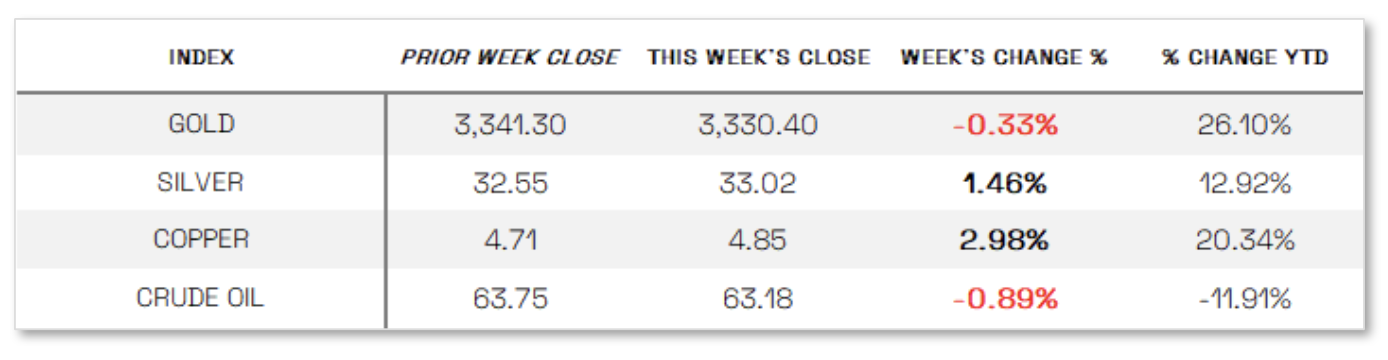
U.S. Commodities/Futures:
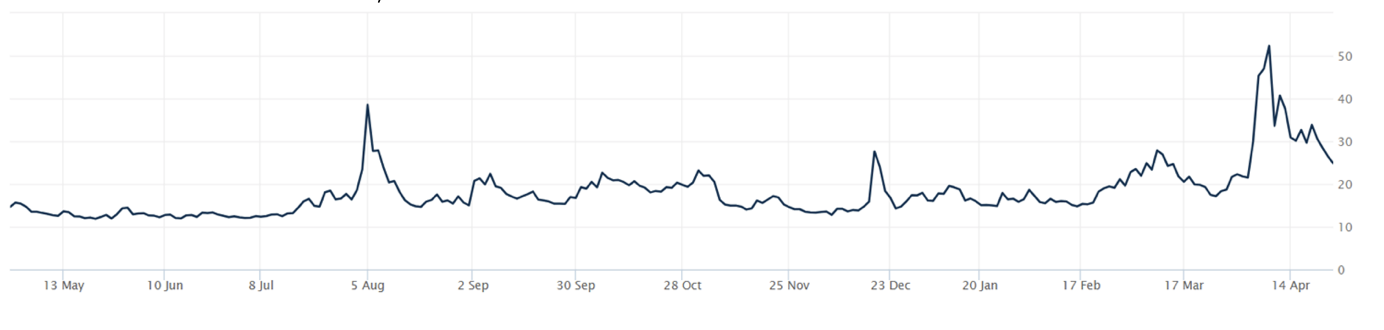
THE VOLATILITY INDEX (VIX) closed at 24.84 this week, a 16.2% decrease vs last week’s close of 29.65.
International Markets:
THIS WEEK’S ECONOMIC NEWS
U.S. Economic News:
Consumer sentiment and housing sales down: U.S. business activity growth slowed to a 16-month low in April, according to S&P Global’s Flash PMI survey, with services activity weakening sharply despite a slight uptick in manufacturing, dragging the overall index down to 51.2 from 53.5 in March. Prices for goods and services rose at the fastest pace in over a year, largely due to tariffs, while business optimism slipped to its lowest level since July 2022, though manufacturers remained somewhat more hopeful due to expected benefits from government policies. Meanwhile, the Census Bureau reported that durable goods orders climbed for a third straight month in March, surging 9.2% largely on the back of soaring transportation equipment orders, particularly a 139% jump in commercial aircraft purchases aimed at beating future tariffs; excluding transportation, orders were flat, signaling caution among businesses. In the housing market, the National Association of Realtors announced that existing-home sales plunged 5.9% in March, the steepest monthly decline since November 2022, driven by high mortgage rates and affordability challenges, though NAR’s chief economist highlighted that low mortgage delinquencies keep the market fundamentally stable. Adding to concerns, the University of Michigan reported that consumer sentiment fell for a fourth consecutive month in April, with the index slipping 8% from March and inflation expectations for the year ahead jumping to 6.5%, the highest level since 1981, amid persistent uncertainty around trade policy and inflation risks.
International Economic News:
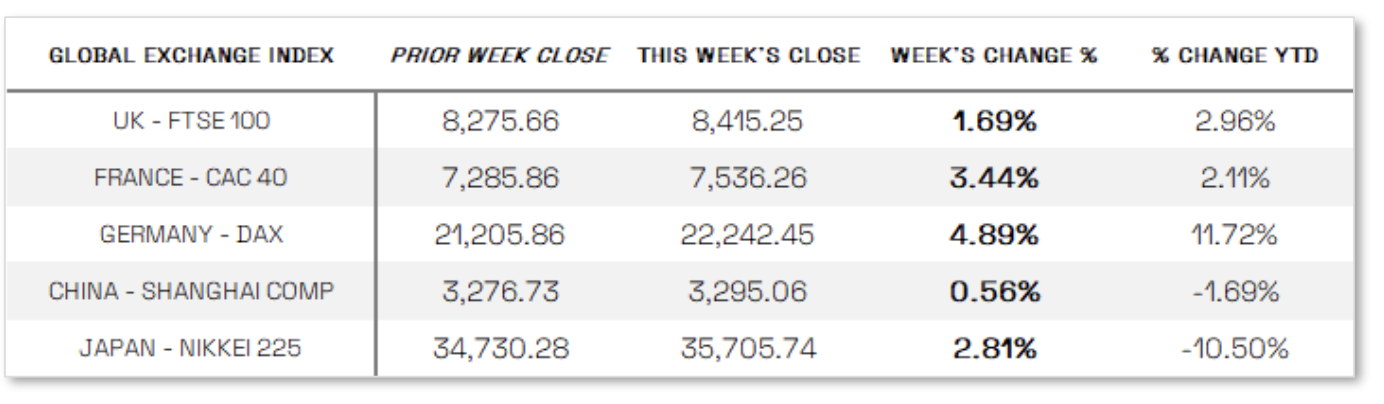
EUROPE: In local currency terms, the pan-European STOXX Europe 600 Index rose 2.77% after U.S. President Trump signaled a willingness to ease trade tensions with China and retracted threats to fire Federal Reserve Chair Jerome Powell, while major European stock indexes also posted gains, with Germany’s DAX climbing 4.89%, France’s CAC 40 up 3.44%, Italy’s FTSE MIB advancing 3.80%, and the UK’s FTSE 100 adding 1.69%. European Central Bank Chief Economist Philip Lane stated that while tariff uncertainty would weigh on economic growth, a recession in the eurozone was unlikely due to its diversified trading ties, though ECB President Christine Lagarde acknowledged the possibility of revisiting growth forecasts at the June policy meeting. Meanwhile, Germany’s government lowered its GDP forecast for 2025 to stagnation from the previously projected 0.3% growth, following the introduction of new U.S. trade tariffs in April, and Bundesbank President Joachim Nagel warned that the country’s export-driven economy could slip into a slight recession, after already contracting for the past two years.
JAPAN: Japanese stock markets rose over the week, with the Nikkei 225 gaining 2.81%, supported by signs of easing global trade tensions, while the yen weakened to around the mid-143 range against the U.S. dollar and the 10-year Japanese government bond yield climbed to 1.34% from 1.29%. A stronger-than-expected Tokyo-area inflation reading, with core CPI rising 3.4% year over year in April, bolstered the case for further Bank of Japan (BoJ) rate hikes, although BoJ Governor Kazuo Ueda emphasized that monetary policy normalization would proceed cautiously amid uncertainties surrounding the economic impact of U.S. tariffs. Inflation acceleration was mainly driven by food price increases and cuts to government energy subsidies. Meanwhile, Japan’s government announced emergency economic relief measures, including support for corporate financing and efforts to stimulate consumption, to counter the effects of higher U.S. tariffs, as bilateral trade talks continued without Japan yet securing exemptions; Prime Minister Shigeru Ishiba warned that key domestic industries like automobiles and steel could face significant challenges under the current tariff regime.
CHINA: Mainland Chinese stock markets advanced over the week on expectations that the government would introduce more stimulus to offset the economic impact of U.S. tariffs, the Shanghai Composite Index gaining 0.56%. On Friday, China’s Politburo announced plans to “fully prepare” emergency responses to external shocks and unveiled intentions to develop new monetary tools and policy financing instruments aimed at boosting technology, consumption, and trade, according to Bloomberg and state media reports. The Politburo, led by President Xi Jinping, signaled a measured and patient approach to supporting the economy amid the trade war with the U.S., even as analysts expect the effects of the Trump administration’s April tariff hikes—which raised total tariffs on most Chinese goods to 145%—to soon materialize. Nevertheless, China’s stronger-than-expected first-quarter growth and the early March stimulus measures have given Beijing more flexibility in timing additional economic support.
Sources:
>> All index and returns data from Norgate Data and Commodity Systems Incorporated and Wall Street Journal.
>> News from Reuters, Barron’s, Wall St. Journal, Bloomberg.com, ft.com, guggenheimpartners.com, zerohedge.com, ritholtz.com, markit.com, financialpost.com, Eurostat, Statistics Canada, Yahoo! Finance, stocksandnews.com, marketwatch.com, visualcapitalist.com, wantchinatimes.com, BBC, 361capital.com, pensionpartners.com, cnbc.com, FactSet, Morningstar/Ibbotson Associates, Corporate Finance Institute.
>> Commentary from T Rowe Price Global markets weekly update — https://www.troweprice.com/personal-investing/resources/insights/global-markets-weekly-update.html
Disclosures: This material and any mention of specific investments is provided for informational purposes only and is not intended to be investment advice or a recommendation to take any action. The forecasts or forward-looking statements are based on assumptions, may not materialize, and are subject to revision without notice. The market indexes discussed are unmanaged, and generally, considered representative of their respective markets. Index performance is not indicative of the past performance of a particular investment. Indexes do not incur management fees, costs, and expenses. Individuals cannot directly invest in unmanaged indexes. Past performance does not guarantee future results.
