


THE COMPLETE PICTURE
>> Four indicators across three time frames.
>> When the Sherman Portfolios indicators are not all the same status, we read the market as being in a Mixed Market.
1. DELTA-V — Negative since April 4, 2025
2. GALACTIC SHIELD — Positive since April 1, 2023
3. STARFLUX— Negative since March 10, 2025
4. STARPATH — Negative since March 7, 2025
The shorter term picture:
>> GALACTIC SHIELD — POSITIVE for Q2 2025, indicating positive prospects for equities in the first quarter of 2025. This indicator is based on the combination of U.S. and International Equities trend statuses at the start of each quarter.
>> STARFLUX— NEGATIVE, Starflux ended the week at -6.59 (up 47.74% last week) This short-term indicator measures U.S. Equities.
>> STARPATH — NEGATIVE, This indicator measures the interplay on dual timeframes of our Type 1s + the Russell 3000 + our four most ‘pro-cyclical’ Type 3s, vs. Cash.
The big picture:
The ‘big picture’ is the (typically) years-long timeframe, the same timeframe in which Cyclical Bulls and Bears operate.
>> The Sherman Portfolios DELTA-V Indicator measuring the Bull/Bear cycle finished the week in BEAR status at 42.11, down 0.09% from the prior week’s 42.15. It has signaled Bull since April 4, 2025.
>> The Sherman Portfolios DELTA-V Bond Indicator measuring the Bull/Bear cycle finished the week in BULL status at 60.68, down 2.97% from the prior week’s 62.54. It has signaled Bull since December 15, 2023.
THIS WEEK IN THE MARKETS
U.S. Markets:
Tariff changes lead to volatile market
U.S. stocks ended the week higher after a turbulent stretch driven by ongoing trade policy uncertainty. Markets initially fell sharply as investors braced for the Trump administration’s latest round of tariffs, but sentiment shifted midweek when President Trump announced a 90-day pause on reciprocal tariff increases for most countries to allow time for negotiations. This announcement sparked a significant rally, with the Nasdaq Composite surging over 12% and recording its second-best day on record. However, China was notably excluded from the pause, prompting a tit-for-tat escalation in tariffs between the U.S. and China, which raised concerns about global economic growth and tempered some of the week’s earlier optimism. Despite the volatility, the S&P 500 closed the week up 5.70%, the Nasdaq rose 7.29%, and the Russell 2000 gained 1.82%.
Looking at the US Indexes:
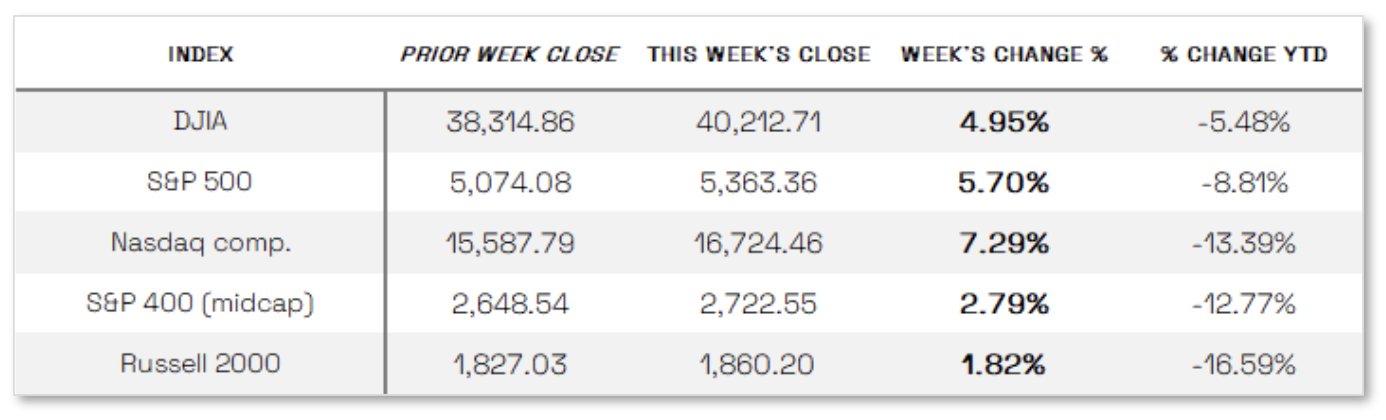
> The Dow Jones Industrial Average (DJIA) is the oldest continuing U.S. market index with over 100 years of history and is made up of 30 highly reputable “blue-chip” U.S. stocks (e.g. Coca-Cola Co., Microsoft). The Dow ended the week up 4.95% at 40,212.71 vs the prior week of 38,314.86.
> The Nasdaq Composite Index tracks most of the stocks listed on the Nasdaq Stock Market – the second-largest stock exchange in the world. Over half of all stocks on the NASDAQ are tech stocks. The tech-driven Nasdaq ended the week up 7.29%, closing at 16,724.46 vs. the prior week of 15,587.79.
> The S&P 500 large-cap index is a market-capitalization-weighted index of 500 leading publicly traded companies in the U.S. The S&P 500 is regarded as one of the best gauges of prominent American equities’ performance, and by extension, that of the stock market overall. The S&P 500 ended the week up 5.70%, closing at 5,363.36 compared to last week’s 5,074.08.
> The S&P 400 mid-cap index is the benchmark index made up of 400 stocks that broadly represent companies with midrange market capitalization between $3.6 billion and $13.1 billion. It is used by investors as a gauge for market performance and directional trends in U.S. stocks. The S&P 400 mid-cap ended the week up 2.79%, closing at 2,722.55 compared to last week’s 2,648.54.
> The Russell 2000 (RUT) small-cap index measures the performance of the 2,000 smaller companies included in the Russell 3000 Index. The Russell 2000 is managed by London’s FTSE Russell Group and is widely regarded as a leading indicator of the U.S. economy because of its focus on smaller companies that focus on the U.S. market. The Russell 2000 ended the week up 1.82%, closing at 1,860.20 compared to last week’s 1,827.03.
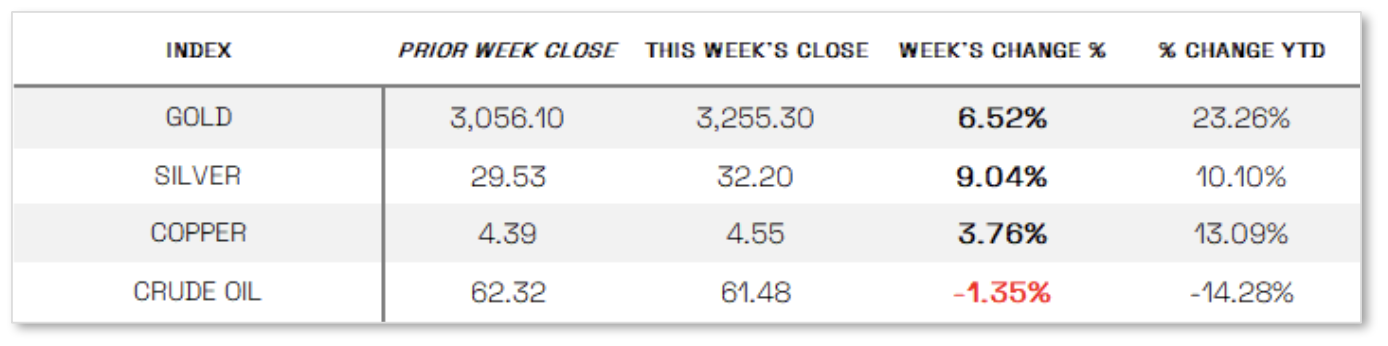
U.S. Commodities/Futures:
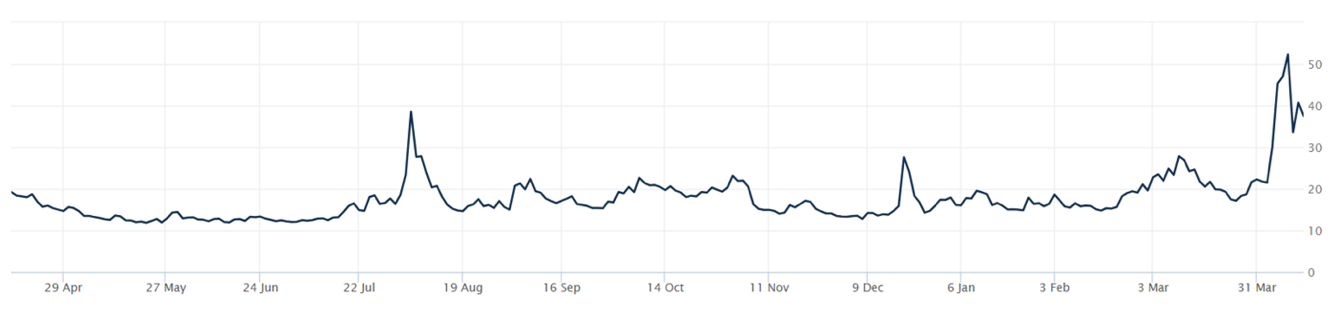
THE VOLATILITY INDEX (VIX) closed at 37.56 this week, a 17.1% decrease vs last week’s close of 45.31.
International Markets:
THIS WEEK’S ECONOMIC NEWS
U.S. Economic News:
Cautious approach from the Federal Reserve: The Federal Reserve released minutes from its March policy meeting, revealing that officials are taking a “cautious approach” to monetary policy amid heightened uncertainty and growing concerns about both slowing economic growth and persistent inflation. Policymakers noted increased downside risks to employment and growth, alongside inflationary pressures likely to be amplified by higher tariffs. While the Fed remains ready to respond to incoming data, members acknowledged the potential for difficult trade-offs if inflation remains stubborn while the labor market weakens. Meanwhile, March consumer price data showed some cooling, with core CPI rising just 0.1%—its lowest monthly increase in nine months—though annual core inflation still rose 2.8%, the smallest gain since March 2021. Despite this moderation, consumer sentiment deteriorated further, with the University of Michigan’s index falling to its lowest level since June 2022 and year-ahead inflation expectations jumping to 6.7%, the highest since 1981, reflecting growing public anxiety over trade tensions.
International Economic News:
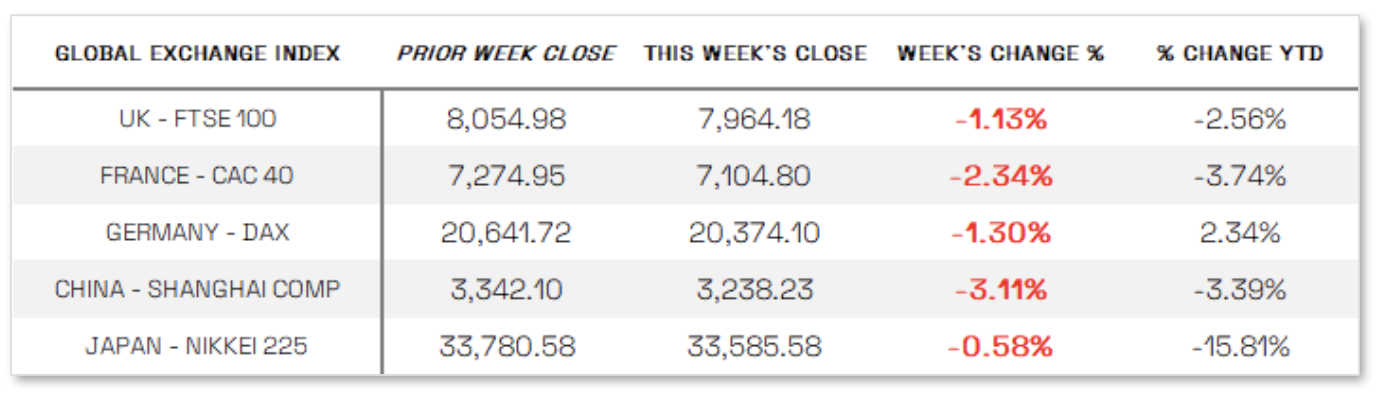
EUROPE: The pan-European STOXX Europe 600 Index fell 1.92% in local currency terms as escalating trade tensions weighed on investor sentiment, though losses were pared later in the week after U.S. President Donald Trump announced a delay in the implementation of reciprocal tariffs for most trading partners. Major European indexes also posted declines, with Germany’s DAX down 1.30%, Italy’s FTSE MIB dropping 1.79%, France’s CAC 40 losing 2.34%, and the UK’s FTSE 100 slipping 1.13%. The market volatility prompted central banks in the eurozone and the UK to heighten their vigilance. The European Central Bank urged banks to more closely monitor deposits and funding sources, while the Bank of England requested data from lenders on market liquidity and client exposures, particularly hedge funds. In response to the turbulence, the BoE also postponed some bond auctions and its Financial Policy Committee warned of potential further corrections, emphasizing that continued global trade fragmentation and financial market stress could pose risks to economic growth and financial stability.
JAPAN: Japanese stocks declined over the week, with the Nikkei 225 and TOPIX Index both falling around 0.6%, as concerns over escalating U.S. tariffs and a potential global trade war triggered a sharp sell-off, particularly in Japanese bank shares. Sentiment improved somewhat later in the week after the U.S. signaled willingness to engage in trade talks with Japan and announced a temporary 90-day reduction of new tariffs to 10% for most partners—though Japan’s auto exports remained excluded from the pause, prompting Tokyo to seek exemptions. Meanwhile, the yen strengthened significantly, reaching the high end of the JPY 142 range against the U.S. dollar, as investors sought safe-haven assets amid a sell-off in U.S. Treasuries and growing recession fears. Japanese officials voiced concern over currency volatility and called for global coordination to address the broader economic risks from tariffs. Bond markets reflected a shifting outlook, with the 10-year Japanese government bond yield rising to 1.36% from 1.18%, as signs of market stabilization supported expectations that the Bank of Japan remains on a path toward gradual policy normalization. However, BoJ Governor Kazuo Ueda noted the uncertainty surrounding global trade policy and emphasized that the central bank would closely monitor developments and adjust its approach as needed.
CHINA: Mainland Chinese stock markets ended the week lower, with the CSI 300 Index down 2.87% and the Shanghai Composite falling 3.11% in local currency terms, while Hong Kong’s Hang Seng Index slumped 8.42%, reflecting deepening concerns over the escalating U.S.-China trade war. However, losses were partially offset by growing expectations that Beijing would introduce fresh stimulus measures to support the economy. Both the CSI 300 and Shanghai Composite posted four consecutive daily gains through Friday after reports emerged that top Chinese officials had convened to discuss potential economic support in response to rising U.S. tariffs. On Friday, China raised its tariffs on U.S. imports to 125%, one day after the Trump administration confirmed its tariffs on Chinese goods had reached 145%. In a pointed response, China dismissed further tariff hikes as meaningless, calling the U.S. approach a “numbers game” lacking economic rationale. Despite the pressure, economists estimate that U.S. tariffs could reduce China’s GDP by 1% to 2% this year but believe Beijing has ample room for countermeasures, particularly through fiscal stimulus. With the country having reduced leverage in recent years and pivoting toward boosting domestic consumption, policymakers appear poised to cushion the economic blow and maintain growth momentum.
Sources:
>> All index and returns data from Norgate Data and Commodity Systems Incorporated and Wall Street Journal.
>> News from Reuters, Barron’s, Wall St. Journal, Bloomberg.com, ft.com, guggenheimpartners.com, zerohedge.com, ritholtz.com, markit.com, financialpost.com, Eurostat, Statistics Canada, Yahoo! Finance, stocksandnews.com, marketwatch.com, visualcapitalist.com, wantchinatimes.com, BBC, 361capital.com, pensionpartners.com, cnbc.com, FactSet, Morningstar/Ibbotson Associates, Corporate Finance Institute.
>> Commentary from T Rowe Price Global markets weekly update — https://www.troweprice.com/personal-investing/resources/insights/global-markets-weekly-update.html
Disclosures: This material and any mention of specific investments is provided for informational purposes only and is not intended to be investment advice or a recommendation to take any action. The forecasts or forward-looking statements are based on assumptions, may not materialize, and are subject to revision without notice. The market indexes discussed are unmanaged, and generally, considered representative of their respective markets. Index performance is not indicative of the past performance of a particular investment. Indexes do not incur management fees, costs, and expenses. Individuals cannot directly invest in unmanaged indexes. Past performance does not guarantee future results.
