


The very big picture (a historical perspective): The CAPE is now at 37.96.
The long-term valuation of the market is commonly measured by the Cyclically Adjusted Price to Earnings ratio, or “CAPE”, which smooths-out shorter-term earnings swings in order to get a longer-term assessment of market valuation. In the past, the CAPE ratio has proved its importance in identifying potential bubbles and market crashes. An extremely high CAPE ratio means that a company’s stock price is substantially higher than the company’s earnings would indicate and, therefore, overvalued. It is generally expected that the market will eventually correct the company’s stock price by pushing it down to its true value. The historical average of the ratio for the S&P 500 Index is between 15-16, while the highest levels of the ratio have exceeded 30.
The record-high levels occurred three times in the history of the U.S. financial markets. The first was in 1929 before the Wall Street crash that signaled the start of the Great Depression. The second was in the late 1990s before the Dotcom Crash, and the third came in 2007 before the 2007-2008 Financial Crisis. https://www.multpl.com/shiller-pe
HISTORY OF THE CAPE VALUE FROM 1871 TO PRESENT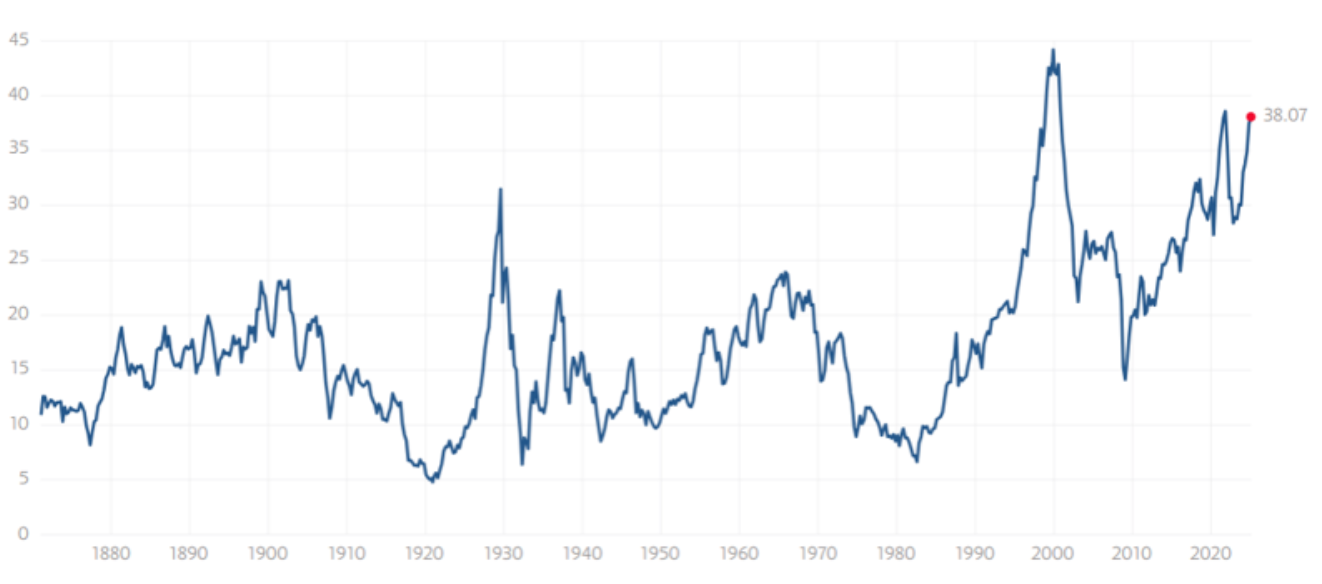
Note: We do not use CAPE as an official input into our methods. However, we think history serves as a guide and that it’s good to know where we are on the historic continuum. https://www.multpl.com/shiller-pe
The big picture: The ‘big picture’ is the (typically) years-long timeframe, the same timeframe in which Cyclical Bulls and Bears operate. The Sherman Portfolios DELTA-V Indicator measuring the Bull/Bear cycle finished the week in BULL status at 61.14, down 1.34% from the prior week’s 61.97. It has signaled Bull since April 21, 2023. The Sherman Portfolios DELTA-V Bond Indicator measuring the Bull/Bear cycle finished the week in BULL status at 53.57, up 4.94% from the prior week’s 51.05. It has signaled Bull since December 15, 2023.
The shorter term picture: GALACTIC SHIELD — POSITIVE for Q1 2025, indicating positive prospects for equities in the first quarter of 2025. This indicator is based on the combination of U.S. and International Equities trend statuses at the start of each quarter. STARFLUX— POSITIVE, Starflux ended the week at 5.94 (down 2.93% last week) This short-term indicator measures U.S. Equities. STARPATH — POSITIVE, This indicator measures the interplay on dual timeframes of our Type 1s + the Russell 3000 + our four most ‘pro-cyclical’ Type 3s, vs. Cash.
The complete picture (four indicators across three timeframes): When all four of the Sherman Portfolios indicators are in a POSITIVE status, we read the market as being in a BULL MARKET.
1. DELTA-V — Positive
2. GALACTIC SHIELD — Positive
3. STARFLUX— Positive
4. STARPATH — Positive
THIS WEEK IN THE MARKETS
U.S. Markets:
Stocks down over tariff concerns:
Stocks ended the week lower amid tariff uncertainty, with major indexes declining, though the S&P 500 held up best, slipping just 0.24%. The week began with a sharp sell-off following President Trump’s announcement of 25% tariffs on imports from Mexico and Canada and 10% levies on Chinese goods, set to take effect February 1. However, stocks recovered some losses after Trump agreed to delay tariffs on Mexico and Canada for 30 days. Meanwhile, earnings reports influenced sentiment, as 77% of S&P 500 companies that reported through Friday exceeded earnings expectations, with an average growth rate of 16.4%, surpassing the estimated 11.9%, while 63% also beat sales forecasts.
Looking at the US Indexes:
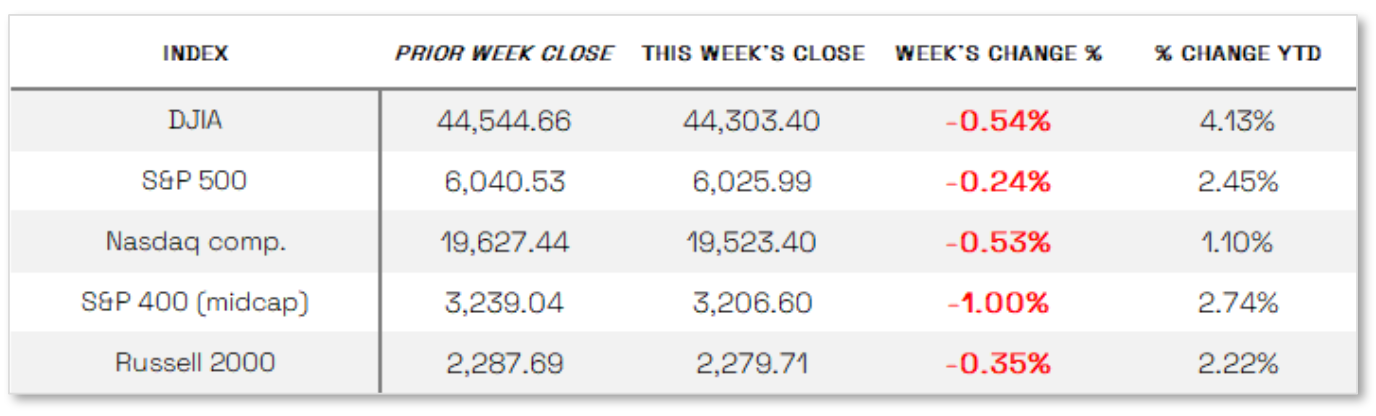
The Dow Jones Industrial Average (DJIA) is the oldest continuing U.S. market index with over 100 years of history and is made up of 30 highly reputable “blue-chip” U.S. stocks (e.g. Coca-Cola Co., Microsoft). The Dow ended the week down 0.54% at 44,303.40 vs the prior week of 44,544.66.
The Nasdaq Composite Index tracks most of the stocks listed on the Nasdaq Stock Market – the second-largest stock exchange in the world. Over half of all stocks on the NASDAQ are tech stocks. The tech-driven Nasdaq ended the week down 0.53%, closing at 19,523.40 vs. the prior week of 19,627.44.
The S&P 500 large-cap index is a market-capitalization-weighted index of 500 leading publicly traded companies in the U.S. The S&P 500 is regarded as one of the best gauges of prominent American equities’ performance, and by extension, that of the stock market overall. The S&P 500 ended the week down 0.24%, closing at 6025.99 compared to last week’s 6040.53.
The S&P 400 mid-cap index is the benchmark index made up of 400 stocks that broadly represent companies with midrange market capitalization between $3.6 billion and $13.1 billion. It is used by investors as a gauge for market performance and directional trends in U.S. stocks. The S&P 400 mid-cap ended the week down 1.00%, closing at 3206.60 compared to last week’s 3239.04.
The Russell 2000 (RUT) small-cap index measures the performance of the 2,000 smaller companies included in the Russell 3000 Index. The Russell 2000 is managed by London’s FTSE Russell Group and is widely regarded as a leading indicator of the U.S. economy because of its focus on smaller companies that focus on the U.S. market. The Russell 2000 ended the week down 0.35%, closing at 2279.71 compared to last week’s 2287.69.
U.S. Commodities/Futures:

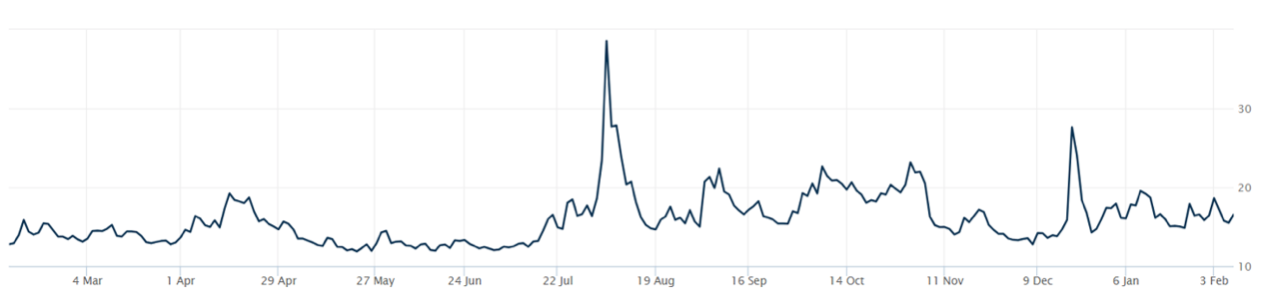
THE VOLATILITY INDEX (VIX) closed at 16.51 this week, a 0.5% increase vs last week’s close of 16.43.
International Markets:
THIS WEEK’S ECONOMIC NEWS
U.S. Economic News:
Manufacturing up, while labor market cools: U.S. manufacturing activity expanded in January for the first time in 27 months, according to the ISM Manufacturing PMI, though ISM Manufacturing Business Survey Chair Timothy Fiore warned that potential tariffs pose a major risk to sustained recovery. Meanwhile, the ISM Services PMI declined from December but remained in expansion territory at 52.8. On the labor front, Friday’s nonfarm payrolls report showed the U.S. added 143,000 jobs in January, down from December’s revised 307,000 and below expectations of 170,000, while the unemployment rate unexpectedly fell to 4.0%. Supporting signs of a gradually cooling labor market, job openings hit a three-month low of 7.6 million in December, and weekly jobless claims rose by 11,000 to 219,000, with continuing claims increasing to 1.89 million.
International Economic News:
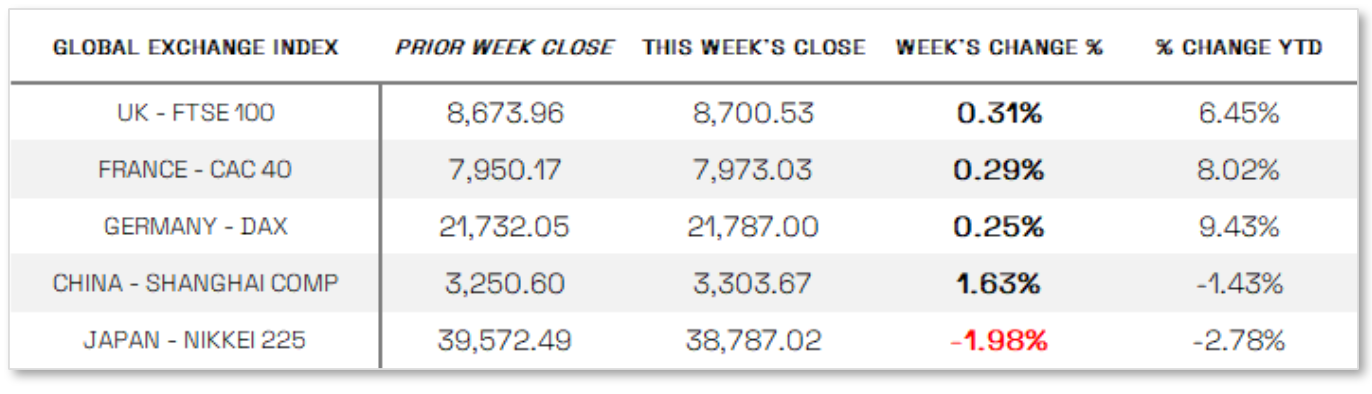
EUROPE: The pan-European STOXX Europe 600 Index rose 0.60% in local currency terms, nearing record levels despite concerns over U.S. trade policy and slowing economic growth, with major indexes posting gains—Italy’s FTSE MIB climbed 1.60%, Germany’s DAX added 0.25%, France’s CAC 40 rose 0.29%, and the UK’s FTSE 100 increased 0.31%. Meanwhile, the Bank of England (BoE) cut interest rates for the third time since August, lowering its benchmark rate to 4.5% as inflation and wage growth showed signs of easing. The Monetary Policy Committee voted 7–2 in favor, with two members advocating for a larger cut due to economic weakness, and the BoE revised its UK growth forecast down to 0.75% while projecting inflation to remain above target until 2027. In the eurozone, inflation remained above the European Central Bank’s target for a third consecutive month, rising to 2.5% in January from 2.4% in December, while core inflation held steady at 2.7%, and services inflation, closely watched by policymakers, reached 3.9%, with ECB President Christine Lagarde attributing the increase to base effects from energy prices.
JAPAN: Japan’s stock markets declined over the week, with the Nikkei 225 falling 1.98% and the TOPIX Index down 1.8%, as hawkish comments from the Bank of Japan (BoJ) strengthened the yen to the high end of the JPY 151 range against the U.S. dollar from 155.2 the previous week, pressuring profit outlooks for export-heavy industries. The yield on the 10-year Japanese government bond climbed to 1.28% from 1.23% amid expectations of further BoJ rate hikes, which the central bank has signaled will depend on economic, price, and wage trends. Supporting the case for tightening, data showed a sharp rise in nominal wages in December, with real wages posting positive growth for the second consecutive month, driven largely by increased winter bonuses. Additionally, household spending rebounded more than expected, reinforcing the BoJ’s stance that sustained real wage growth is necessary for private consumption to maintain an upward trend.
CHINA: Mainland Chinese stock markets rose in a shortened trading week as strong consumer spending during the Lunar New Year holiday helped offset concerns over President Trump’s new 10% tariff on Chinese imports, with the CSI 300 Index gaining 1.98% and the Shanghai Composite Index adding 1.63% from Wednesday to Friday, according to FactSet. Hong Kong’s Hang Seng Index surged 4.49%, its best weekly performance in four months, driven by tech sector gains. Robust holiday spending highlighted improved domestic demand, as box office receipts jumped 18% to USD 1.3 billion, domestic trips hit a record 501 million (up 5.9% from last year), and travel spending rose 7% to USD 94.4 billion, per China’s Ministry of Culture and Tourism. However, broader economic indicators showed signs of weakness, with the Caixin Services PMI slipping to 51 in January from 52.2 in December, marking the slowest expansion in four months, while the Caixin Manufacturing PMI fell to 50.1 from 50.5, missing forecasts and following China’s official manufacturing PMI, which unexpectedly contracted.
Sources:
>> All index and returns data from Norgate Data and Commodity Systems Incorporated and Wall Street Journal.
>> News from Reuters, Barron’s, Wall St. Journal, Bloomberg.com, ft.com, guggenheimpartners.com, zerohedge.com, ritholtz.com, markit.com, financialpost.com, Eurostat, Statistics Canada, Yahoo! Finance, stocksandnews.com, marketwatch.com, visualcapitalist.com, wantchinatimes.com, BBC, 361capital.com, pensionpartners.com, cnbc.com, FactSet, Morningstar/Ibbotson Associates, Corporate Finance Institute.
>> Commentary from T Rowe Price Global markets weekly update — https://www.troweprice.com/personal-investing/resources/insights/global-markets-weekly-update.html
Disclosures: This material and any mention of specific investments is provided for informational purposes only and is not intended to be investment advice or a recommendation to take any action. The forecasts or forward-looking statements are based on assumptions, may not materialize, and are subject to revision without notice. The market indexes discussed are unmanaged, and generally, considered representative of their respective markets. Index performance is not indicative of the past performance of a particular investment. Indexes do not incur management fees, costs, and expenses. Individuals cannot directly invest in unmanaged indexes. Past performance does not guarantee future results.
