


The very big picture (a historical perspective): The CAPE is now at 36.98.
The long-term valuation of the market is commonly measured by the Cyclically Adjusted Price to Earnings ratio, or “CAPE”, which smooths-out shorter-term earnings swings in order to get a longer-term assessment of market valuation. In the past, the CAPE ratio has proved its importance in identifying potential bubbles and market crashes. An extremely high CAPE ratio means that a company’s stock price is substantially higher than the company’s earnings would indicate and, therefore, overvalued. It is generally expected that the market will eventually correct the company’s stock price by pushing it down to its true value. The historical average of the ratio for the S&P 500 Index is between 15-16, while the highest levels of the ratio have exceeded 30.
The record-high levels occurred three times in the history of the U.S. financial markets. The first was in 1929 before the Wall Street crash that signaled the start of the Great Depression. The second was in the late 1990s before the Dotcom Crash, and the third came in 2007 before the 2007-2008 Financial Crisis. https://www.multpl.com/shiller-pe
HISTORY OF THE CAPE VALUE FROM 1871 TO PRESENT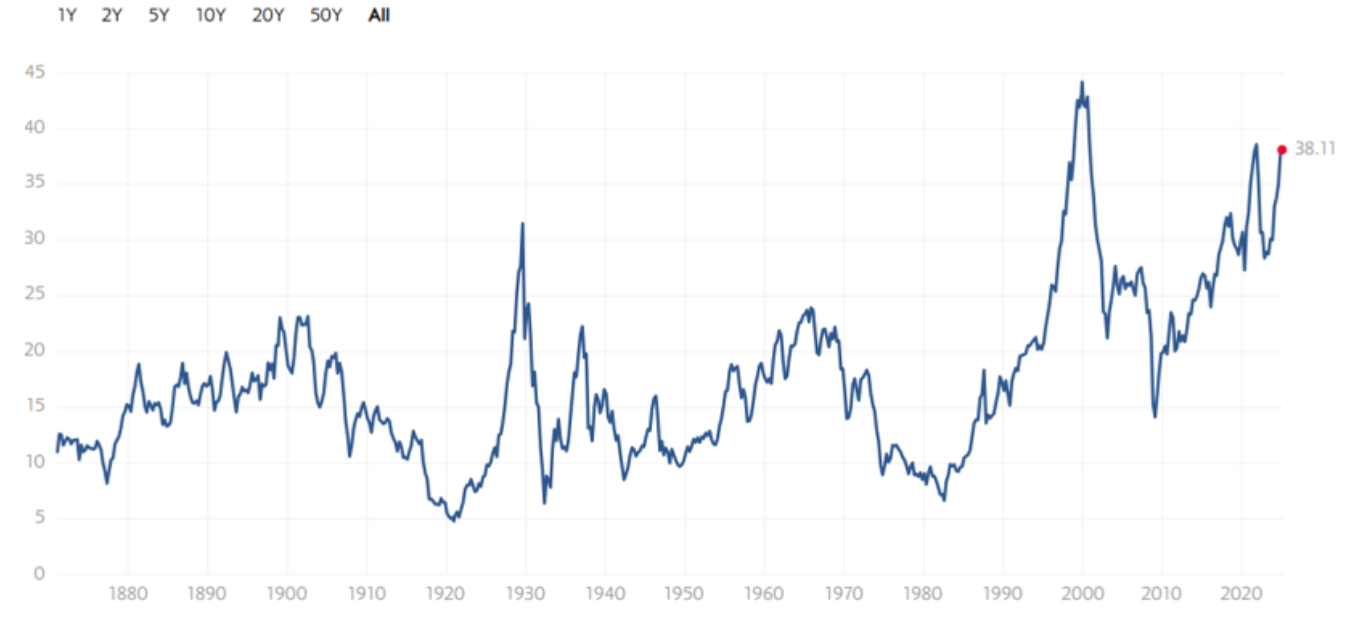
Note: We do not use CAPE as an official input into our methods. However, we think history serves as a guide and that it’s good to know where we are on the historic continuum. https://www.multpl.com/shiller-pe
The big picture: The ‘big picture’ is the (typically) years-long timeframe, the same timeframe in which Cyclical Bulls and Bears operate. The Sherman Portfolios DELTA-V Indicator measuring the Bull/Bear cycle finished the week in BULL status at 61.00, up 1.11% from the prior week’s 60.33. It has signaled Bull since April 21, 2023. The Sherman Portfolios DELTA-V Bond Indicator measuring the Bull/Bear cycle finished the week in BULL status at 47.89, up 0.80% from the prior week’s 47.51. It has signaled Bull since December 15, 2023.
The shorter term picture: GALACTIC SHIELD — POSITIVE for Q1 2025, positive prospects for equities in the first quarter of 2025. This indicator is based on the combination of U.S. and International Equities trend statuses at the start of each quarter. STARFLUX— POSITIVE, Starflux ended the week at 5.36 (up 155.24% last week) This short-term indicator measures U.S. Equities. STARPATH — POSITIVE, This indicator measures the interplay on dual timeframes of our Type 1s + the Russell 3000 + our four most ‘pro-cyclical’ Type 3s, vs. Cash.
The complete picture (four indicators across three timeframes): When all four of the Sherman Portfolios indicators are in a POSITIVE status, we read the market as being in a BULL MARKET.
1. DELTA-V — Positive
2. GALACTIC SHIELD — Positive
3. STARFLUX— Positive
4. STARPATH — Positive
THIS WEEK IN THE MARKETS
U.S. Markets: Stocks up after banking earnings and inflation data: Cooling inflation and strong bank earnings propelled U.S. stocks higher, helping major indexes recover from the previous week’s sharp sell-off. Value stocks outpaced growth shares by the widest weekly margin since September, supported by a strong performance in the energy sector as oil prices climbed and investors took profits in large-cap technology stocks. The financial sector also saw significant gains, with JPMorgan Chase, Goldman Sachs, Citigroup, and Wells Fargo reporting robust fourth-quarter earnings, driven by higher interest income and strong trading revenues. Markets reacted positively to the December inflation report, which showed core inflation (excluding food and energy) rising just 0.2%—the smallest increase since July—while the year-over-year rate slowed to 3.2% from 3.3% in November. Although the data is unlikely to prompt an immediate rate cut at the Federal Reserve’s January meeting, where markets expect rates to remain unchanged, it provided reassurance that inflation continues to trend downward, keeping the possibility of rate cuts later in the year alive. Investor optimism over cooling inflation and strong corporate earnings fueled a rally, with the S&P 500, Dow Jones Industrial Average, and Nasdaq Composite posting their largest one-day gains since the post-election surge in November.
Looking at the US Indexes:

The Dow Jones Industrial Average (DJIA) is the oldest continuing U.S. market index with over 100 years of history and is made up of 30 highly reputable “blue-chip” U.S. stocks (e.g. Coca-Cola Co., Microsoft). The Dow ended the week up 3.69% at 43,487.83 vs the prior week of 41,938.45.
The Nasdaq Composite Index tracks most of the stocks listed on the Nasdaq Stock Market – the second-largest stock exchange in the world. Over half of all stocks on the NASDAQ are tech stocks. The tech-driven Nasdaq ended the week up 2.45%, closing at 19,630.20 vs. the prior week of 19,161.63.
The S&P 500 large-cap index is a market-capitalization-weighted index of 500 leading publicly traded companies in the U.S. The S&P 500 is regarded as one of the best gauges of prominent American equities’ performance, and by extension, that of the stock market overall. The S&P 500 ended the week up 2.91%, closing at 5996.66 compared to last week’s 5827.04.
The S&P 400 mid-cap index is the benchmark index made up of 400 stocks that broadly represent companies with midrange market capitalization between $3.6 billion and $13.1 billion. It is used by investors as a gauge for market performance and directional trends in U.S. stocks. The S&P 400 mid-cap ended the week up 4.53%, closing at 3239.76 compared to last week’s 3099.47.
The Russell 2000 (RUT) small-cap index measures the performance of the 2,000 smaller companies included in the Russell 3000 Index. The Russell 2000 is managed by London’s FTSE Russell Group and is widely regarded as a leading indicator of the U.S. economy because of its focus on smaller companies that focus on the U.S. market. The Russel 2000 ended the week up 3.96%, closing at 2275.88 compared to last week’s 2189.23
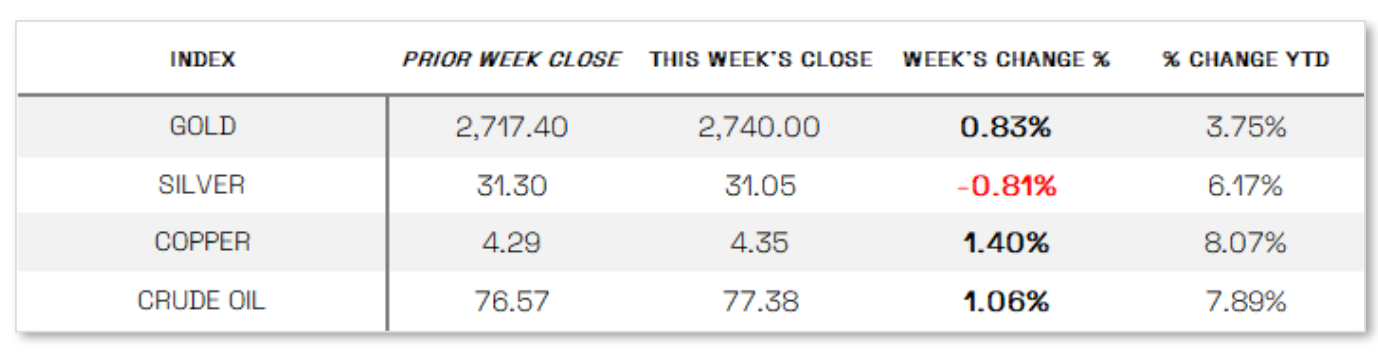
U.S. Commodities/Futures:
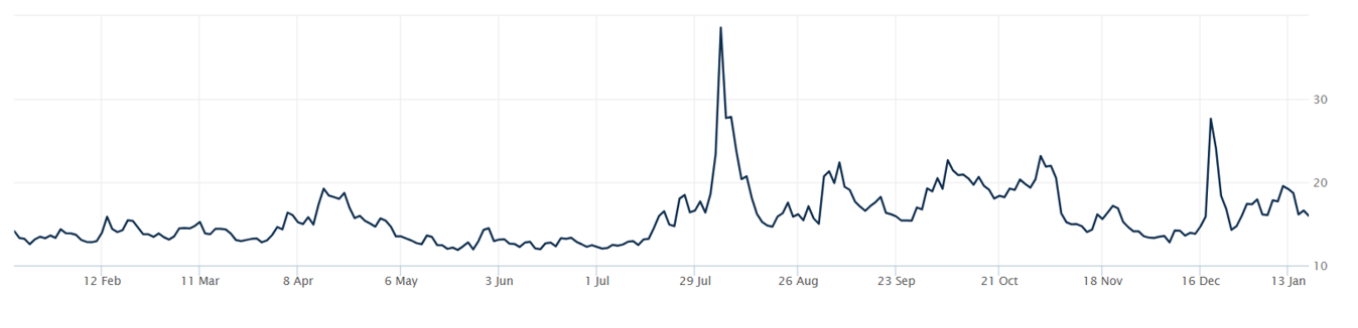
THE VOLATILITY INDEX (VIX) closed at 15.97 this week, an 18.3% decrease vs last week’s close of 19.54.
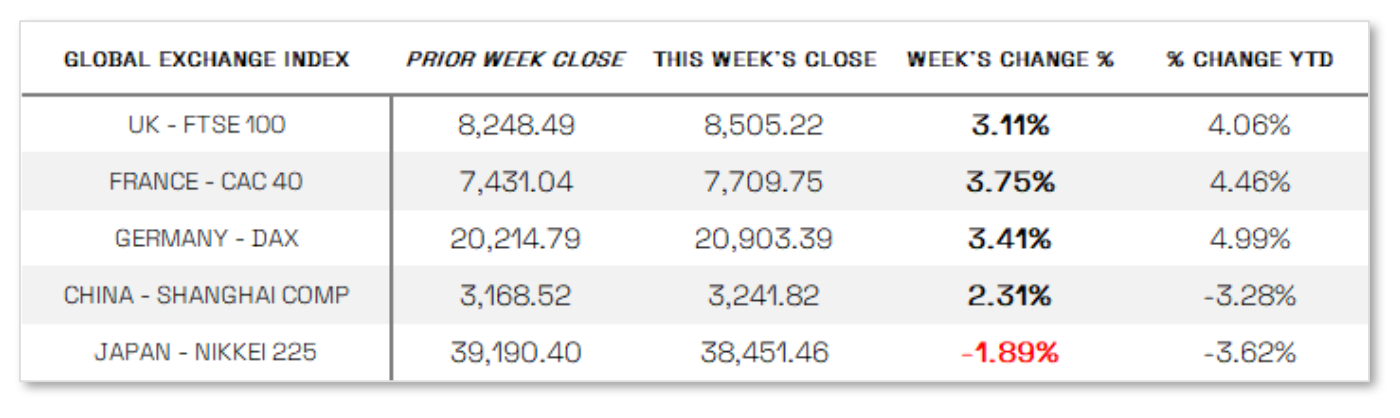
International Markets:
THIS WEEK’S ECONOMIC NEWS
U.S. Economic News: Mixed economic data: U.S. retail sales rose 0.4% in December, falling short of the 0.6% consensus estimate but still marking a solid gain after November’s 0.8% increase, with ten of thirteen categories reporting growth, including strong performances in sporting goods, furniture, and clothing stores. Control group sales, which exclude volatile categories like building materials and automobiles, climbed 0.7%, the largest increase in three months. Meanwhile, jobless claims for the week ending January 11 rose to 217,000 from 203,000, surpassing expectations, though the four-week average saw a slight decline. Continuing claims also edged lower to 1.86 million from 1.88 million, suggesting a still-resilient labor market despite the uptick in new unemployment applications.
International Economic News: EUROPE: The pan-European STOXX Europe 600 Index climbed 2.37% as slower-than-expected inflation in both the U.S. and Europe fueled hopes for continued central bank rate cuts, driving major stock indexes higher, with France’s CAC 40 up 3.75%, Germany’s DAX rising 3.41%, Italy’s FTSE MIB gaining 3.36%, and the UK’s FTSE 100 advancing 3.11%. In the UK, inflation unexpectedly slowed to 2.5% in December from 2.6% in November, reinforcing expectations of an imminent Bank of England rate cut, while core and services inflation also declined. However, GDP growth remained weak, rising just 0.1% in November after two months of contraction, with retail sales volumes falling 0.3% in December instead of the expected 0.4% gain. Meanwhile, Germany’s economy contracted by 0.2% in 2024 for a second consecutive year, driven by declining investment, though partially offset by a rebound in private and government spending.
JAPAN: Japan’s stock markets declined over the week, with the Nikkei 225 falling 1.89% and the TOPIX Index down 1.3%, as hawkish signals from Bank of Japan (BoJ) officials heightened expectations of a potential rate hike at the January 23–24 policy meeting. The prospect of tightening monetary policy strengthened the yen to approximately JPY 155.6 per U.S. dollar, up from JPY 157.6 the previous week, which in turn pressured Japan’s export-heavy industries by dimming their profit outlook. In the bond market, the yield on the 10-year Japanese government bond briefly surged to a 14-year high of 1.25% before settling at 1.20%. BoJ Governor Kazuo Ueda reinforced the central bank’s tightening bias, stating that rates will rise if economic and price conditions continue improving, though concerns over U.S. fiscal and trade policies suggest a rate hike may be delayed until March or April. Meanwhile, Japan’s real wage growth—a key metric for consumer purchasing power—declined 0.3% year over year in November, marking the fourth consecutive month of negative growth, which the BoJ continues to monitor as a critical factor in its rate decision.
CHINA: Chinese equities advanced as economic data showed improvement despite ongoing deflationary pressures, with the Shanghai Composite Index rising 2.31% and the CSI 300 gaining 2.14%, while Hong Kong’s Hang Seng Index climbed 2.73%. GDP growth exceeded expectations, expanding 5.4% year over year in the fourth quarter, up from 4.6% in the prior quarter, while full-year growth reached 5%, meeting Beijing’s target. Industrial production surged 6.2% in December, aided by stronger auto, computer, and solar cell sales, while retail sales grew 3.7%, accelerating from November’s 3% increase. Fixed asset investment edged up 3.2% for the year, though property investment contracted further, falling 10.6% year over year, and the unemployment rate ticked up to 5.1%. Meanwhile, the property market showed signs of stabilization, with new home prices in 70 cities remaining flat in December after declining 0.1% in November—the fourth consecutive month of slower declines—following Beijing’s aggressive monetary and fiscal stimulus measures aimed at reviving economic momentum and shoring up the struggling housing sector.
Sources:
>> All index and returns data from Norgate Data and Commodity Systems Incorporated and Wall Street Journal.
>> News from Reuters, Barron’s, Wall St. Journal, Bloomberg.com, ft.com, guggenheimpartners.com, zerohedge.com, ritholtz.com, markit.com, financialpost.com, Eurostat, Statistics Canada, Yahoo! Finance, stocksandnews.com, marketwatch.com, visualcapitalist.com, wantchinatimes.com, BBC, 361capital.com, pensionpartners.com, cnbc.com, FactSet, Morningstar/Ibbotson Associates, Corporate Finance Institute.
>> Commentary from T Rowe Price Global markets weekly update — https://www.troweprice.com/personal-investing/resources/insights/global-markets-weekly-update.html
Disclosures: This material and any mention of specific investments is provided for informational purposes only and is not intended to be investment advice or a recommendation to take any action. The forecasts or forward-looking statements are based on assumptions, may not materialize, and are subject to revision without notice. The market indexes discussed are unmanaged, and generally, considered representative of their respective markets. Index performance is not indicative of the past performance of a particular investment. Indexes do not incur management fees, costs, and expenses. Individuals cannot directly invest in unmanaged indexes. Past performance does not guarantee future results.
