


The very big picture (a historical perspective): The CAPE is now at 37.74.
The long-term valuation of the market is commonly measured by the Cyclically Adjusted Price to Earnings ratio, or “CAPE”, which smooths-out shorter-term earnings swings in order to get a longer-term assessment of market valuation. In the past, the CAPE ratio has proved its importance in identifying potential bubbles and market crashes. An extremely high CAPE ratio means that a company’s stock price is substantially higher than the company’s earnings would indicate and, therefore, overvalued. It is generally expected that the market will eventually correct the company’s stock price by pushing it down to its true value. The historical average of the ratio for the S&P 500 Index is between 15-16, while the highest levels of the ratio have exceeded 30.
The record-high levels occurred three times in the history of the U.S. financial markets. The first was in 1929 before the Wall Street crash that signaled the start of the Great Depression. The second was in the late 1990s before the Dotcom Crash, and the third came in 2007 before the 2007-2008 Financial Crisis. https://www.multpl.com/shiller-pe
HISTORY OF THE CAPE VALUE FROM 1871 TO PRESENT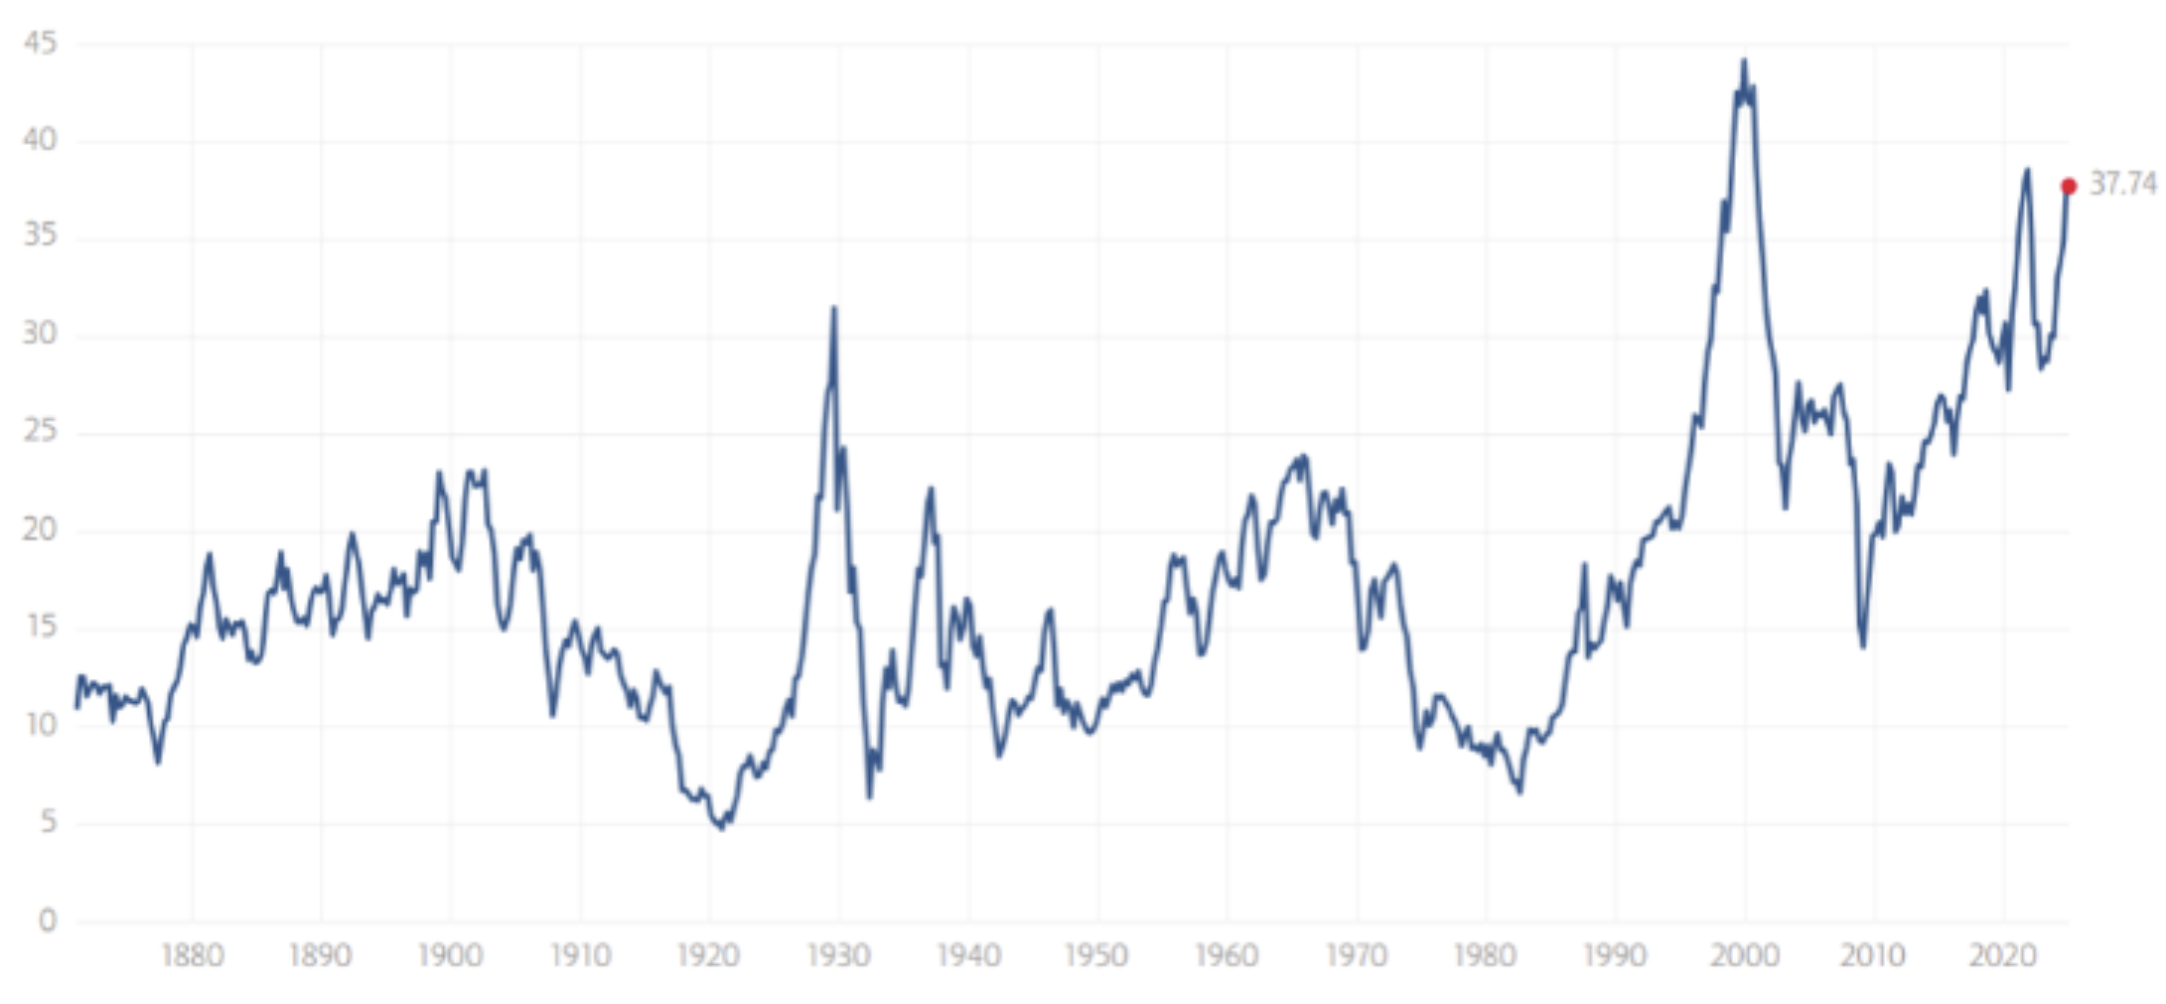
Note: We do not use CAPE as an official input into our methods. However, we think history serves as a guide and that it’s good to know where we are on the historic continuum. https://www.multpl.com/shiller-pe
The big picture: The ‘big picture’ is the (typically) years-long timeframe, the same timeframe in which Cyclical Bulls and Bears operate. The Sherman Portfolios DELTA-V Indicator measuring the Bull/Bear cycle finished the week in BULL status at 63.99, down 3.48% from the prior week’s 66.3. It has signaled Bull since April 21, 2023. The Sherman Portfolios DELTA-V Bond Indicator measuring the Bull/Bear cycle finished the week in BULL status at 48.70, down 1.16% from the prior week’s 49.50. It has signaled Bull since December 15, 2023.
The shorter term picture: GALACTIC SHIELD — POSITIVE, for Q1 2025 indicating positive prospects for equities in the first quarter of 2025. This indicator is based on the combination of U.S. and International Equities trend statuses at the start of each quarter. STARFLUX— POSITIVE, Starflux ended the week at 4.20 (down 7.08% last week) This short-term indicator measures U.S. Equities. STARPATH — POSITIVE, This indicator measures the interplay on dual timeframes of our Type 1s + the Russell 3000 + our four most ‘pro-cyclical’ Type 3s, vs. Cash.
The complete picture (four indicators across three timeframes): When all four of the Sherman Portfolios indicators are in a POSITIVE status, we read the market as being in a BULL MARKET.
1. DELTA-V — Positive
2. GALACTIC SHIELD — Positive
3. STARFLUX— Positive
4. STARPATH — Positive
THIS WEEK IN THE MARKETS
U.S. Markets: Stocks finish up after a short week: Major stock indexes ended the holiday-shortened week mixed, with broad gains on Friday helping to recover from earlier declines, attributed partly to profit-taking as the year wound down. Despite a year-end slump in U.S. equities, with around 70% of December trading sessions seeing more decliners than advancers, 2024 concluded as a strong year for the markets. The S&P 500 Index posted its second consecutive annual gain of over 20%, marking the best two-year stretch in 25 years, while the Nasdaq Composite also gained over 20% for the sixth time in the past eight years.
Looking at the US Indexes:
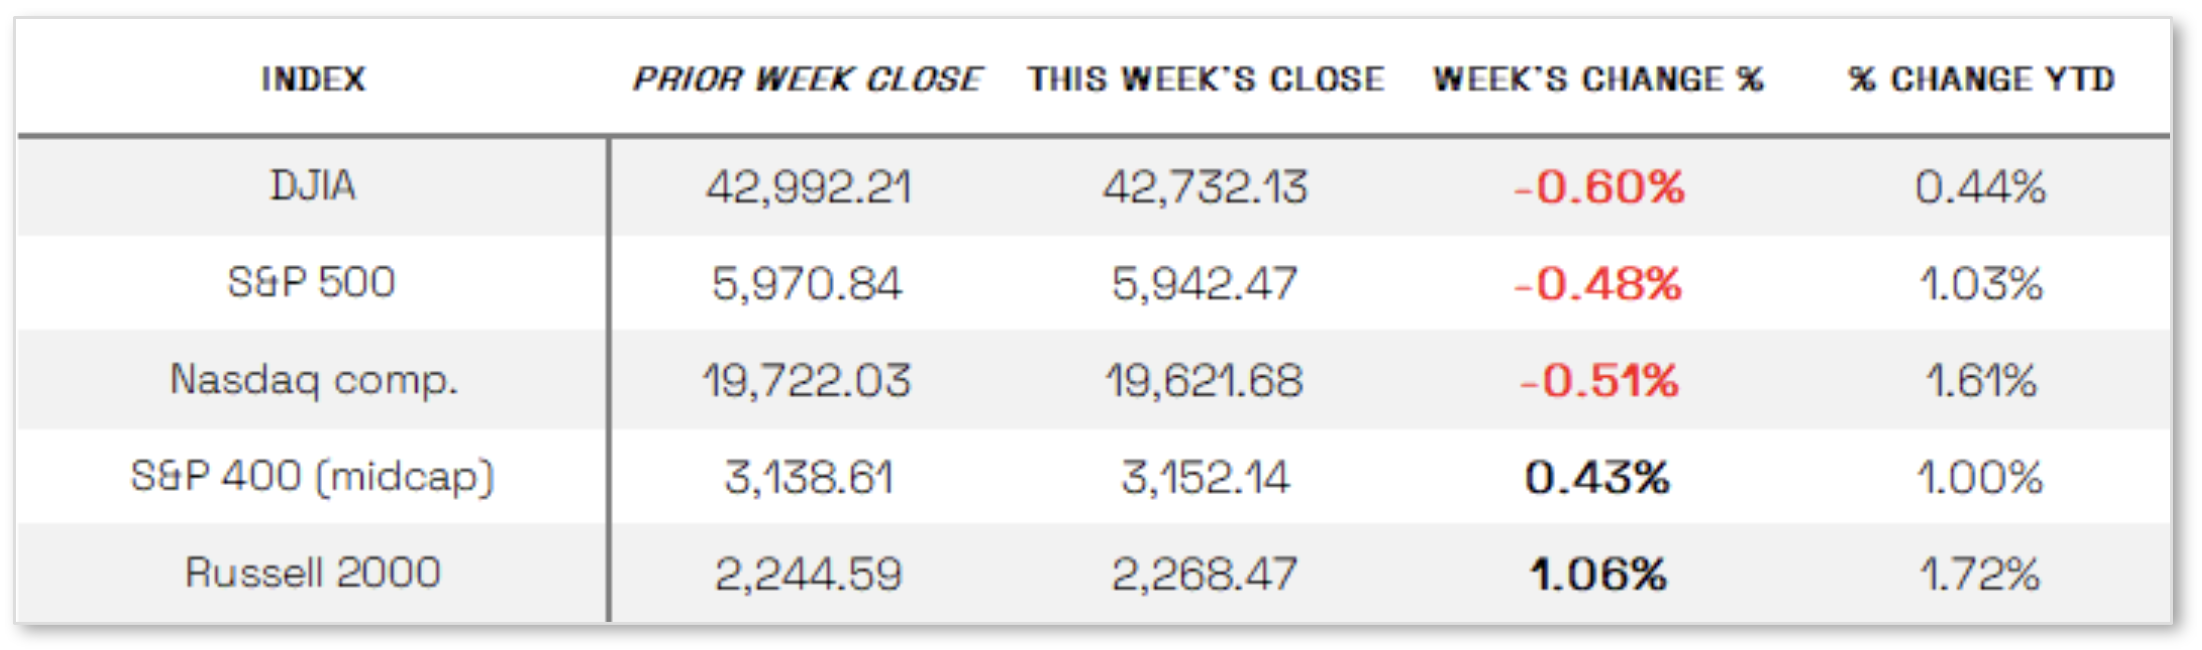
The Dow Jones Industrial Average (DJIA) is the oldest continuing U.S. market index with over 100 years of history and is made up of 30 highly reputable “blue-chip” U.S. stocks (e.g. Coca-Cola Co., Microsoft). The Dow ended the week down 0.60% at 42,732.13 vs the prior week of 42,992.21.
The Nasdaq Composite Index tracks most of the stocks listed on the Nasdaq Stock Market – the second-largest stock exchange in the world. Over half of all stocks on the NASDAQ are tech stocks. The tech-driven Nasdaq ended the week down 0.51%, closing at 19,621.68 vs. the prior week of 19,722.03.
The S&P 500 large-cap index is a market-capitalization-weighted index of 500 leading publicly traded companies in the U.S. The S&P 500 is regarded as one of the best gauges of prominent American equities’ performance, and by extension, that of the stock market overall. The S&P 500 ended the week down 0.48%, closing at 5942.47 compared to last week’s 5970.84.
The S&P 400 mid-cap index is the benchmark index made up of 400 stocks that broadly represent companies with midrange market capitalization between $3.6 billion and $13.1 billion. It is used by investors as a gauge for market performance and directional trends in U.S. stocks. The S&P 400 mid-cap ended the week up 0.43%, closing at 3152.14 compared to last week’s 3138.61.
The Russell 2000 (RUT) small-cap index measures the performance of the 2,000 smaller companies included in the Russell 3000 Index. The Russell 2000 is managed by London’s FTSE Russell Group and is widely regarded as a leading indicator of the U.S. economy because of its focus on smaller companies that focus on the U.S. market. The Russel 2000 ended the week up 1.06%, closing at 2268.47 compared to last week’s 2244.59.
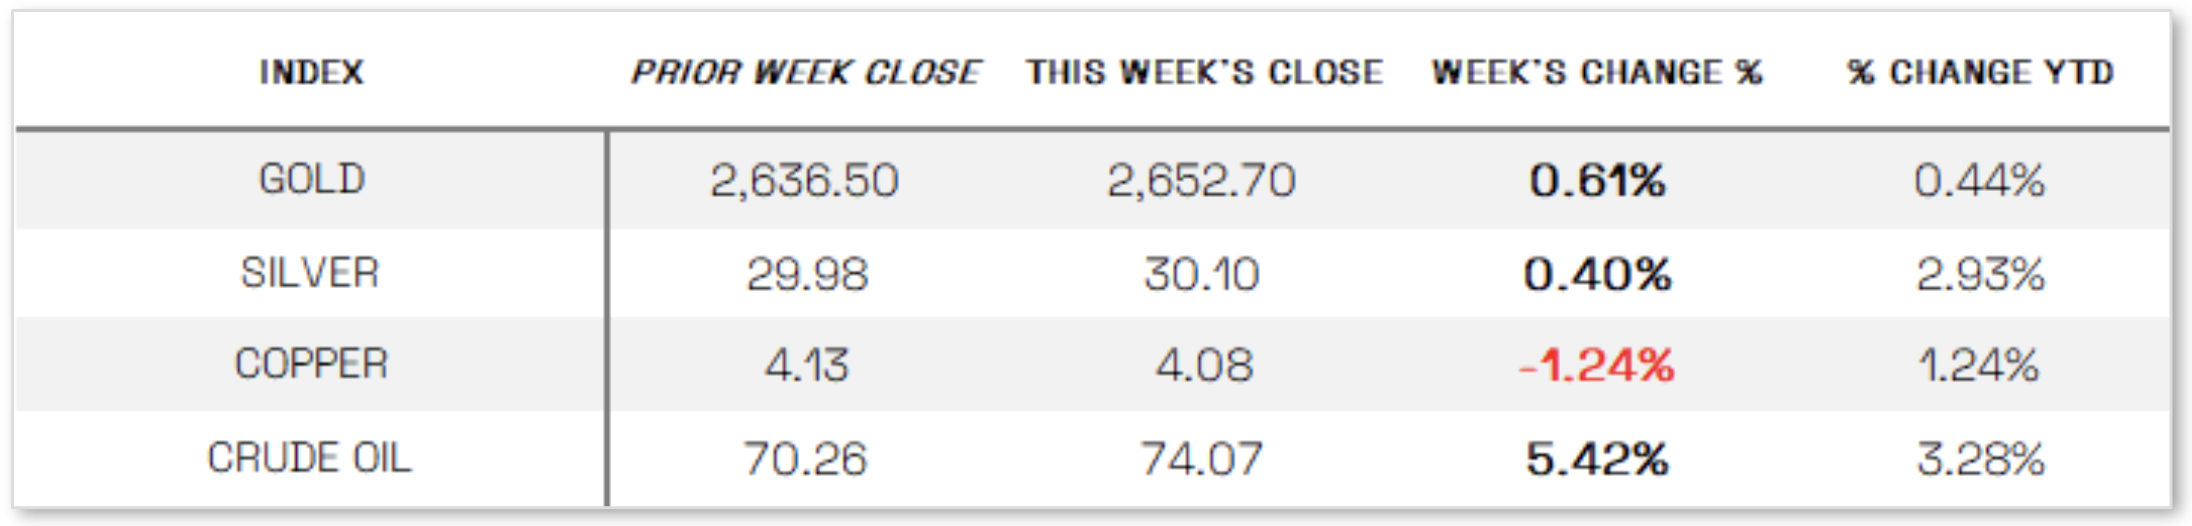
U.S. Commodities/Futures:
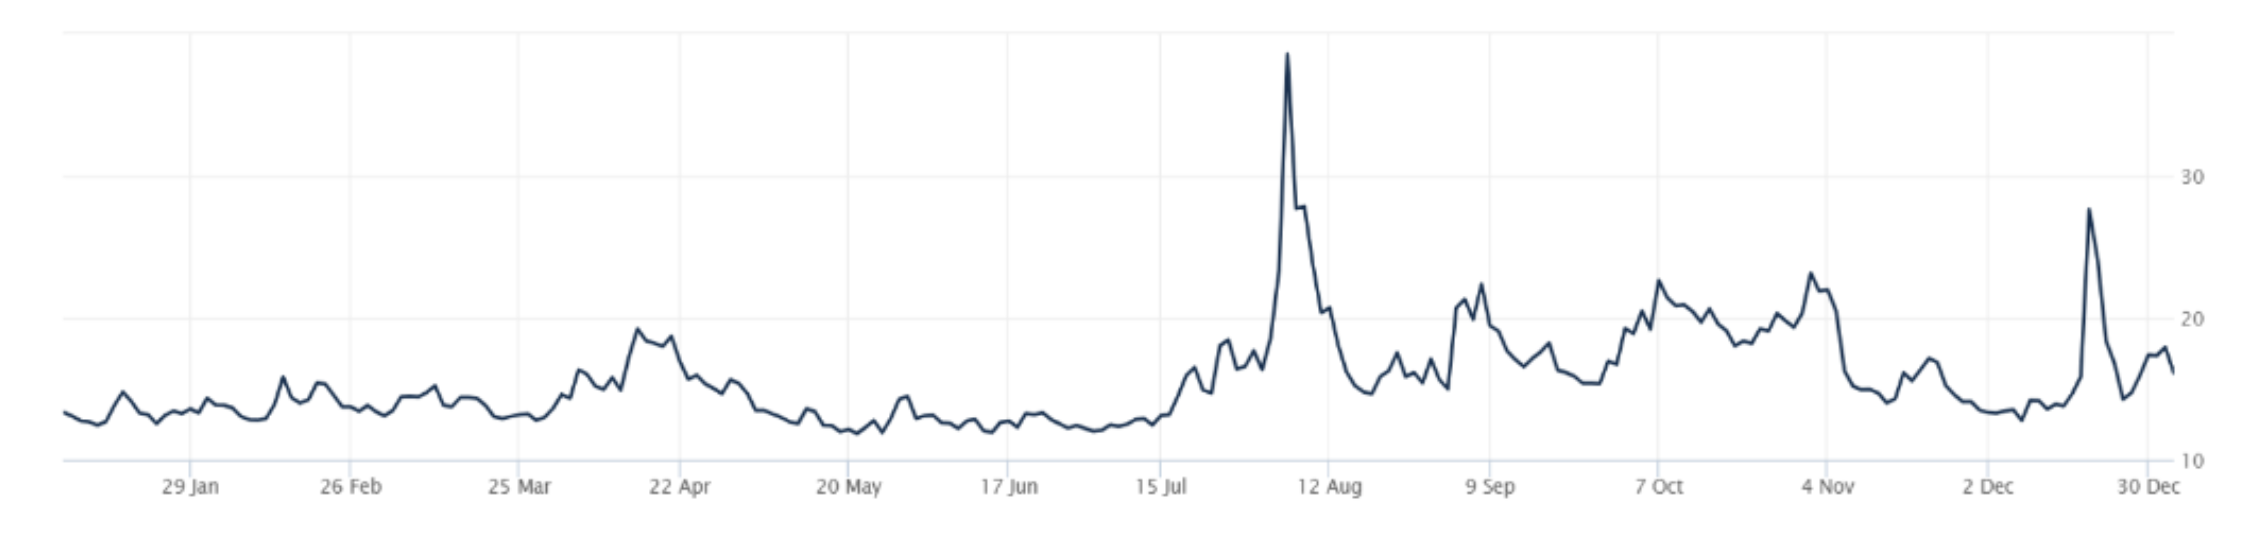
THE VOLATILITY INDEX (VIX) closed at 16.13 this week, a 1.1% increase vs last week’s close of 15.95
 International Markets:
THIS WEEK’S ECONOMIC NEWS
U.S. Economic News: Negative Economic Data: In a quiet week for economic data around the New Year’s holiday, the Chicago PMI grabbed attention on Monday, dropping to 36.9 in December—well below expectations of 42.9 and down from 40.2 in November—marking the 13th consecutive month of contraction and the steepest monthly decline since May. Stocks fell on Thursday, the first trading day of the year, partly due to the Atlanta Fed lowering its fourth-quarter GDP forecast from 3.1% to 2.6%, citing weaker-than-expected private investment growth. Broader sentiment was also weighed down by Tesla missing fourth-quarter delivery expectations and declining iPhone shipments to China, which caused Apple shares to fall 2.62%. On a brighter note, the Labor Department reported initial jobless claims fell to 211,000 for the week ended December 28—the lowest in eight months—while continuing claims dropped to a three-month low of 1.84 million.
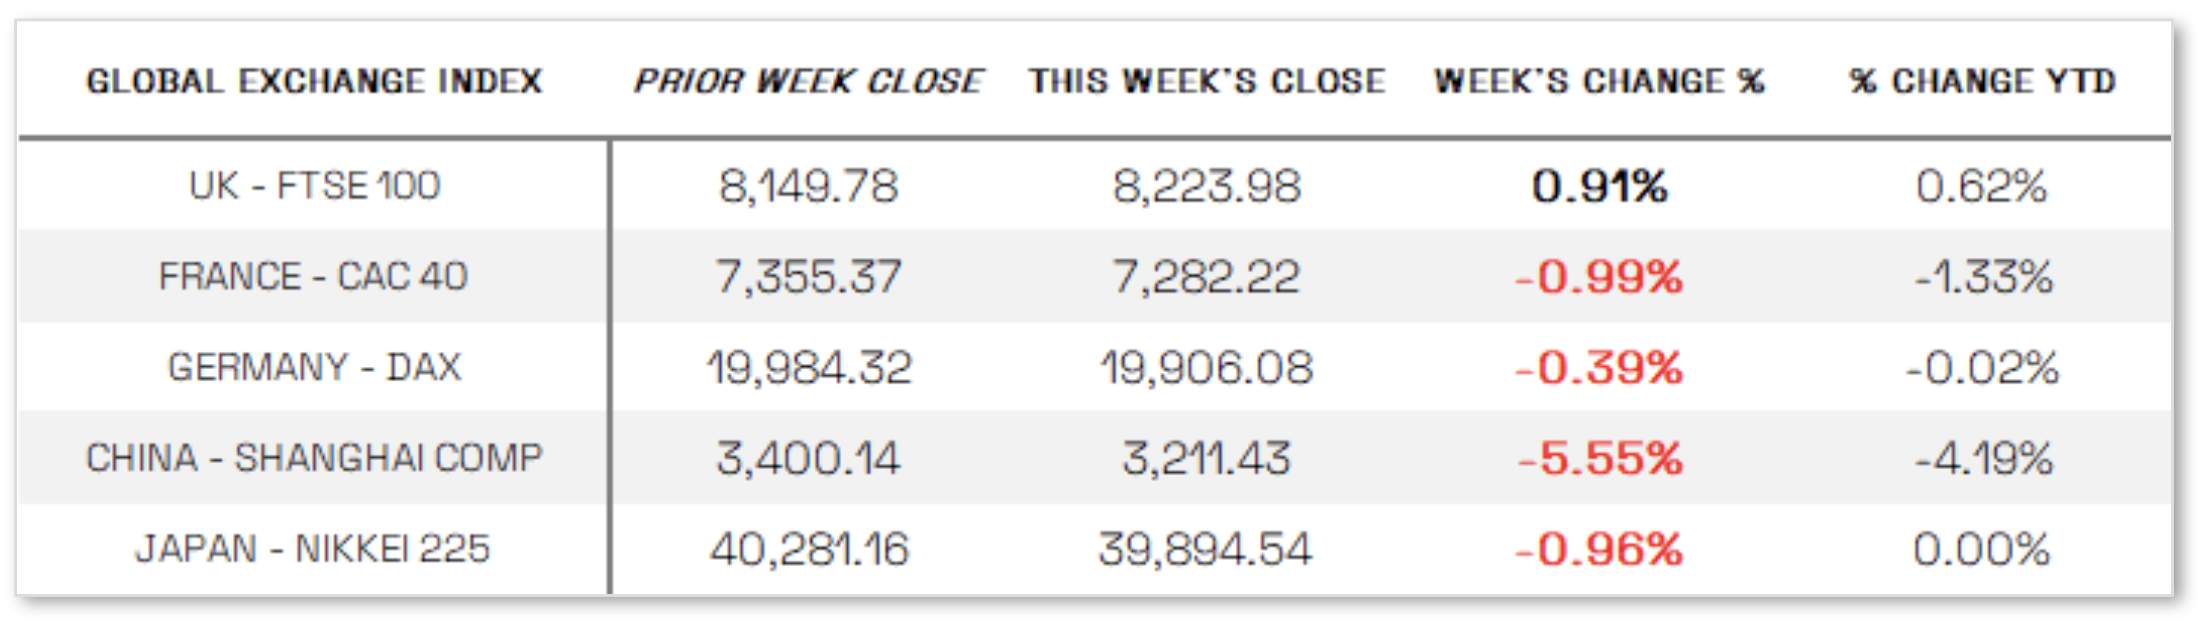
International Economic News: EUROPE: The pan-European STOXX Europe 600 Index edged up 0.20% in local currency terms amid thin trading volume and limited news flow, while major stock indexes showed mixed performance. Germany’s DAX fell 0.39%, France’s CAC 40 dropped 0.99%, and Italy’s FTSE MIB declined modestly, while the UK’s FTSE 100 gained 0.91%, supported by a weaker British pound, which benefited multinational companies with overseas revenue. On the macroeconomic front, Spain’s preliminary consumer price inflation for December surpassed forecasts, with annual inflation accelerating to 2.8% from 2.4% in November, driven by higher fuel costs, while core inflation also rose to 2.6% from 2.4%. The stronger inflation figures bolstered hawkish arguments within the European Central Bank (ECB) for a cautious approach to rate cuts, with Governing Council member Robert Holzmann emphasizing the risks of rising energy prices and potential euro devaluation. However, ECB President Christine Lagarde maintained that inflation was on track to reach the 2% target by 2025, supporting a gradual downward trajectory for interest rates.
JAPAN: Japan’s stock markets ended lower in a holiday-shortened week as signs of profit-taking emerged, with the Nikkei 225 Index dropping nearly 1% on Monday, the final trading day of 2024, to close at 39,894.54—its highest year-end level ever—after posting an annual gain of nearly 20%, driven by share buybacks, corporate governance reforms, and a weaker yen that supported exporters. The broader TOPIX Index fell 0.6%, trimming its yearly gain to 17.6%. The yen remained steady near JPY 157 on Friday, down about 11% for the year, as traders monitored potential Bank of Japan (BoJ) intervention. The 10-year Japanese government bond yield edged lower to 1.09% but stayed near a 13.5-year high, reflecting uncertainty about the BoJ’s interest rate outlook following an uptick in Tokyo’s consumer price inflation and discussions of a possible rate hike at the central bank’s recent policy meeting. Meanwhile, the au Jibun Bank Japan Manufacturing PMI showed factory activity contracted for a sixth consecutive month in December, though at a slower pace, with a final reading of 49.6 versus November’s 49.0, as firms reported stabilizing new orders and rising input and output prices.
CHINA: Chinese stocks fell as weaker-than-expected manufacturing data dampened investor sentiment, with the Shanghai Composite Index dropping 5.55%, the blue-chip CSI 300 falling 5.17%, and Hong Kong’s Hang Seng Index losing 1.64%, according to FactSet. Although China’s factory activity expanded for the third consecutive month, the official manufacturing PMI edged down to 50.1 in December from 50.3 in November, missing forecasts but staying above the 50-mark that separates growth from contraction. Meanwhile, the non-manufacturing PMI, which measures construction and services activity, improved to 52.2 from November’s 50, exceeding expectations. In the housing market, new home sales by the top 100 developers were flat year over year in December, compared with a 6.9% decline in November, while month-on-month sales rose 24.2%. Despite a 28.1% annual drop in sales for 2024, the data suggested a potential turnaround in the housing sector, supported by Beijing’s rescue package introduced in late September.
Sources:
>> All index and returns data from Norgate Data and Commodity Systems Incorporated and Wall Street Journal.
>> News from Reuters, Barron’s, Wall St. Journal, Bloomberg.com, ft.com, guggenheimpartners.com, zerohedge.com, ritholtz.com, markit.com, financialpost.com, Eurostat, Statistics Canada, Yahoo! Finance, stocksandnews.com, marketwatch.com, visualcapitalist.com, wantchinatimes.com, BBC, 361capital.com, pensionpartners.com, cnbc.com, FactSet, Morningstar/Ibbotson Associates, Corporate Finance Institute.
>> Commentary from T Rowe Price Global markets weekly update — https://www.troweprice.com/personal-investing/resources/insights/global-markets-weekly-update.html
Disclosures: This material and any mention of specific investments is provided for informational purposes only and is not intended to be investment advice or a recommendation to take any action. The forecasts or forward-looking statements are based on assumptions, may not materialize, and are subject to revision without notice. The market indexes discussed are unmanaged, and generally, considered representative of their respective markets. Index performance is not indicative of the past performance of a particular investment. Indexes do not incur management fees, costs, and expenses. Individuals cannot directly invest in unmanaged indexes. Past performance does not guarantee future results.
