


The very big picture (a historical perspective): The CAPE is now at 36.84–Up 3.63% this month.
The long-term valuation of the market is commonly measured by the Cyclically Adjusted Price to Earnings ratio, or “CAPE”, which smooths-out shorter-term earnings swings in order to get a longer-term assessment of market valuation. In the past, the CAPE ratio has proved its importance in identifying potential bubbles and market crashes. An extremely high CAPE ratio means that a company’s stock price is substantially higher than the company’s earnings would indicate and, therefore, overvalued. It is generally expected that the market will eventually correct the company’s stock price by pushing it down to its true value. The historical average of the ratio for the S&P 500 Index is between 15-16, while the highest levels of the ratio have exceeded 30.
The record-high levels occurred three times in the history of the U.S. financial markets. The first was in 1929 before the Wall Street crash that signaled the start of the Great Depression. The second was in the late 1990s before the Dotcom Crash, and the third came in 2007 before the 2007-2008 Financial Crisis. https://www.multpl.com/shiller-pe
HISTORY OF THE CAPE VALUE FROM 1871 TO PRESENT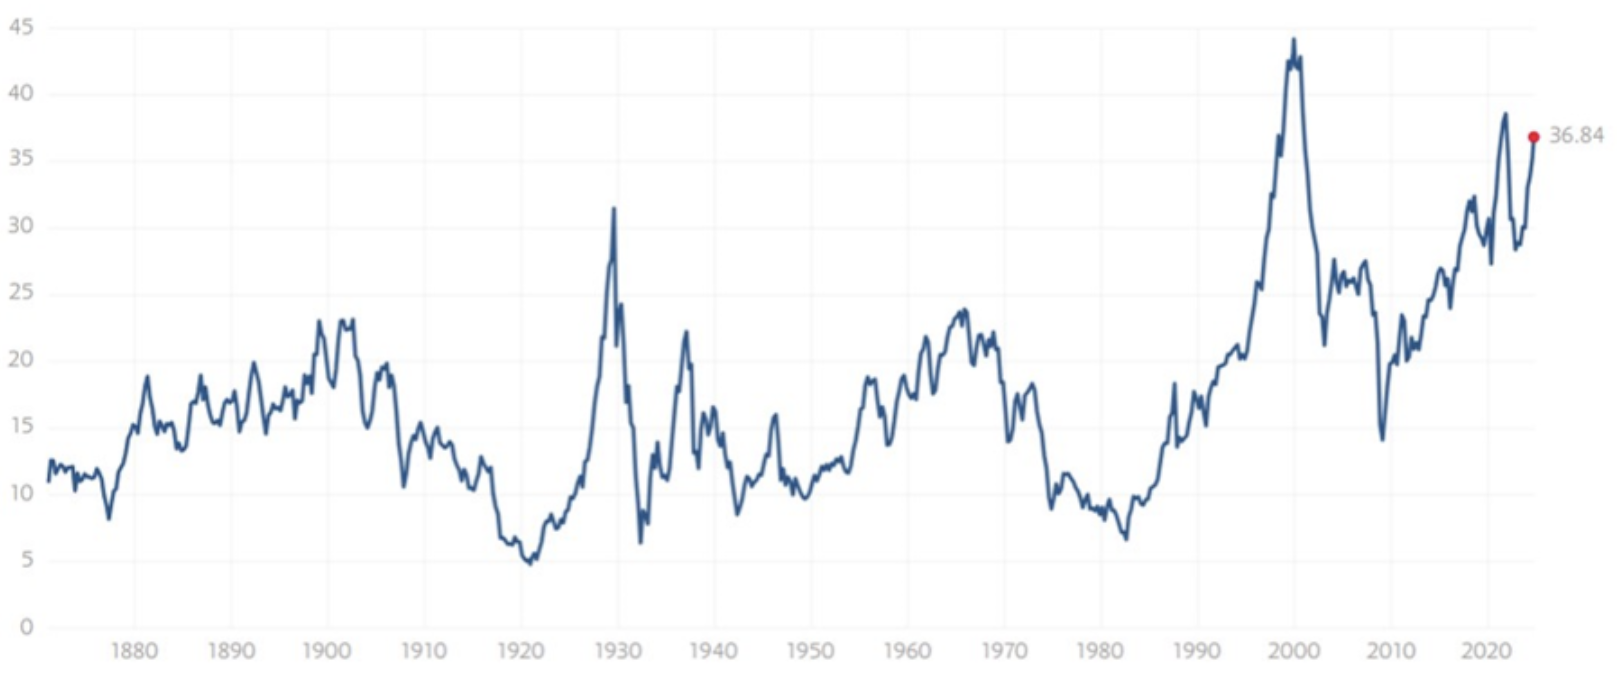
Note: We do not use CAPE as an official input into our methods. However, we think history serves as a guide and that it’s good to know where we are on the historic continuum. https://www.multpl.com/shiller-pe
The big picture: The ‘big picture’ is the (typically) years-long timeframe, the same timeframe in which Cyclical Bulls and Bears operate. The Sherman Portfolios DELTA-V Indicator measuring the Bull/Bear cycle finished the week in BULL status at 71.36, up 1.45% from the prior week’s 70.34. It has signaled Bull since April 21, 2023. The Sherman Portfolios DELTA-V Bond Indicator measuring the Bull/Bear cycle finished the week in BULL status at 70.90, down 2.72% from the prior week’s 72.88 It has signaled Bull since December 15, 2023.
The shorter term picture: GALACTIC SHIELD — POSITIVE for Q3 2024 indicating positive prospects for equities in the third quarter of 2024. This indicator is based on the combination of U.S. and International Equities trend statuses at the start of each quarter. STARFLUX— POSITIVE. Starflux ended the week at 8.52 (down 5.22% last week) This short-term indicator measures U.S. Equities. STARPATH — POSITIVE. This indicator measures the interplay on dual timeframes of our Type 1s + the Russell 3000 + our four most ‘pro-cyclical’ Type 3s, vs. Cash.
The complete picture (four indicators across three timeframes): When all four of the Sherman Portfolios indicators are in a POSITIVE status, we read the market as being in a CYCLICAL BULL MARKET.
1. DELTA-V — Positive
2. GALACTIC SHIELD — Positive
3. STARFLUX— Positive
4. STARPATH — Positive
THIS WEEK IN THE MARKETS
U.S. Markets: Stocks up due to AI and China’s Stimulus. Stocks surged to record highs this week, driven by optimism surrounding China’s new stimulus measures and growing demand for artificial intelligence (AI). The Dow Jones Industrial Average and S&P 500 Index benefited from strong performance in chemicals and materials stocks, fueled by hopes for a rebound in Chinese demand, while rising copper prices signaled a potential recovery in global industrial activity. Technology stocks outperformed as reports of a possible Intel takeover and NVIDIA’s CEO halting stock sales boosted sentiment, with Micron Technology’s positive AI demand outlook providing further momentum. However, U.S. consumer confidence fell sharply in August, according to the Conference Board, raising concerns about potential recession indicators. Mixed housing data also emerged, as new home sales declined in August, although a drop in mortgage rates led to a surge in refinancing activity, as reflected by the highest Mortgage Refinance Index since April 2022.
Looking at the US Indexes:
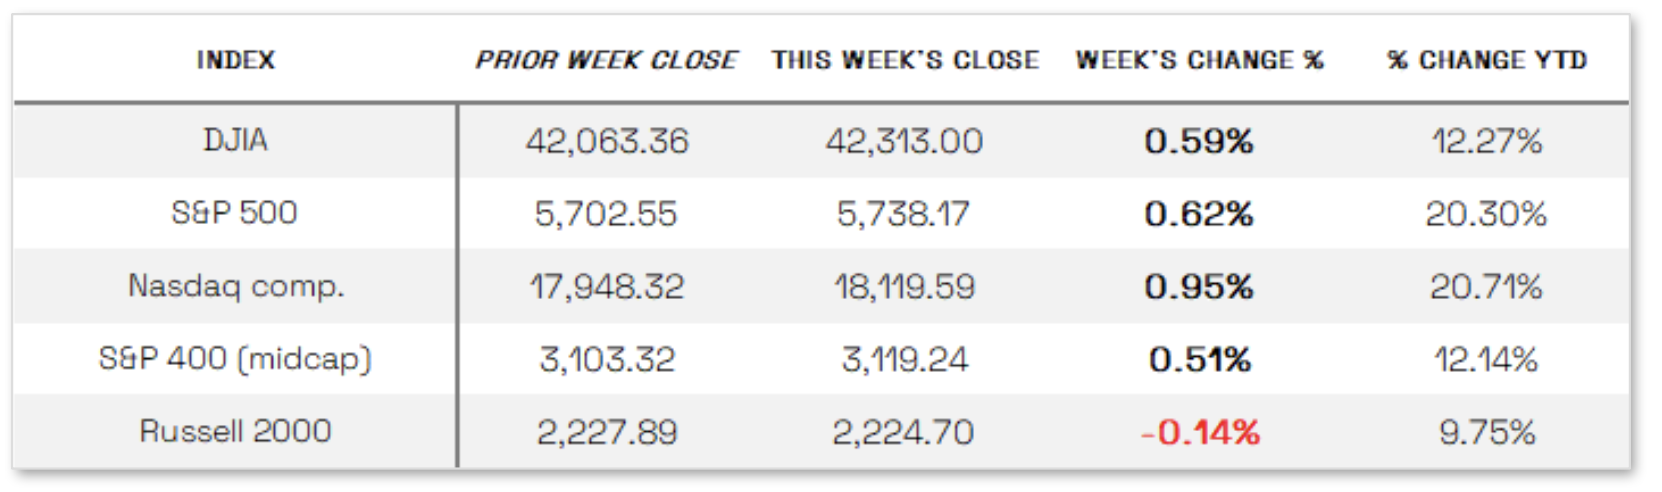
The Dow Jones Industrial Average (DJIA) is the oldest continuing U.S. market index with over 100 years of history and is made up of 30 highly reputable “blue-chip” U.S. stocks (e.g. Coca-Cola Co., Microsoft). The Dow ended the week up 0.59% at 42,313.00 vs the prior week of 42,063.36.
The Nasdaq Composite Index tracks most of the stocks listed on the Nasdaq Stock Market – the second-largest stock exchange in the world. Over half of all stocks on the NASDAQ are tech stocks. The tech-driven Nasdaq ended the week up 0.95%, closing at 18,119.59 vs. the prior week of 17,948.32
The S&P 500 large-cap index is a market-capitalization-weighted index of 500 leading publicly traded companies in the U.S. The S&P 500 is regarded as one of the best gauges of prominent American equities’ performance, and by extension, that of the stock market overall. The S&P 500 ended the week up 0.62%, closing at 5738.17 compared to last week’s 5702.55.
The S&P 400 mid-cap index is the benchmark index made up of 400 stocks that broadly represent companies with midrange market capitalization between $3.6 billion and $13.1 billion. It is used by investors as a gauge for market performance and directional trends in U.S. stocks. The S&P 400 mid-cap ended the week up 0.51%, closing at 3103.32 compared to last week’s 3034.34.
The Russell 2000 (RUT) small-cap index measures the performance of the 2,000 smaller companies included in the Russell 3000 Index. The Russell 2000 is managed by London’s FTSE Russell Group and is widely regarded as a leading indicator of the U.S. economy because of its focus on smaller companies that focus on the U.S. market. The Russel 2000 ended the week down 0.14%, closing at 2224.70 compared to last week’s 2227.89.
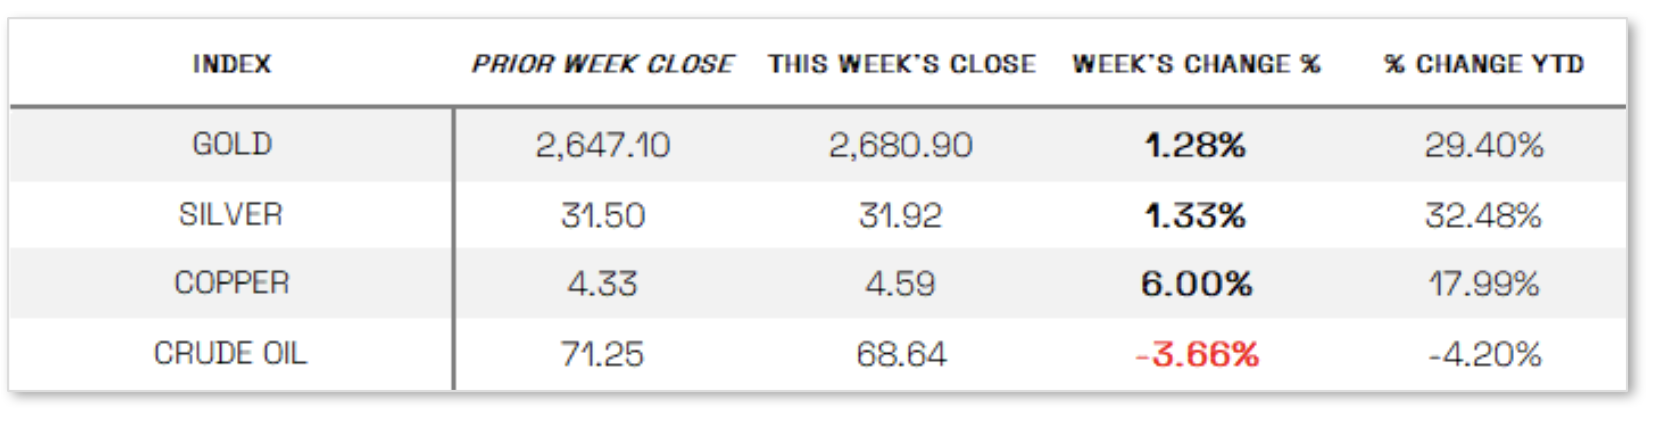
U.S. Commodities/Futures:
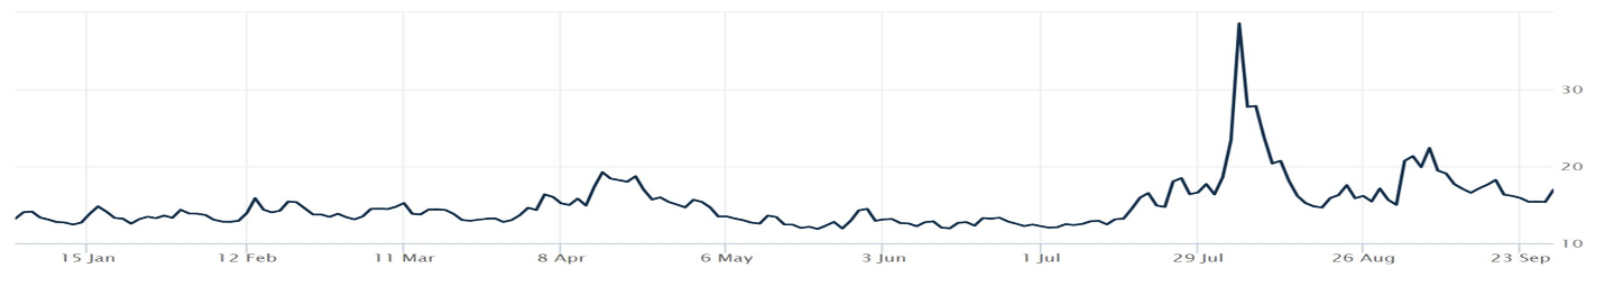
THE VOLATILITY INDEX (VIX) closed at 16.96 this week, a 5.0% Increase vs last week’s close of 16.15.
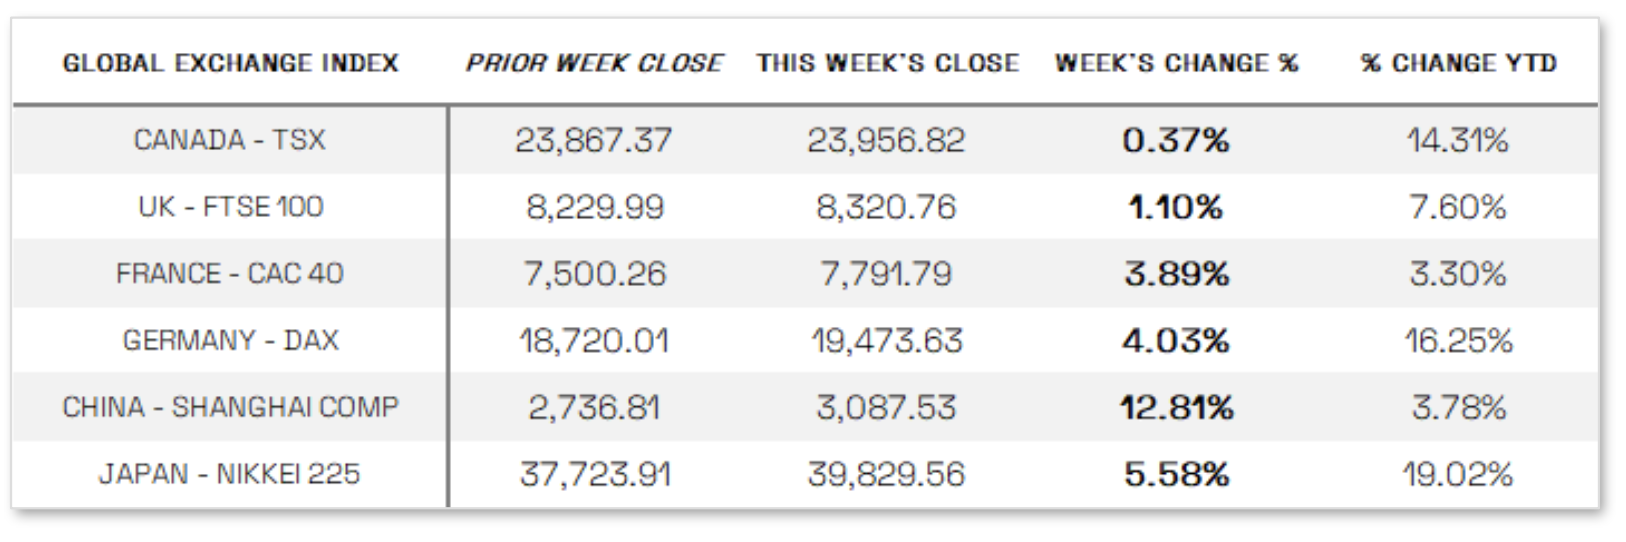
 International Markets:
THIS WEEK’S ECONOMIC NEWS
U.S. Economic News: Inflation nears Fed’s target. Benign inflation data helped drive an early rally on Friday, as the Commerce Department reported that the core personal consumption expenditures (PCE) price index, the Federal Reserve’s preferred inflation gauge, rose just 0.1% in August, slightly below expectations. Year-over-year, the index increased by 2.2%, nearing the Fed’s 2.0% target and marking the smallest gain since February 2021. Personal incomes and spending also fell short of forecasts, suggesting easing inflationary pressures. The yield on the 10-year U.S. Treasury note remained steady for the week, while strong demand for new municipal bond issues limited secondary market activity. In the short-maturity investment-grade corporate bond market, about half of the week’s offerings were oversubscribed. A firmer macroeconomic outlook, partly driven by China’s stimulus efforts, supported sentiment in the high-yield bond market, although trading volumes remained average amid heavy new issuance.
International Economic News: EUROPE: The pan-European STOXX Europe 600 Index rebounded, gaining 2.69% as slowing business activity fueled hopes for interest rate cuts, while China’s economic stimulus measures also boosted sentiment. Major stock indexes followed suit, with Germany’s DAX surging 4.03%, France’s CAC 40 rising 3.89%, Italy’s FTSE MIB climbing 2.86%, and the UK’s FTSE 100 advancing 1.10%. In the eurozone, business activity unexpectedly contracted in September, with the Composite PMI Output Index falling to 48.9 as new orders dropped and the Paris Olympics effect faded, particularly affecting services and manufacturing. German business activity hit a seven-month low, hinting at a potential recession. Meanwhile, UK private sector activity continued to expand, with the PMI at 52.9, although inflation eased to a 42-month low. German business confidence also fell in September, with the ifo Institute’s index dropping to 85.4, while consumer sentiment slightly improved to -21.2.
JAPAN: Japan’s stock markets rose over the week, with the Nikkei 225 Index climbing 5.58% and the TOPIX Index up 3.7%, driven by dovish comments from the Bank of Japan (BoJ) that weakened the yen and China’s stimulus measures to counter its sluggish economy and weak housing market. Japan’s export-heavy economy, especially companies with ties to China, benefited from the optimism surrounding these announcements. BoJ Governor Kazuo Ueda indicated that the central bank will take a patient approach to raising rates, leading the 10-year Japanese government bond yield to drop to 0.80%. Meanwhile, the Tokyo-area core consumer price index (CPI) rose 2.0% year-over-year in September, down from August’s 2.4%, while Japan’s private sector continued expanding, with services growth offsetting a slight contraction in manufacturing output.
CHINA: Chinese stocks surged following Beijing’s announcement of a sweeping economic stimulus package. The Shanghai Composite Index jumped 12.81%, and the blue-chip CSI 300 soared 15.7%, marking its biggest weekly gain since 2008. In Hong Kong, the Hang Seng Index rose 13%. The People’s Bank of China (PBOC) cut its reserve requirement ratio for most banks by 50 basis points, its second cut this year, and reduced key policy rates, including a 20-basis-point cut to the seven-day reverse repo rate and a 30-basis-point cut to the medium-term lending facility rate, the largest since 2016. These moves were part of a broader effort, announced at a rare press conference by PBOC Governor Pan Gongsheng, to revive China’s sluggish economy. Additional measures included rate cuts for existing home mortgages and lowering the nationwide down payment ratio for second home purchases. China’s top leaders also pledged to stabilize the property market and maintain real estate prices, with plans to issue special sovereign bonds worth RMB 2 trillion (USD 284.4 billion) as part of the fiscal stimulus, focusing on boosting domestic consumption.
Sources: All index and returns data from Norgate Data and Commodity Systems Incorporated and Wall Street Journal. >> News from Reuters, Barron’s, Wall St. Journal, Bloomberg.com, ft.com, guggenheimpartners.com, zerohedge.com, ritholtz.com, markit.com, financialpost.com, Eurostat, Statistics Canada, Yahoo! Finance, stocksandnews.com, marketwatch.com, visualcapitalist.com, wantchinatimes.com, BBC, 361capital.com, pensionpartners.com, cnbc.com, FactSet, Morningstar/Ibbotson Associates, Corporate Finance Institute. >> Commentary from T Rowe Price Global markets weekly update — https://www.troweprice.com/personal-investing/resources/insights/global-markets-weekly-update.
Disclosures: This material is provided for informational purposes only and is not intended to be investment advice or a recommendation to take any action. Past performance cannot guarantee future results.
