


THE COMPLETE PICTURE
>> Four indicators across three time frames.
>> When all the Sherman Portfolios indicators are positive status, we read the market as being in a Bull Market.
1. DELTA-V — Positive since June 27, 2025
2. GALACTIC SHIELD — Positive since April 1, 2023
3. STARFLUX — Positive since May 12, 2025
4. STARPATH — Positive since August 15, 2025
The shorter term picture:
>> GALACTIC SHIELD — POSITIVE for Q4 2025, This indicator is based on the combination of U.S. and International Equities trend statuses at the start of each quarter.
>> STARFLUX — POSITIVE, Starflux ended the week 8.17 (up 13.47% last week). This short-term indicator measures U.S. Equities. It measures the trend-strength of the Russell 3000 index.
>> STARPATH — POSITIVE, This indicator measures the interplay on dual timeframes of our Type 1s + the Russell 3000 + our four most ‘pro-cyclical’ Type 3s, vs. Cash.
The big picture:
The ‘big picture’ is the (typically) years-long timeframe, the same timeframe in which Cyclical Bulls and Bears operate.
>> The Sherman Portfolios DELTA-V Indicator measuring the Bull/Bear cycle finished the week in a Bull status at 68.00, up 2.43% from the prior week’s 66.39. It has signaled Bull since June 27, 2025.
>> The Sherman Portfolios DELTA-V Bond Indicator measuring the Bull/Bear cycle finished the week in BULL status at 61.55, up 1.17% from the prior week’s 60.84. It has signaled Bull since December 15, 2023.
The very big picture (a historical perspective): The CAPE is now at 40.74.
The cyclically adjusted price-to-earnings ratio (CAPE) can be used to smooth out the shorter-term earnings swings to get a longer-term assessment of market valuation. An extremely high CAPE ratio means that a company’s stock price is substantially higher than the company’s earnings would indicate and, therefore, overvalued. It is generally expected that the market will eventually correct the company’s stock price by pushing it down to its true value.
In the past, the CAPE ratio has proved its importance in identifying potential bubbles and market crashes. The historical average of the ratio for the S&P 500 Index is between 15-16, while the highest levels of the ratio have exceeded 30. The record-high levels occurred three times in the history of the U.S. financial markets. The first was in 1929 before the Wall Street crash that signaled the start of the Great Depression. The second was in the late 1990s before the Dotcom Crash, and the third came in 2007 before the 2007-2008 Financial Crisis. https://www.multpl.com/shiller-pe
 Note: We do not use CAPE as an official input into our methods. However, we think history serves as a guide and that it’s good to know where we are on the historic continuum.
THIS WEEK IN THE MARKETS
U.S. Markets:
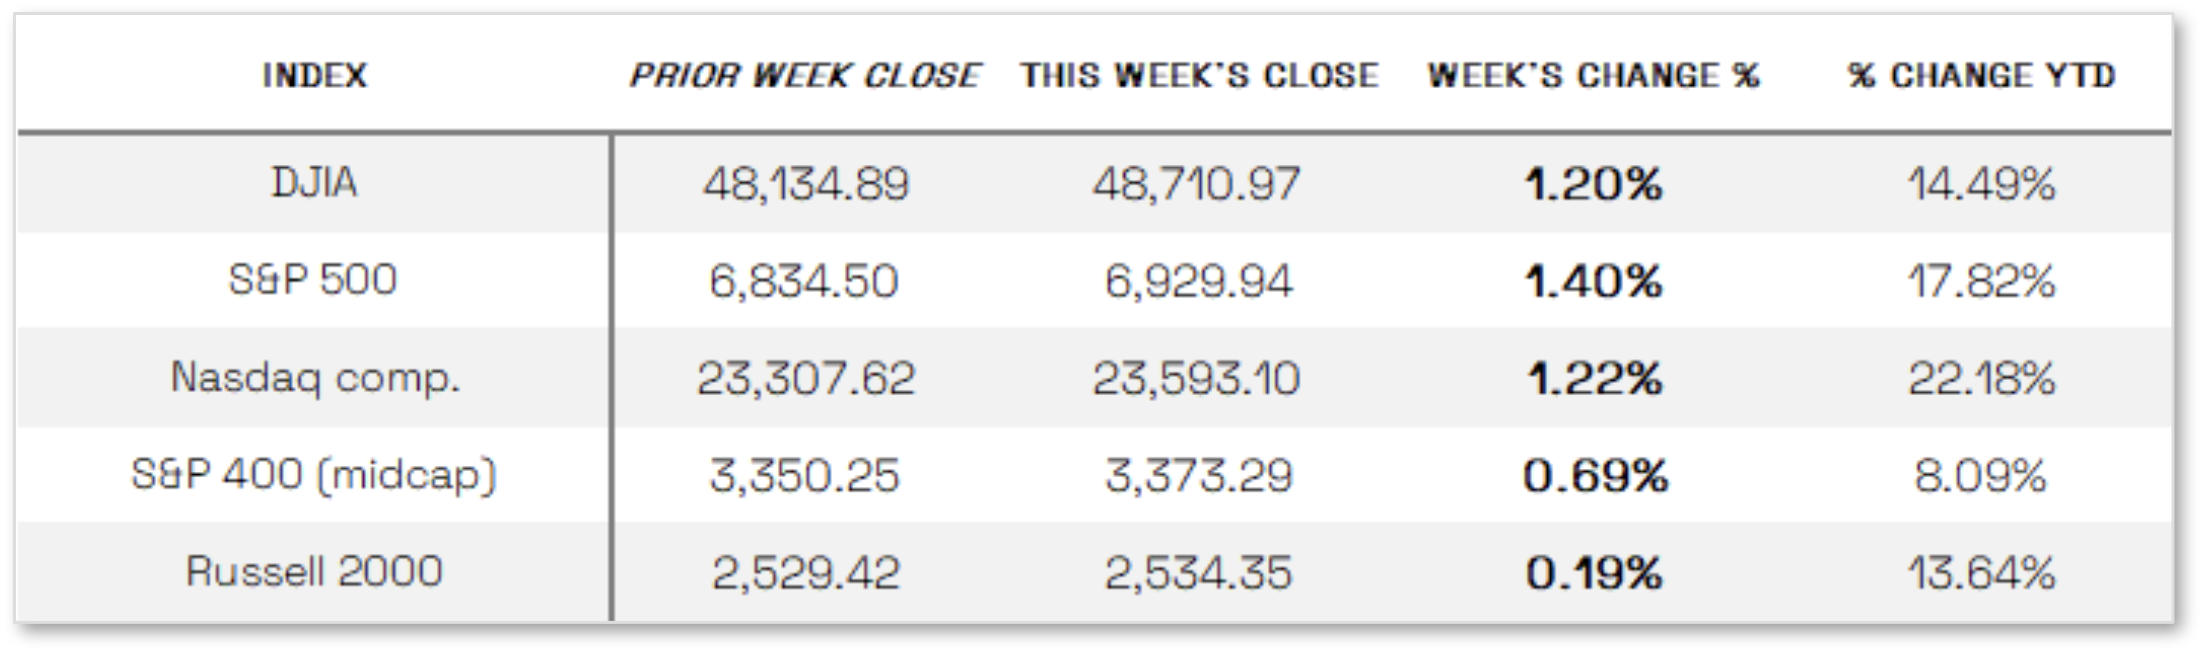
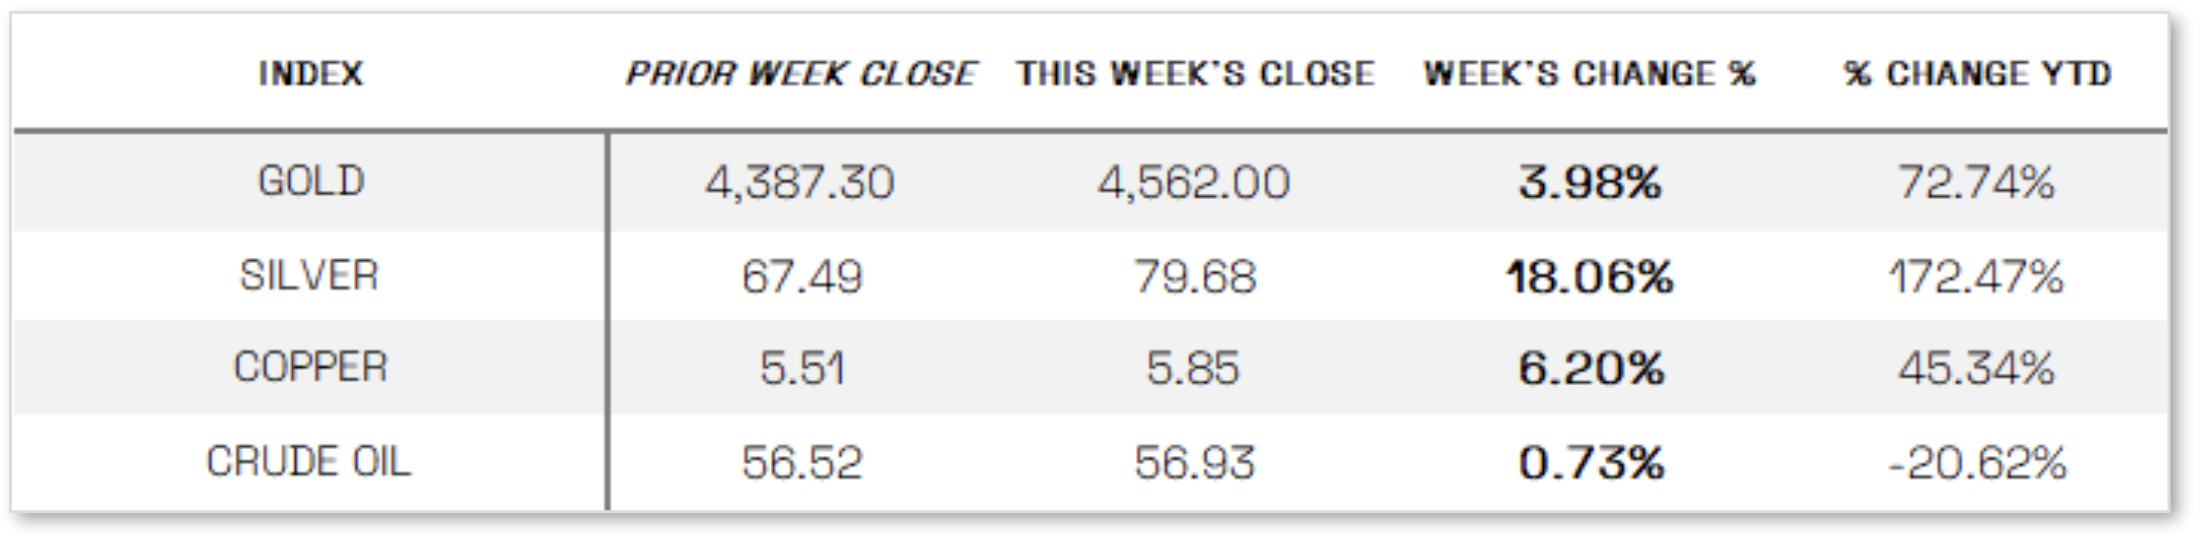
Stocks up in short week: U.S. stocks advanced in the holiday-shortened week, with the S&P 500 Index and Dow Jones Industrial Average reaching record highs as light trading volumes and limited news were offset by supportive economic data and ongoing optimism around artificial intelligence, while the small-cap Russell 2000 Index lagged other major benchmarks but still finished 0.19% higher, and gold and silver prices surged, extending their year-to-date gains.
Looking at the US Indexes:
U.S. Commodities/Futures:
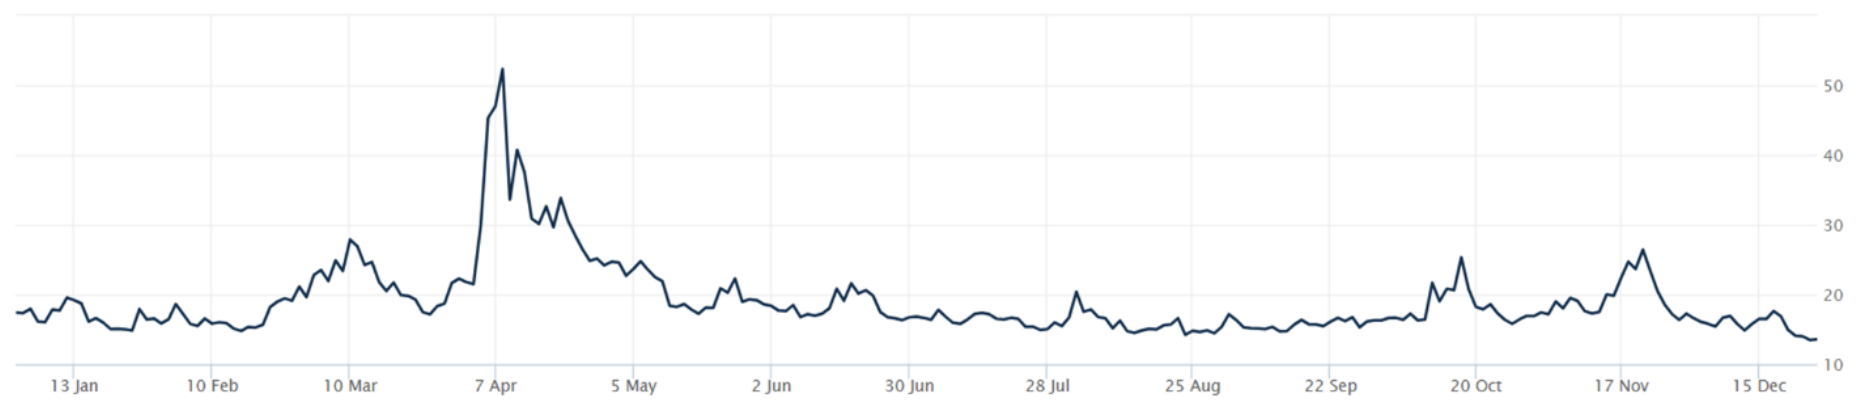
THE VOLATILITY INDEX (VIX) closed at 13.60 this week, an 8.8% decrease vs last week’s close of 14.91.
International Markets:
THIS WEEK’S ECONOMIC NEWS
U.S. Economic News:
Mixed Economic Data
U.S. economic data painted a mixed picture, as preliminary figures from the Bureau of Economic Analysis showed the economy expanded at its fastest pace in two years during the third quarter, with GDP growing at an annualized 4.3%, exceeding both the prior quarter’s 3.8% pace and expectations near 3%, largely driven by stronger consumer spending. However, the Census Bureau reported that durable goods orders fell 2.2% in October, a sharper decline than anticipated, led by a drop in transportation equipment orders, though core orders excluding defense and aircraft—a proxy for business investment—rose 0.5%, extending a seven-month streak of gains. At the same time, consumer confidence weakened further, with the Conference Board’s Consumer Confidence Index declining for a fifth consecutive month in December to 89.1 amid growing concerns about jobs, income prospects, and business conditions, even as labor market data remained relatively firm, with initial unemployment claims falling to 214,000 while continuing claims edged higher to 1.923 million.
International Economic News:
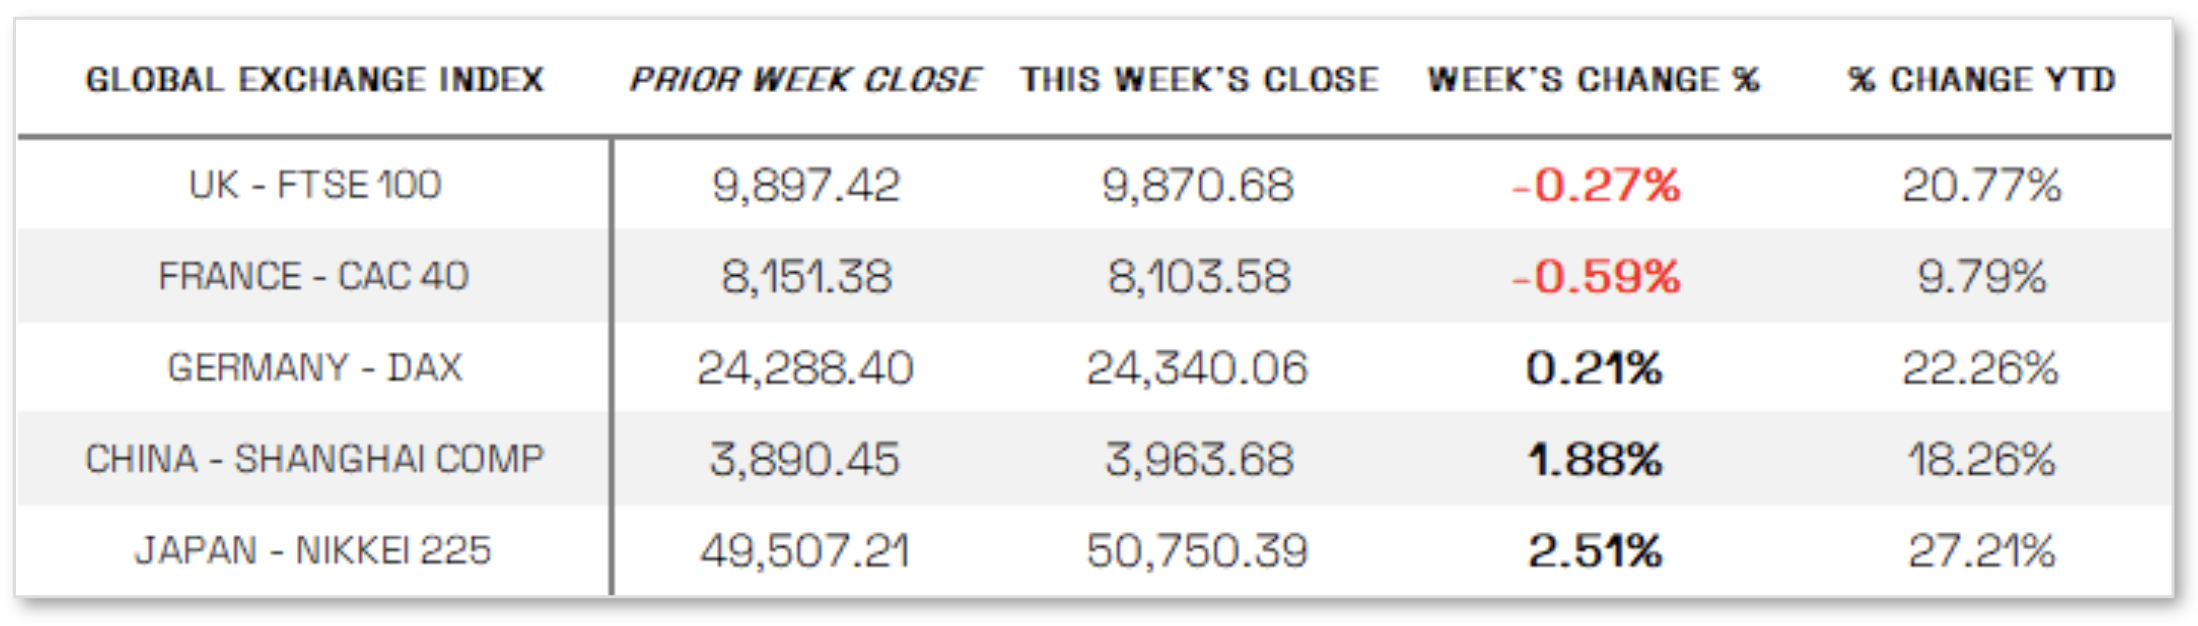
EUROPE: European equities edged higher in a holiday-shortened week, with the STOXX Europe 600 Index up 0.20% in local currency terms and closing just below a record high amid optimism about earnings and the economic outlook for next year, though performance among major markets was mixed, as Germany’s DAX rose 0.21% while France’s CAC 40 fell 0.59%, Italy’s FTSE MIB declined 0.34%, and the UK’s FTSE 100 slipped 0.27%. In Germany, the Bundesbank projected a gradual economic recovery beginning in 2026 following three years of recession, forecasting GDP growth of 0.2% in 2025 before accelerating to 0.6% in 2026 and 1.3% in 2027, driven by government spending and stronger exports, although sentiment among businesses remained cautious, with an Ifo survey showing 26% of firms expecting conditions to worsen in 2026 and the majority anticipating no change, underscoring a lack of broad-based optimism.
JAPAN: Japanese equities advanced over the week, with the Nikkei 225 Index climbing 2.51% and the broader TOPIX Index rising 1.16%, supported by strong gains in technology stocks amid continued optimism around artificial intelligence, while the 10-year Japanese government bond yield edged up to 2.04% as investors maintained expectations for further Bank of Japan policy tightening despite softer inflation data. The Tokyo-area core consumer price index rose 2.3% year over year in December, below both November’s pace and market expectations, yet the yen strengthened into the JPY 156 range against the U.S. dollar, aided by verbal intervention from Finance Minister Satsuki Katayama and more hawkish signals from Governor Kazuo Ueda, who indicated that progress toward the BoJ’s inflation and wage growth targets is continuing and reaffirmed the central bank’s readiness to raise interest rates further if its outlook is realized.
CHINA: Mainland Chinese equities rose over the week, with the CSI 300 Index gaining 1.95% and the Shanghai Composite Index advancing 1.88%, while Hong Kong’s Hang Seng Index, which closed midweek, posted a modest increase, despite the absence of new economic data releases. Recent indicators published earlier in December continued to point to soft economic momentum, as November retail sales grew at their slowest year-over-year pace since the pandemic and fixed asset investment remained on track for its first annual contraction since 1998, yet most analysts still expect China to meet its official growth target of around 5% this year, even as the World Bank estimates growth of 4.9% for 2024 and projects a moderation to 4.4% in 2026 amid ongoing property sector weakness, trade policy uncertainty, and other structural challenges.
Sources:
>> All index and returns data from Norgate Data and Commodity Systems Incorporated and Wall Street Journal.
>> News from Reuters, Barron’s, Wall St. Journal, Bloomberg.com, ft.com, guggenheimpartners.com, zerohedge.com, ritholtz.com, markit.com, financialpost.com, Eurostat, Statistics Canada, Yahoo! Finance, stocksandnews.com, marketwatch.com, visualcapitalist.com, wantchinatimes.com, BBC, 361capital.com, pensionpartners.com, cnbc.com, FactSet, Morningstar/Ibbotson Associates, Corporate Finance Institute.
>> Commentary from T Rowe Price Global markets weekly update — https://www.troweprice.com/personal-investing/resources/insights/global-markets-weekly-update.html
Disclosures: This material and any mention of specific investments is provided for informational purposes only and is not intended to be investment advice or a recommendation to take any action. The forecasts or forward-looking statements are based on assumptions, may not materialize, and are subject to revision without notice. The market indexes discussed are unmanaged, and generally, considered representative of their respective markets. Index performance is not indicative of the past performance of a particular investment. Indexes do not incur management fees, costs, and expenses. Individuals cannot directly invest in unmanaged indexes. Past performance does not guarantee future results.
