


THE COMPLETE PICTURE
>> Four indicators across three time frames.
>> When all the Sherman Portfolios indicators are positive status, we read the market as being in a Bull Market.
1. DELTA-V — Positive since June 27, 2025
2. GALACTIC SHIELD — Positive since April 1, 2023
3. STARFLUX — Positive since May 12, 2025
4. STARPATH — Positive since August 15, 2025
The shorter term picture:
>> GALACTIC SHIELD — POSITIVE for Q4 2025,, This indicator is based on the combination of U.S. and International Equities trend statuses at the start of each quarter.
>> STARFLUX — POSITIVE, Starflux ended the week 7.18 (down 6.14% last week). This short-term indicator measures U.S. Equities. It measures the trend-strength of the Russell 3000 index.
>> STARPATH — POSITIVE, This indicator measures the interplay on dual timeframes of our Type 1s + the Russell 3000 + our four most ‘pro-cyclical’ Type 3s, vs. Cash
The big picture:
The ‘big picture’ is the (typically) years-long timeframe, the same timeframe in which Cyclical Bulls and Bears operate.
>> The Sherman Portfolios DELTA-V Indicator measuring the Bull/Bear cycle finished the week in a Bull status at 66.62, down 0.48% from the prior week’s 66.94. It has signaled Bull since June 27, 2025.
>> The Sherman Portfolios DELTA-V Bond Indicator measuring the Bull/Bear cycle finished the week in BULL status at 59.55, down 1.83% from the prior week’s 60.66. It has signaled Bull since December 15, 2023.
The very big picture (a historical perspective): The CAPE is now at 40.22.
The cyclically adjusted price-to-earnings ratio (CAPE) can be used to smooth out the shorter-term earnings swings to get a longer-term assessment of market valuation. An extremely high CAPE ratio means that a company’s stock price is substantially higher than the company’s earnings would indicate and, therefore, overvalued. It is generally expected that the market will eventually correct the company’s stock price by pushing it down to its true value.
In the past, the CAPE ratio has proved its importance in identifying potential bubbles and market crashes. The historical average of the ratio for the S&P 500 Index is between 15-16, while the highest levels of the ratio have exceeded 30. The record-high levels occurred three times in the history of the U.S. financial markets. The first was in 1929 before the Wall Street crash that signaled the start of the Great Depression. The second was in the late 1990s before the Dotcom Crash, and the third came in 2007 before the 2007-2008 Financial Crisis. https://www.multpl.com/shiller-pe
 Note: We do not use CAPE as an official input into our methods. However, we think history serves as a guide and that it’s good to know where we are on the historic continuum.
THIS WEEK IN THE MARKETS
U.S. Markets:
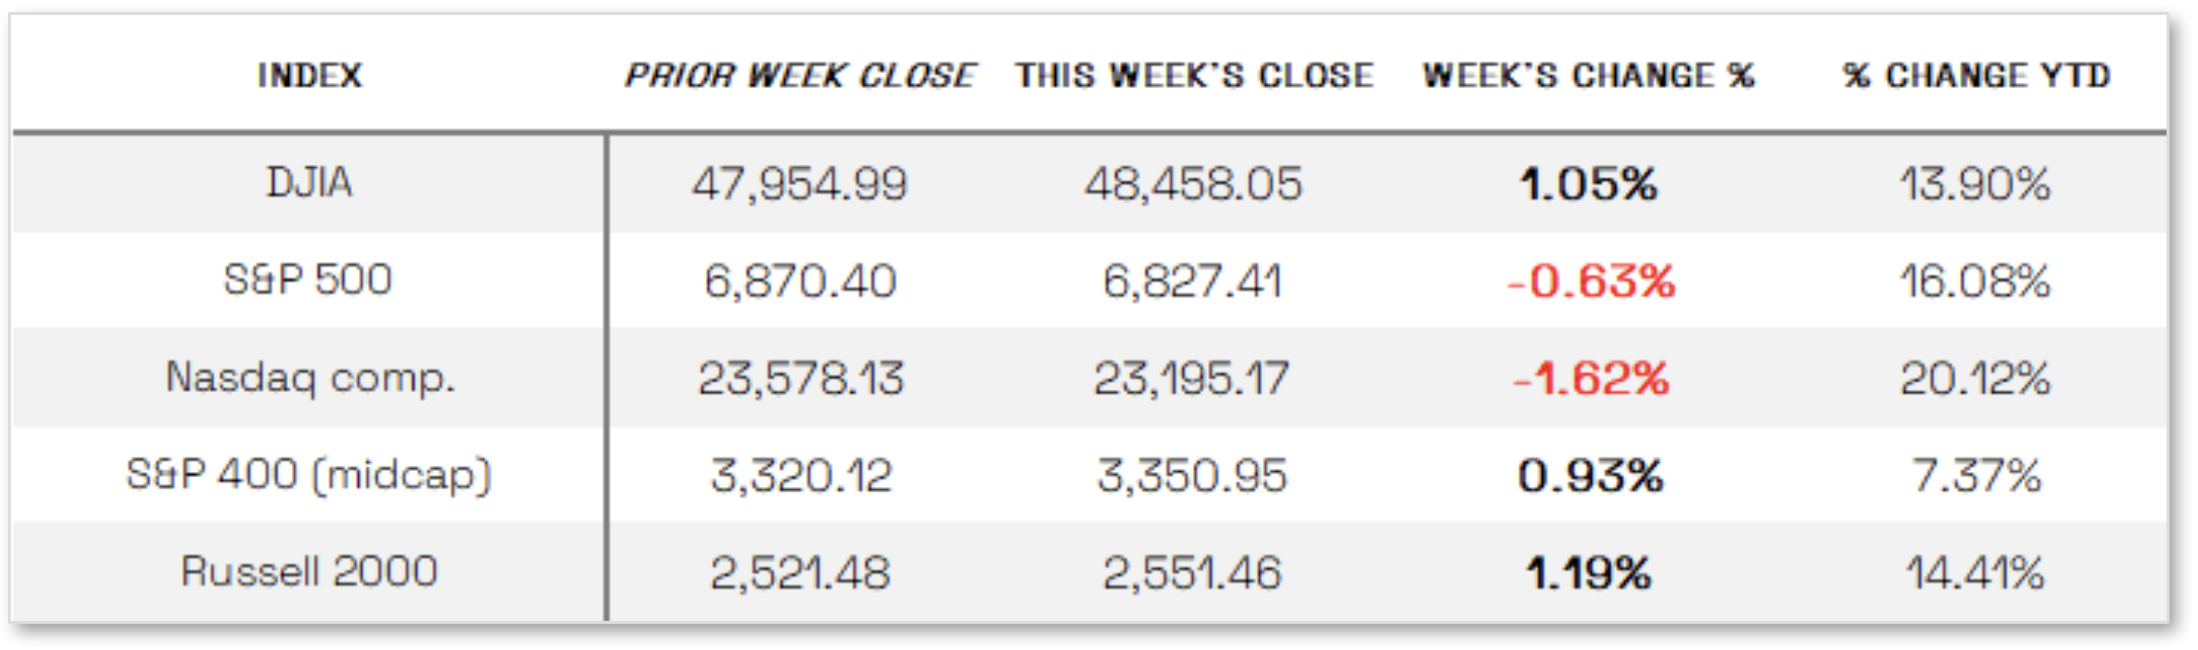
Stocks mixed this week: Most major stock indexes advanced and reached record highs during the week, buoyed by the Federal Reserve’s third straight interest rate cut and central bank commentary that investors viewed as less hawkish than anticipated. Small-cap stocks led the gains, with the rate-sensitive Russell 2000 Index rising 1.19%, followed by a 1.05% increase in the Dow Jones Industrial Average, while the S&P MidCap 400 posted more modest gains and the S&P 500 retreated sharply on Friday, giving back its earlier advances. In contrast, renewed concerns over technology stock valuations and doubts about the payoff from elevated spending on artificial intelligence infrastructure weighed on the tech-heavy Nasdaq Composite, which declined 1.62% for the week after Oracle reported quarterly revenue below consensus expectations and forecast a significant increase in capital expenditures.
Looking at the US Indexes:
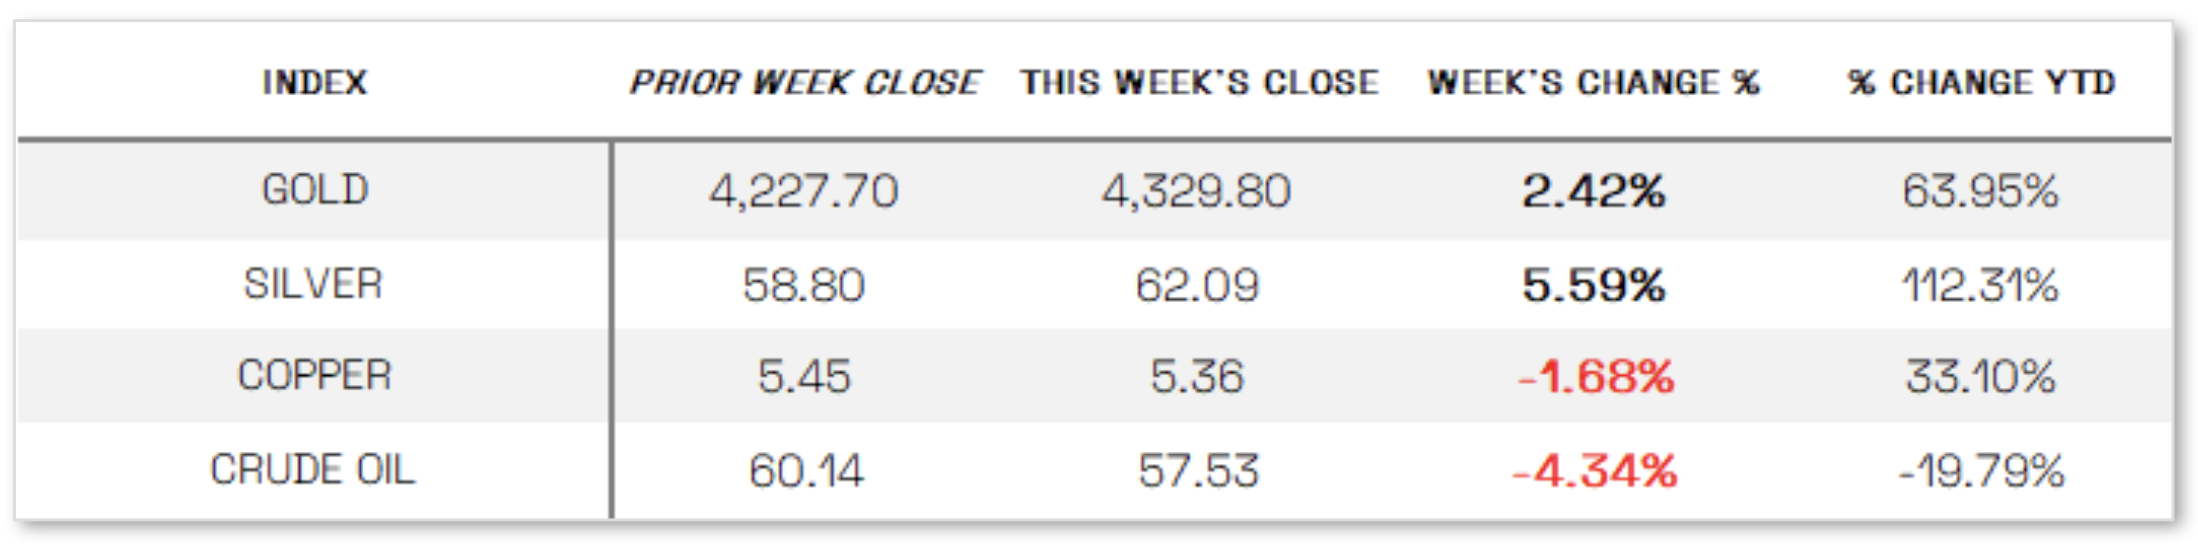
U.S. Commodities/Futures:
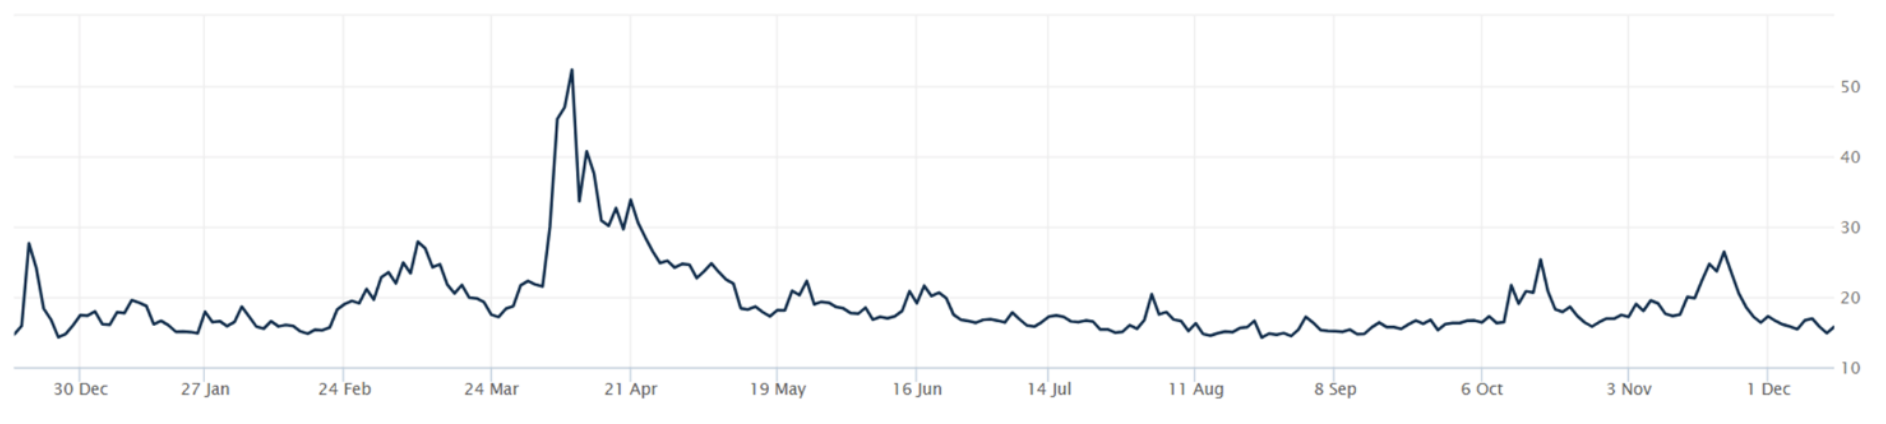
THE VOLATILITY INDEX (VIX) closed at 15.74 this week, a 2.1% increase vs last week’s close of 15.41.
International Markets:
THIS WEEK’S ECONOMIC NEWS
U.S. Economic News:
Fed cuts rates:
The Federal Reserve concluded its final meeting of the year by cutting its target range for the federal funds rate by 25 basis points to 3.50%–3.75%, marking its third consecutive rate cut, though the decision featured an unusually high level of dissent as three policymakers voted against the consensus for the first time in six years. The policy statement suggested a potential pause ahead, emphasizing a data-dependent approach to future adjustments, while Chair Jerome Powell’s press conference struck a mixed but less hawkish tone, noting that rates are near neutral yet highlighting significant downside risks to the labor market; the Fed also announced it would purchase shorter-term Treasury securities as needed to maintain ample reserves. Labor market data added to the cautious outlook, as initial jobless claims surged to 236,000—the highest since early September—though continuing claims fell to their lowest level since mid-April, while job openings edged up to a five-month high in October even as layoffs increased, hires declined, and the quits rate fell to its lowest level since 2020, suggesting reduced worker confidence in job mobility.
International Economic News:
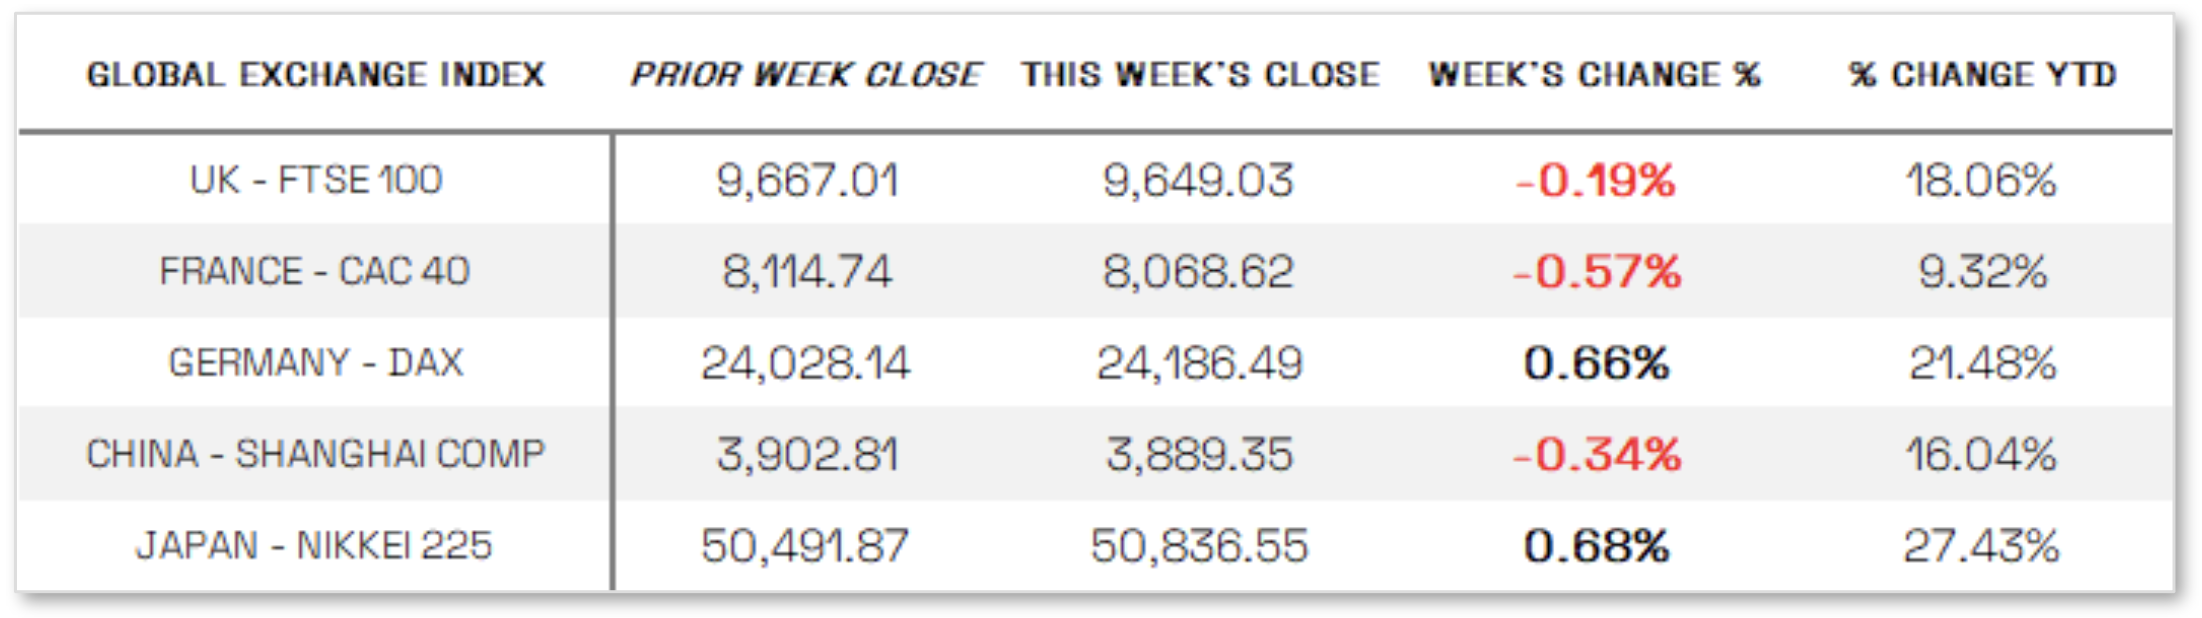
EUROPE: In local currency terms, the pan-European STOXX Europe 600 Index ended slightly lower as major markets delivered mixed performances, with Germany’s DAX rising 0.66% and Italy’s FTSE MIB adding 0.19%, while France’s CAC 40 declined 0.57% and the UK’s FTSE 100 slipped 0.19%. Commentary from European Central Bank officials suggested a cautiously hawkish tilt, as Executive Board member Isabel Schnabel said she was comfortable with market expectations for a potential rate increase, contingent on incoming data, citing upside risks to growth and inflation, while ECB President Christine Lagarde noted economic resilience and indicated that growth projections could be upgraded at the December meeting. Other policymakers echoed a steady-policy stance, with Gediminas Simkus saying no further rate cuts are needed and Francois Villeroy de Galhau advocating holding borrowing costs at 2.0%, a view supported by a Reuters poll showing unanimous expectations for rates to remain unchanged next week and nearly three-quarters of economists forecasting no change through the end of 2026.
JAPAN: Japan’s equity markets advanced over the week, with the Nikkei Index rising 0.68% and the broader TOPIX Index gaining 1.82%, while the yen ended broadly unchanged around JPY 155 per U.S. dollar. Investors increasingly priced in a Bank of Japan interest rate hike at the December 18–19 meeting, reflecting improved central bank communication aimed at avoiding market disruption similar to that seen after the surprise July 2024 rate hike. The yield on the 10-year Japanese government bond edged up to 1.95% from 1.93%, and a Bloomberg poll showed all 50 economists expect the BoJ to raise its policy rate by 25 basis points to 0.75% at its final meeting of 2025, following January’s move to 0.50%. During the week, Governor Kazuo Ueda said underlying inflation is converging toward the 2% target, supported by a tight labor market and upward wage pressures, and noted that while a global slowdown in artificial intelligence spending could pose risks, solid domestic wage-price momentum and close monitoring of exchange rate effects should help limit downside risks to inflation.
CHINA: Mainland Chinese equities pulled back as investors took profits following recent gains, with the CSI 300 Index slipping 0.08% and the Shanghai Composite Index down 0.34%, while Hong Kong’s Hang Seng Index declined 0.42%. Inflation data for November highlighted persistent deflationary pressures, as consumer prices rose 0.7% year over year for a second consecutive month above zero, but producer prices fell 2.2%, marking the 38th straight monthly decline, and core CPI remained unchanged at 1.2%. Unlike the U.S. and Europe, China has faced ongoing deflation since the end of the pandemic, driven in part by a prolonged housing downturn that has weighed on consumption, and although authorities have launched an “anti-involution” campaign to rein in price wars and excess capacity, the latest data suggest limited progress in reversing these pressures.
Sources:
>> All index and returns data from Norgate Data and Commodity Systems Incorporated and Wall Street Journal.
>> News from Reuters, Barron’s, Wall St. Journal, Bloomberg.com, ft.com, guggenheimpartners.com, zerohedge.com, ritholtz.com, markit.com, financialpost.com, Eurostat, Statistics Canada, Yahoo! Finance, stocksandnews.com, marketwatch.com, visualcapitalist.com, wantchinatimes.com, BBC, 361capital.com, pensionpartners.com, cnbc.com, FactSet, Morningstar/Ibbotson Associates, Corporate Finance Institute.
>> Commentary from T Rowe Price Global markets weekly update — https://www.troweprice.com/personal-investing/resources/insights/global-markets-weekly-update.html
Disclosures: This material and any mention of specific investments is provided for informational purposes only and is not intended to be investment advice or a recommendation to take any action. The forecasts or forward-looking statements are based on assumptions, may not materialize, and are subject to revision without notice. The market indexes discussed are unmanaged, and generally, considered representative of their respective markets. Index performance is not indicative of the past performance of a particular investment. Indexes do not incur management fees, costs, and expenses. Individuals cannot directly invest in unmanaged indexes. Past performance does not guarantee future results.
