


THE COMPLETE PICTURE
>> Four indicators across three time frames.
>> When all the Sherman Portfolios indicators are positive status, we read the market as being in a Bull Market.
1. DELTA-V — Positive since June 27, 2025
2. GALACTIC SHIELD — Positive since April 1, 2023
3. STARFLUX — Positive since May 12, 2025
4. STARPATH — Positive since August 15, 2025
The shorter term picture:
>> GALACTIC SHIELD — POSITIVE for Q4 2025, This indicator is based on the combination of U.S. and International Equities trend statuses at the start of each quarter.
>> STARFLUX — POSITIVE, Starflux ended the week 7.65 (up 4.65% last week). This short-term indicator measures U.S. Equities. It measures the trend-strength of the Russell 3000 index.
>> STARPATH — POSITIVE, This indicator measures the interplay on dual timeframes of our Type 1s + the Russell 3000 + our four most ‘pro-cyclical’ Type 3s, vs. Cash.
The big picture:
The ‘big picture’ is the (typically) years-long timeframe, the same timeframe in which Cyclical Bulls and Bears operate.
>> The Sherman Portfolios DELTA-V Indicator measuring the Bull/Bear cycle finished the week in a Bull status at 66.94, up 1.52% from the prior week’s 65.94. It has signaled Bull since June 27, 2025.
>> The Sherman Portfolios DELTA-V Bond Indicator measuring the Bull/Bear cycle finished the week in BULL status at 60.66, down 3.52% from the prior week’s 62.87. It has signaled Bull since December 15, 2023.
The very big picture (a historical perspective): The CAPE is now at 40.46.
The cyclically adjusted price-to-earnings ratio (CAPE) can be used to smooth out the shorter-term earnings swings to get a longer-term assessment of market valuation. An extremely high CAPE ratio means that a company’s stock price is substantially higher than the company’s earnings would indicate and, therefore, overvalued. It is generally expected that the market will eventually correct the company’s stock price by pushing it down to its true value.
In the past, the CAPE ratio has proved its importance in identifying potential bubbles and market crashes. The historical average of the ratio for the S&P 500 Index is between 15-16, while the highest levels of the ratio have exceeded 30. The record-high levels occurred three times in the history of the U.S. financial markets. The first was in 1929 before the Wall Street crash that signaled the start of the Great Depression. The second was in the late 1990s before the Dotcom Crash, and the third came in 2007 before the 2007-2008 Financial Crisis. https://www.multpl.com/shiller-pe
 Note: We do not use CAPE as an official input into our methods. However, we think history serves as a guide and that it’s good to know where we are on the historic continuum.
THIS WEEK IN THE MARKETS
U.S. Markets:
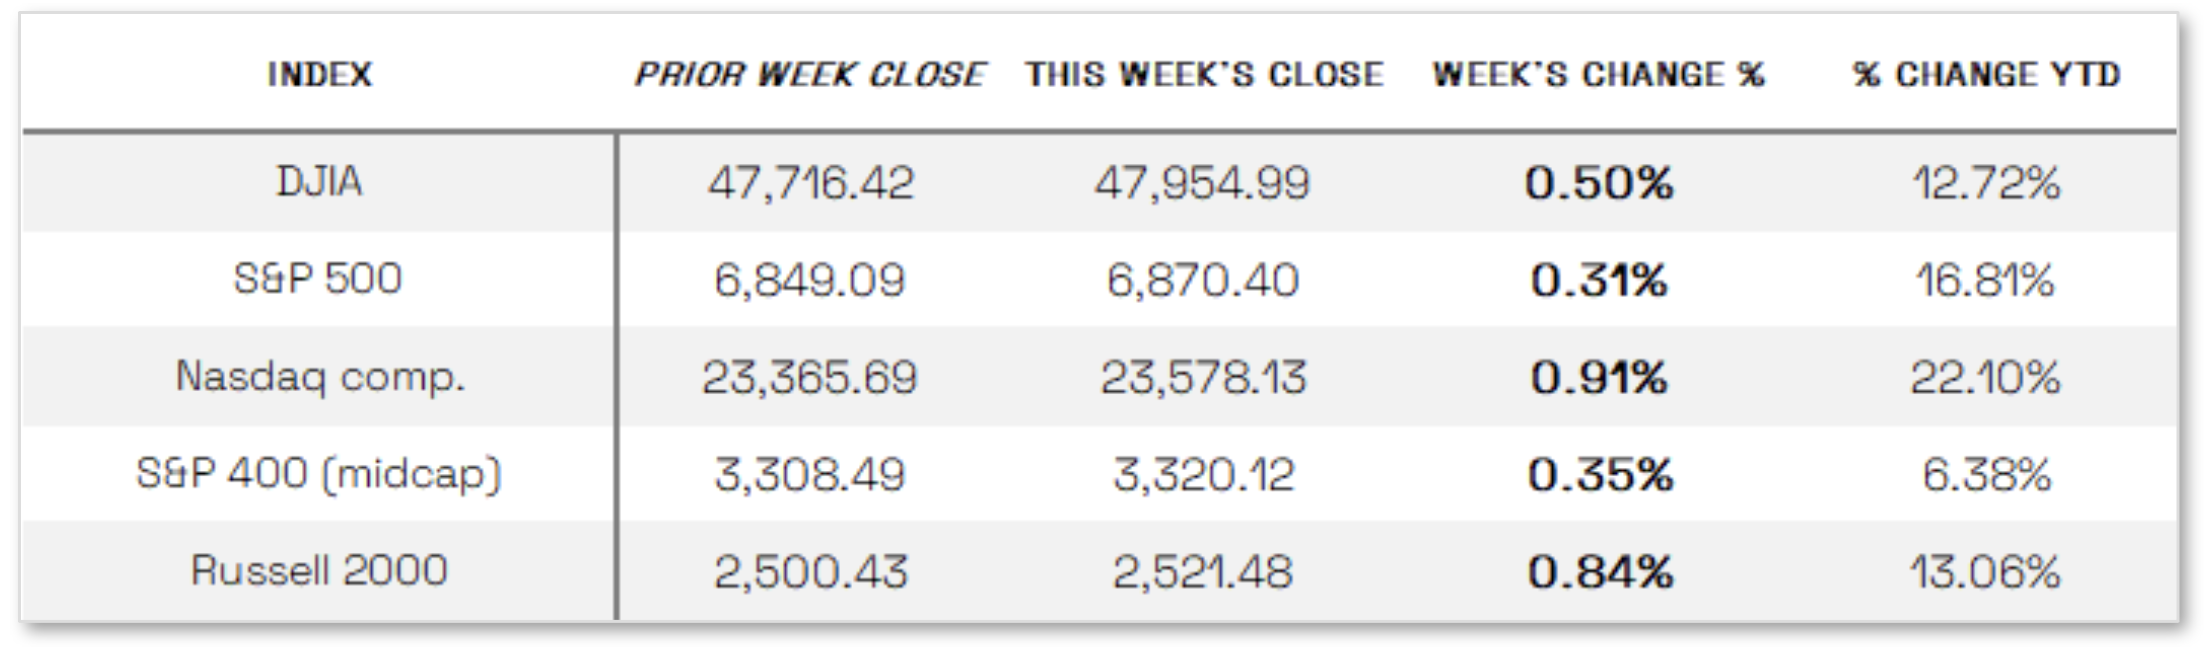
Stocks continue up this week: Major U.S. stock indexes ended the first week of December higher—adding to the prior week’s gains—as investors grew optimistic that the Federal Reserve may cut interest rates at its upcoming meeting. The Nasdaq Composite led with a 0.91% advance, followed by an 0.84% rise in the small-cap Russell 2000, while the S&P 500 posted a smaller but positive gain amid relatively light trading volumes. Economic data showed continued weakness in manufacturing, with the ISM Purchasing Managers’ Index falling to 48.2% in November—its ninth straight month of contraction—driven by declines in supplier deliveries, new orders, and employment, even as input prices rose for the 14th consecutive month. In contrast, the services sector expanded at its fastest pace since February, with the services PMI ticking up to 52.6% and the prices index dropping to 65.4%, signaling that prices paid by service organizations increased at a slower rate.
Looking at the US Indexes:
U.S. Commodities/Futures:
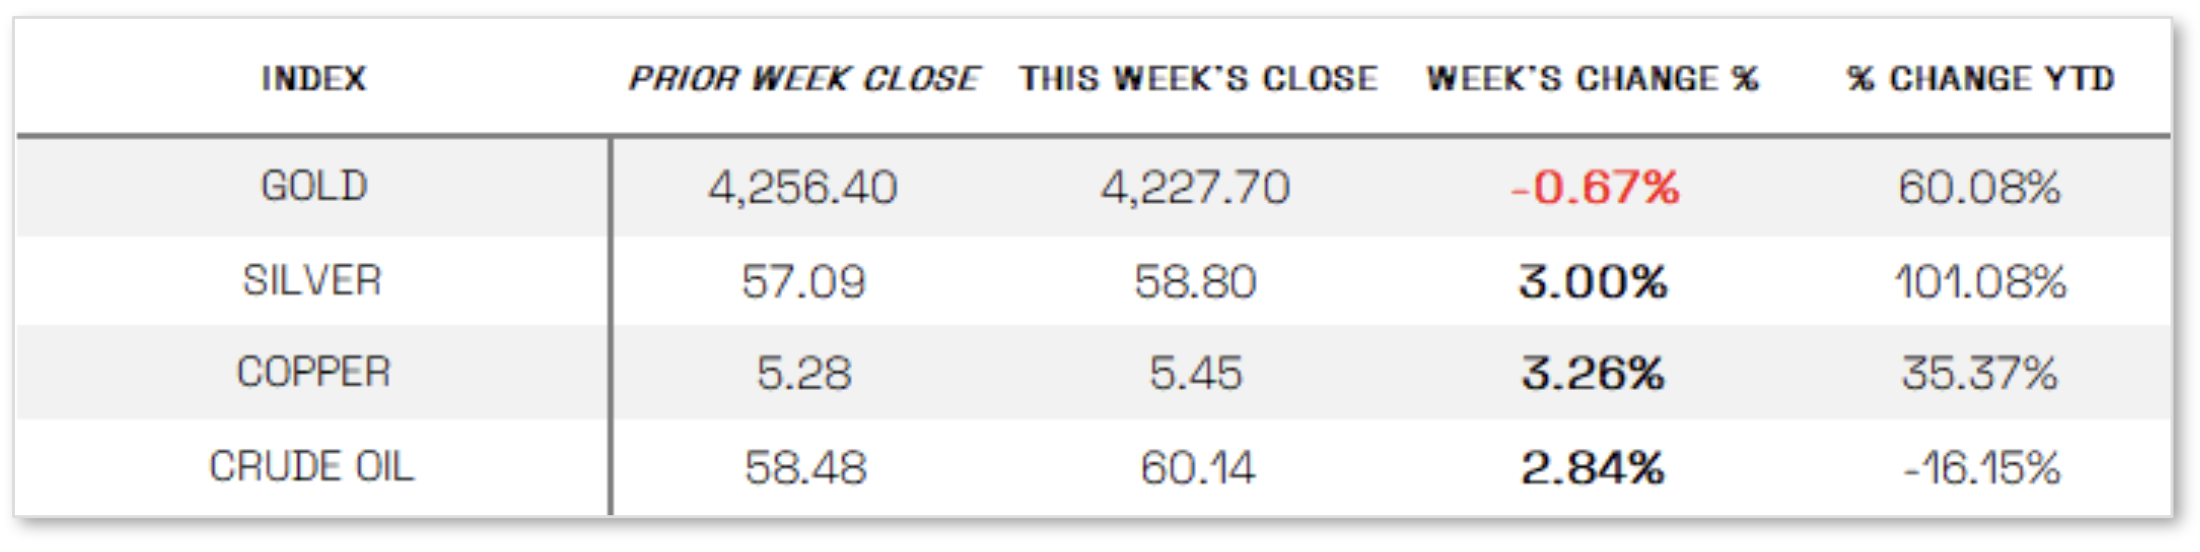
THE VOLATILITY INDEX (VIX) closed at 15.41 this week, a 5.7% decrease vs last week’s close of 16.35.
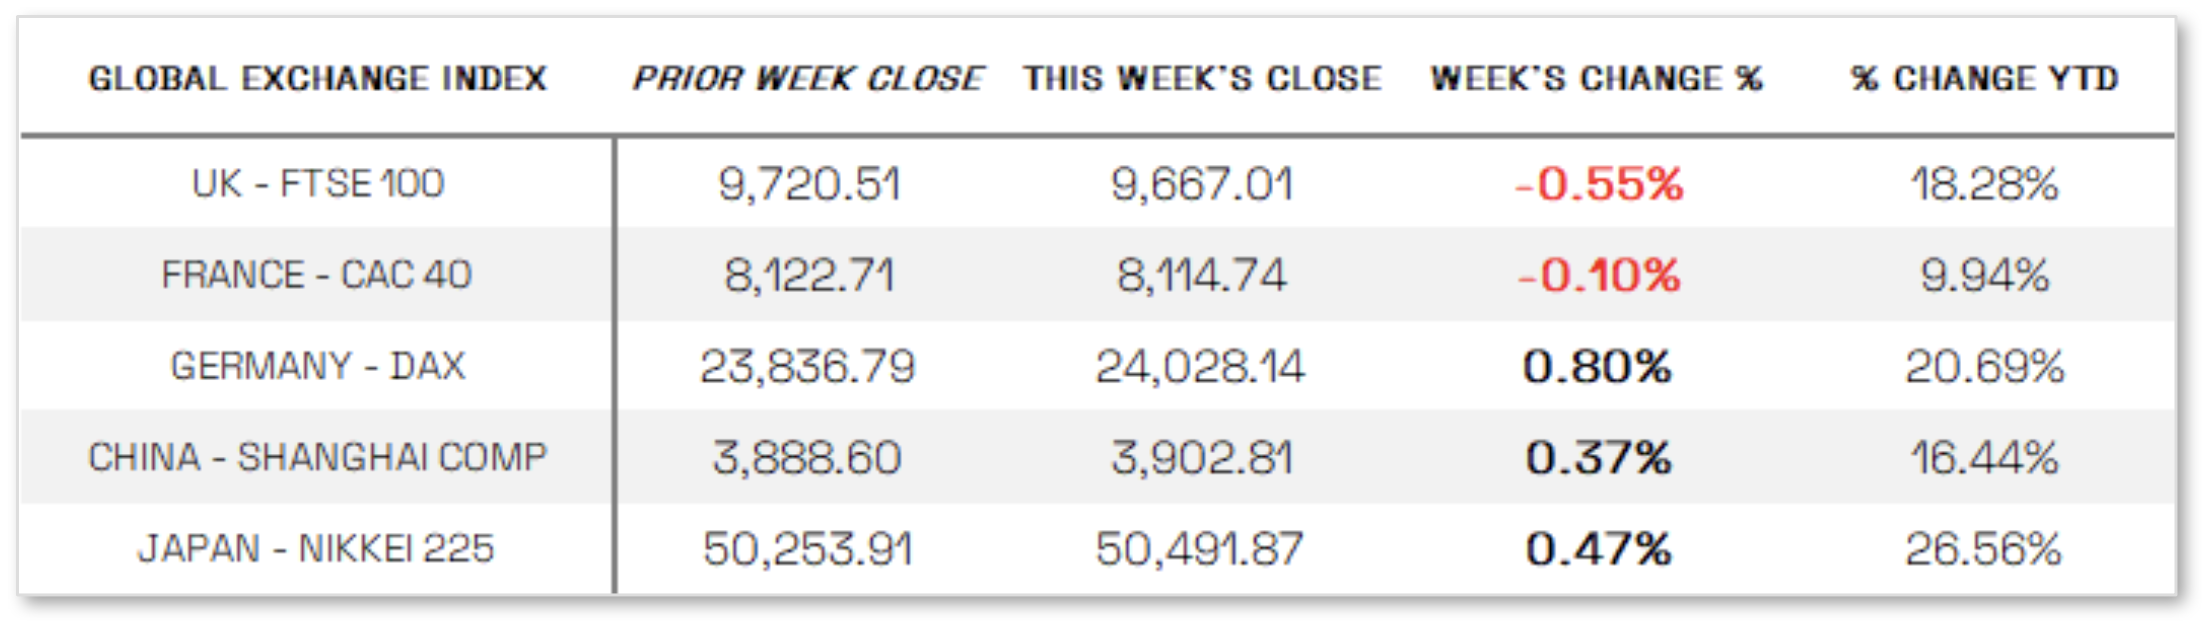
International Markets:
THIS WEEK’S ECONOMIC NEWS
U.S. Economic News:
Labor Market shows weakness
Private sector payrolls fell by 32,000 in November—the largest drop since March 2023—reversing October’s revised gain of 47,000, according to ADP, whose chief economist noted that hiring has been uneven as employers face cautious consumers and an uncertain economic backdrop, with small businesses showing the sharpest pullback. Additional labor-market weakness appeared in a Challenger, Gray & Christmas report showing more than 71,000 announced job cuts in November and a year-to-date total of roughly 1.17 million, the highest since 2020, while contrasting data from the Labor Department showed initial unemployment claims falling unexpectedly to 191,000, the lowest since September 2022. Inflation data from the BEA indicated little change in September, with the Fed’s preferred PCE index rising 0.3% month over month and core PCE up 0.2%, both increasing 2.8% year over year, though the release of October data remains delayed due to the government shutdown. Meanwhile, consumer sentiment improved modestly, as the University of Michigan’s preliminary December reading rose to 53.3 on better personal-finance expectations, even as overall sentiment remained subdued amid persistent price pressures; expected inflation for the year ahead eased to 4.1%, the lowest since January 2025 and the fourth consecutive monthly decline.
International Economic News:
EUROPE: In local currency terms, the pan-European STOXX Europe 600 Index rose 0.41% amid optimism over potential interest rate cuts in the U.S. and UK, while major markets delivered mixed results: Germany’s DAX gained 0.80%, Italy’s FTSE MIB edged up 0.17%, France’s CAC 40 slipped modestly, and the UK’s FTSE 100 fell 0.55%. Eurozone data showed headline inflation increasing slightly to 2.2% in November, above expectations but still near the ECB’s 2% target, with higher services costs partly offset by declining energy prices; core inflation held steady at 2.4%. Meanwhile, third-quarter GDP growth was revised up to 0.3%, driven by rebounding fixed investment and strength in France and Spain, though Germany’s economy stagnated. Labor market conditions remained tight with unemployment unchanged at 6.4%, and retail sales were flat month over month but rose 1.5% year over year, outpacing both expectations and the prior reading.
JAPAN: Japan’s stock markets delivered mixed results, with the Nikkei 225 rising 0.47% while the TOPIX slipped 0.47%, as equities came under pressure from higher global bond yields and a speech by Bank of Japan (BoJ) Governor Kazuo Ueda that investors viewed as hawkish—boosting expectations of a December rate hike and pushing both Japanese government bond yields and the yen higher. The 10-year JGB yield climbed to 1.93%, its highest level since 2007, while the yen strengthened to the upper JPY 154 range from around JPY 156 the week prior. Ueda reiterated that Japan’s economy continues to recover moderately and noted that prices for goods and services have been rising modestly, adding that if the BoJ’s outlook holds, the bank will continue raising rates. He emphasized that the probability of this baseline scenario materializing is increasing amid reduced uncertainties around the U.S. economy and tariff outlook, and markets interpreted his remarks as signaling further tightening ahead, with consensus building that a rate hike at the BoJ’s December 18–19 meeting is likely.
CHINA: Mainland Chinese stock markets advanced as enthusiasm for domestic technology and artificial-intelligence trades outweighed signs of economic softening, with the CSI 300 up 1.28% and the Shanghai Composite rising 0.37%, while Hong Kong’s Hang Seng gained 0.87%. Economic data showed China’s official manufacturing PMI inching up to 49.2 in November from 49.0 in October, though it remained below the 50 threshold for an eighth consecutive month—a record stretch indicating contraction—according to Bloomberg. Meanwhile, the nonmanufacturing PMI slipped into contraction for the first time in nearly three years, dropping to 49.5 from 50.1 amid continued weakness in real estate and residential services.
Sources:
>> All index and returns data from Norgate Data and Commodity Systems Incorporated and Wall Street Journal.
>> News from Reuters, Barron’s, Wall St. Journal, Bloomberg.com, ft.com, guggenheimpartners.com, zerohedge.com, ritholtz.com, markit.com, financialpost.com, Eurostat, Statistics Canada, Yahoo! Finance, stocksandnews.com, marketwatch.com, visualcapitalist.com, wantchinatimes.com, BBC, 361capital.com, pensionpartners.com, cnbc.com, FactSet, Morningstar/Ibbotson Associates, Corporate Finance Institute.
>> Commentary from T Rowe Price Global markets weekly update — https://www.troweprice.com/personal-investing/resources/insights/global-markets-weekly-update.html
Disclosures: This material and any mention of specific investments is provided for informational purposes only and is not intended to be investment advice or a recommendation to take any action. The forecasts or forward-looking statements are based on assumptions, may not materialize, and are subject to revision without notice. The market indexes discussed are unmanaged, and generally, considered representative of their respective markets. Index performance is not indicative of the past performance of a particular investment. Indexes do not incur management fees, costs, and expenses. Individuals cannot directly invest in unmanaged indexes. Past performance does not guarantee future results.
