


THE COMPLETE PICTURE
>> Four indicators across three time frames.
>> When all the Sherman Portfolios indicators are positive status, we read the market as being in a Bull Market.
1. DELTA-V — Positive since June 27, 2025
2. GALACTIC SHIELD — Positive since April 1, 2023
3. STARFLUX — Positive since May 12, 2025
4. STARPATH — Positive since August 15, 2025
The shorter term picture:
>> GALACTIC SHIELD — POSITIVE, This indicator is based on the combination of U.S. and International Equities trend statuses at the start of each quarter.
>> STARFLUX — POSITIVE, Starflux ended the week 7.31 (up 118.86% last week). This short-term indicator measures U.S. Equities. It measures the trend-strength of the Russell 3000 index.
>> STARPATH — POSITIVE, This indicator measures the interplay on dual timeframes of our Type 1s + the Russell 3000 + our four most ‘pro-cyclical’ Type 3s, vs. Cash.
The big picture:
The ‘big picture’ is the (typically) years-long timeframe, the same timeframe in which Cyclical Bulls and Bears operate.
>> The Sherman Portfolios DELTA-V Indicator measuring the Bull/Bear cycle finished the week in a Bull status at 65.94, up 1.34% from the prior week’s 65.07. It has signaled Bull since June 27, 2025.
>> The Sherman Portfolios DELTA-V Bond Indicator measuring the Bull/Bear cycle finished the week in BULL status at 62.87, up 3.44% from the prior week’s 60.78. It has signaled Bull since December 15, 2023.
The very big picture (a historical perspective): The CAPE is now at 40.42.
The cyclically adjusted price-to-earnings ratio (CAPE) can be used to smooth out the shorter-term earnings swings to get a longer-term assessment of market valuation. An extremely high CAPE ratio means that a company’s stock price is substantially higher than the company’s earnings would indicate and, therefore, overvalued. It is generally expected that the market will eventually correct the company’s stock price by pushing it down to its true value.
In the past, the CAPE ratio has proved its importance in identifying potential bubbles and market crashes. The historical average of the ratio for the S&P 500 Index is between 15-16, while the highest levels of the ratio have exceeded 30. The record-high levels occurred three times in the history of the U.S. financial markets. The first was in 1929 before the Wall Street crash that signaled the start of the Great Depression. The second was in the late 1990s before the Dotcom Crash, and the third came in 2007 before the 2007-2008 Financial Crisis. https://www.multpl.com/shiller-pe
 Note: We do not use CAPE as an official input into our methods. However, we think history serves as a guide and that it’s good to know where we are on the historic continuum.
THIS WEEK IN THE MARKETS
U.S. Markets:
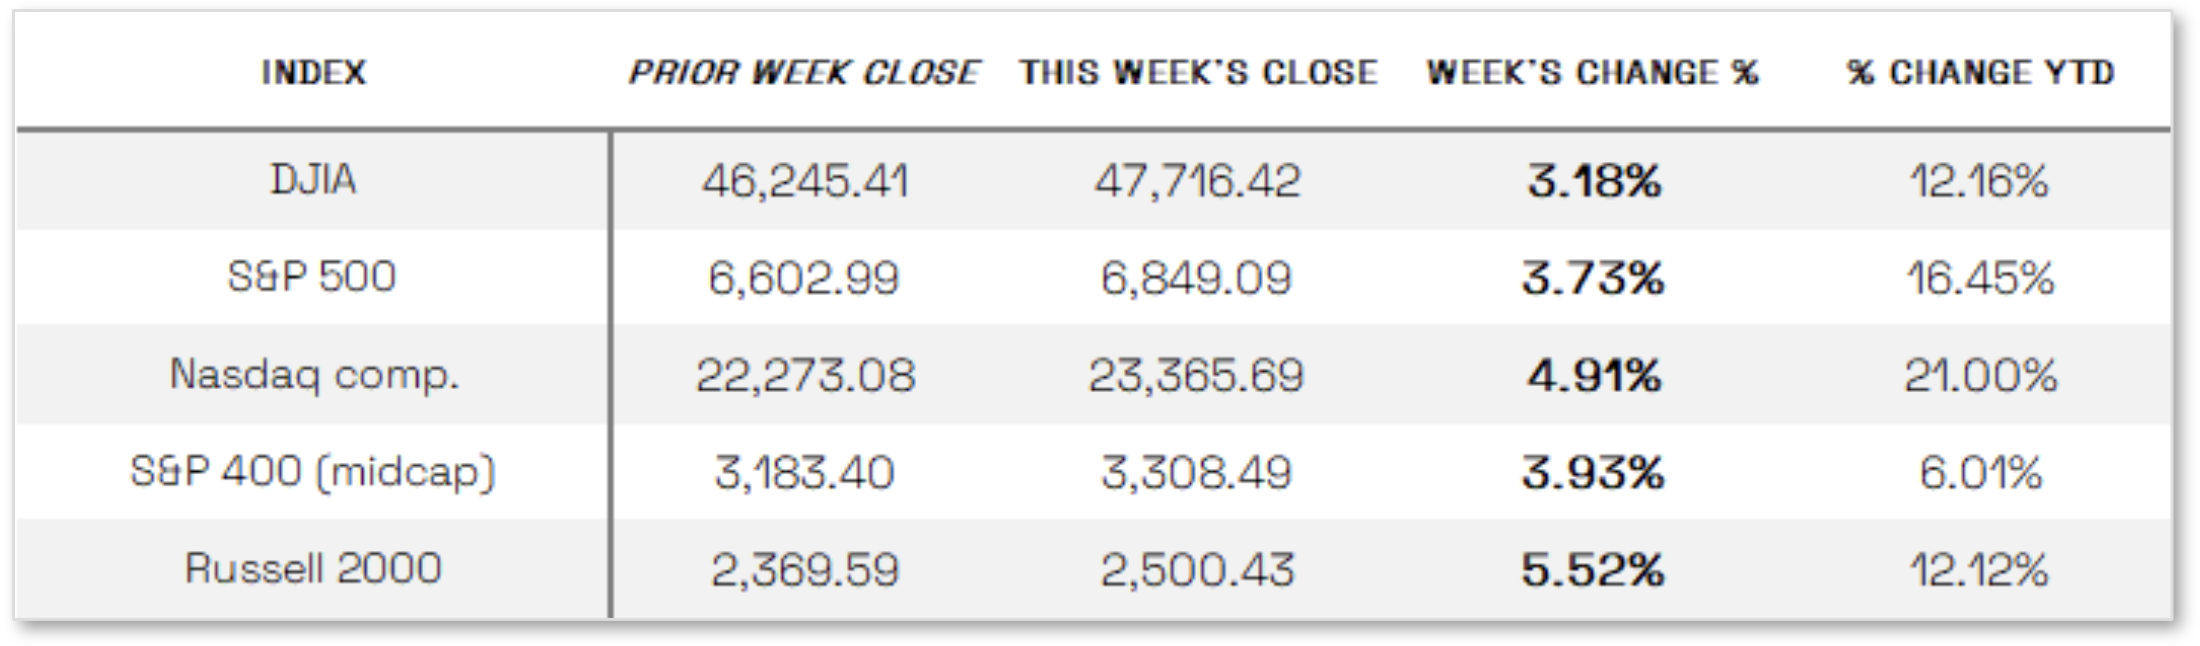
Stocks up in short week: U.S. stock indexes ended the holiday-shortened week higher, supported by dovish remarks from some Federal Reserve officials and weaker-than-expected economic data that bolstered expectations for a potential rate cut in December. Small-cap stocks led the gains, with the Russell 2000 Index jumping 5.52%, while the tech-heavy Nasdaq Composite rebounded strongly from the previous week’s sell-off, as investor concerns over high valuations and AI-related spending gave way to renewed optimism about the sector’s growth potential. Markets were closed Thursday for the Thanksgiving holiday. In economic news, delayed data releases due to the government shutdown showed signs of a slowing economy. September retail sales rose just 0.2%, down from 0.6% in August and below forecasts, while control group sales—important for GDP calculations—fell 0.1%. Additionally, the September Producer Price Index (PPI) increased 0.3%, in line with expectations, but core PPI, which strips out food and energy, rose just 0.1%, suggesting muted wholesale inflation.
Looking at the US Indexes:
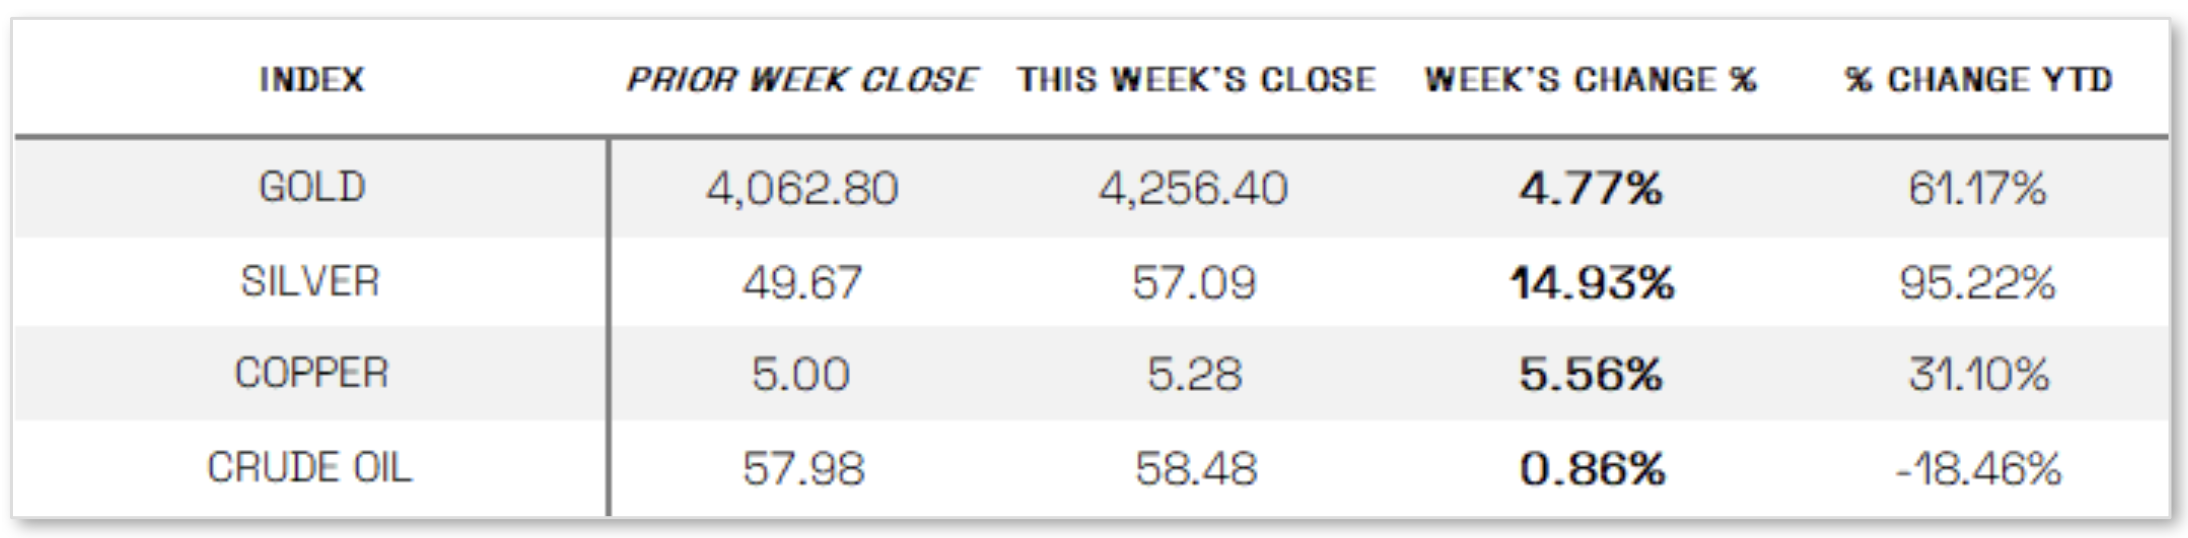
U.S. Commodities/Futures:
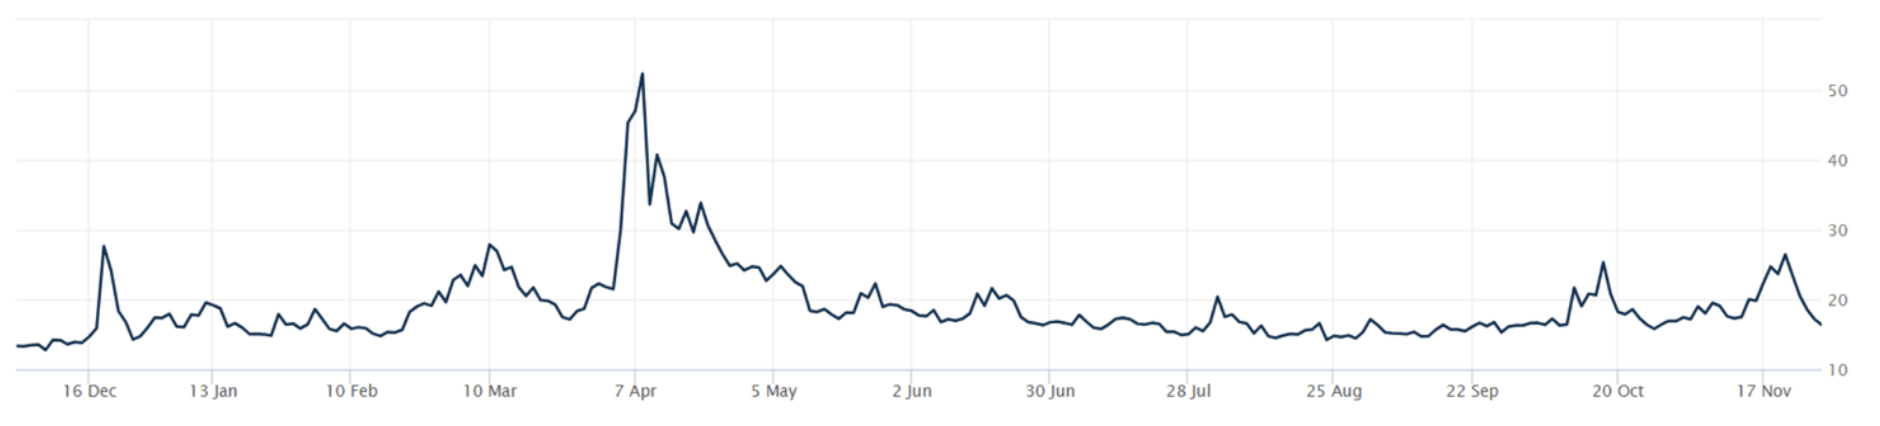
THE VOLATILITY INDEX (VIX) closed at 16.35 this week, a 30.2% decrease vs last week’s close of 23.43.
.
International Markets:
THIS WEEK’S ECONOMIC NEWS
U.S. Economic News:
Mixed Economic Data:
Initial jobless claims fell to 216,000 for the week ending November 22, the lowest level since April, even as continuing claims edged up to 1.96 million—just below this year’s peak—suggesting some softening in the labor market. At the same time, consumer confidence dropped sharply, with The Conference Board’s index falling to 88.7 in November, its lowest since April, as concerns over inflation, trade, and politics weighed on sentiment. Meanwhile, the Federal Reserve’s latest Beige Book reported little overall change in economic activity but noted slight declines in employment and continued moderate price increases, particularly in manufacturing and retail, where input cost pressures were linked to tariffs. The report also highlighted a further pullback in consumer spending, although higher-end retail remained relatively strong.
International Economic News:
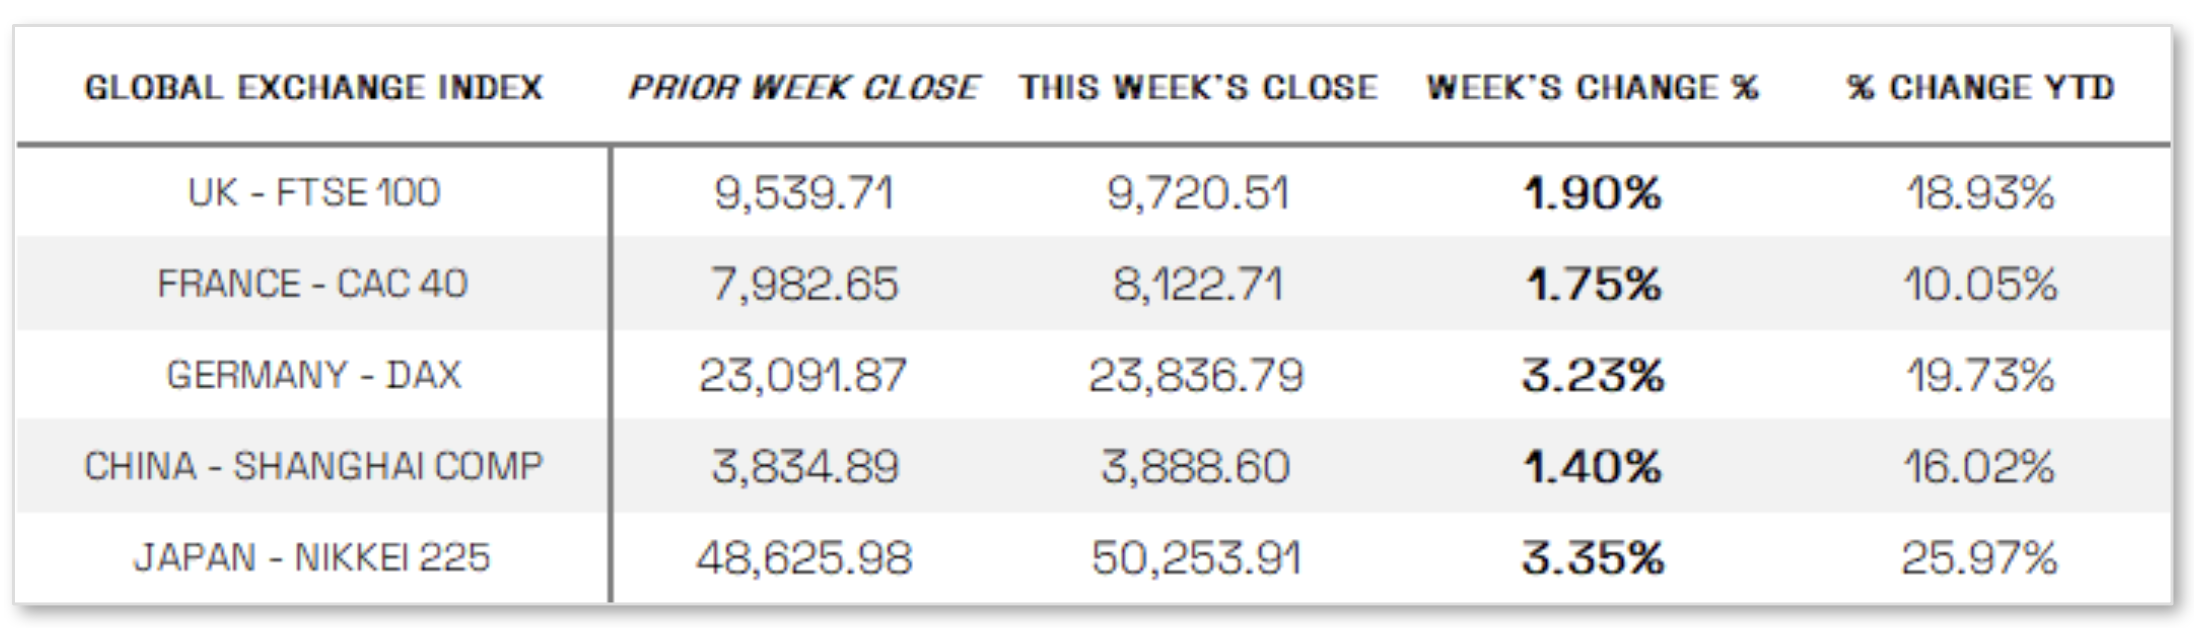
EUROPE: In local currency terms, the pan-European STOXX Europe 600 Index closed 2.35% higher. Major single-country stock indexes rose as well. Germany’s DAX gained 3.23%, Italy’s FTSE MIB added 1.63%, and France’s CAC 40 Index was up 1.75%. The UK’s FTSE 100 Index climbed 1.90%. Regional data suggest eurozone inflation could remain near ECB’s target Data from several regions indicated that inflation was relatively subdued in November, suggesting that broader eurozone inflation could remain around the European Central Bank’s (ECB’s) 2% target. According to data published Friday, consumer prices increased 0.8% year over year in France, in line with October’s reading, while inflation in Spain eased to 3.1% from 3.2% over the same period. Italy’s reading dropped to 1.1% from 1.3% in the prior month. Inflation data for the eurozone as a whole is scheduled to be published on December 2. Analysts are expecting the reading to come in at around 2.2%, according to data from FactSet.
JAPAN: Japan’s stock markets posted solid gains for the week, with the Nikkei 225 rising 3.35% and the broader TOPIX Index up 2.45%, buoyed by soft U.S. economic data and dovish commentary from Federal Reserve officials that boosted hopes for further U.S. rate cuts. Japanese tech and AI-related stocks rebounded in line with a U.S. tech rally, recovering from the previous week’s sell-off driven by valuation concerns. On the economic front, Tokyo’s core inflation held steady at 2.8% year over year in November, remaining above the Bank of Japan’s 2% target and fueling speculation of a potential rate hike ahead. Additionally, stronger-than-expected October data—such as industrial production, retail sales, and stable unemployment—supported optimism about the resilience of Japan’s domestic economy and progress toward sustained inflation.
CHINA: Mainland Chinese stock markets rose as investor optimism around domestic technology and artificial intelligence sectors outweighed concerns over slowing economic growth. The CSI 300 Index climbed 1.64%, while the Shanghai Composite gained 1.40%, and Hong Kong’s Hang Seng Index advanced 2.53%, according to FactSet. However, on the economic front, China’s industrial profits unexpectedly fell 5.5% year over year in October, following two consecutive months of 20%+ gains, signaling a potential loss of economic momentum in the fourth quarter. This decline came alongside data showing the producer price index remained in negative territory for a 37th straight month, despite Beijing’s efforts to reduce overproduction and price competition through its anti-involution campaign. Still, most analysts expect China to achieve its official growth target of around 5% for the year.
Sources:
>> All index and returns data from Norgate Data and Commodity Systems Incorporated and Wall Street Journal.
>> News from Reuters, Barron’s, Wall St. Journal, Bloomberg.com, ft.com, guggenheimpartners.com, zerohedge.com, ritholtz.com, markit.com, financialpost.com, Eurostat, Statistics Canada, Yahoo! Finance, stocksandnews.com, marketwatch.com, visualcapitalist.com, wantchinatimes.com, BBC, 361capital.com, pensionpartners.com, cnbc.com, FactSet, Morningstar/Ibbotson Associates, Corporate Finance Institute.
>> Commentary from T Rowe Price Global markets weekly update — https://www.troweprice.com/personal-investing/resources/insights/global-markets-weekly-update.html
Disclosures: This material and any mention of specific investments is provided for informational purposes only and is not intended to be investment advice or a recommendation to take any action. The forecasts or forward-looking statements are based on assumptions, may not materialize, and are subject to revision without notice. The market indexes discussed are unmanaged, and generally, considered representative of their respective markets. Index performance is not indicative of the past performance of a particular investment. Indexes do not incur management fees, costs, and expenses. Individuals cannot directly invest in unmanaged indexes. Past performance does not guarantee future results.
