


THE COMPLETE PICTURE
>> Four indicators across three time frames.
>> When all the Sherman Portfolios indicators are positive status, we read the market as being in a Bull Market.
1. DELTA-V — Positive since June 27, 2025
2. GALACTIC SHIELD — Positive since April 1, 2023
3. STARFLUX — Positive since May 12, 2025
4. STARPATH — Positive since August 15, 2025
The shorter term picture:
>> GALACTIC SHIELD — POSITIVE, This indicator is based on the combination of U.S. and International Equities trend statuses at the start of each quarter.
>> STARFLUX — POSITIVE, Starflux ended the week 3.34 (down 35.77% last week), This short-term indicator measures U.S. Equities. It measures the trend-strength of the Russell 3000 index.
>> STARPATH — POSITIVE, This indicator measures the interplay on dual timeframes of our Type 1s + the Russell 3000 + our four most ‘pro-cyclical’ Type 3s, vs. Cash.
The big picture:
The ‘big picture’ is the (typically) years-long timeframe, the same timeframe in which Cyclical Bulls and Bears operate.
>> The Sherman Portfolios DELTA-V Indicator measuring the Bull/Bear cycle finished the week in a Bull status at 65.07, down 5.37% from the prior week’s 68.76. It has signaled Bull since June 27, 2025.
>> The Sherman Portfolios DELTA-V Bond Indicator measuring the Bull/Bear cycle finished the week in BULL status at 60.78, down 0.85% from the prior week’s 61.30. It has signaled Bull since December 15, 2023.
The very big picture (a historical perspective): The CAPE is now at 38.94.
The cyclically adjusted price-to-earnings ratio (CAPE) can be used to smooth out the shorter-term earnings swings to get a longer-term assessment of market valuation. An extremely high CAPE ratio means that a company’s stock price is substantially higher than the company’s earnings would indicate and, therefore, overvalued. It is generally expected that the market will eventually correct the company’s stock price by pushing it down to its true value.
In the past, the CAPE ratio has proved its importance in identifying potential bubbles and market crashes. The historical average of the ratio for the S&P 500 Index is between 15-16, while the highest levels of the ratio have exceeded 30. The record-high levels occurred three times in the history of the U.S. financial markets. The first was in 1929 before the Wall Street crash that signaled the start of the Great Depression. The second was in the late 1990s before the Dotcom Crash, and the third came in 2007 before the 2007-2008 Financial Crisis. https://www.multpl.com/shiller-pe
 Note: We do not use CAPE as an official input into our methods. However, we think history serves as a guide and that it’s good to know where we are on the historic continuum.
THIS WEEK IN THE MARKETS
U.S. Markets:
Stocks down this week: Despite encouraging corporate earnings and positive government economic data, U.S. equity markets ended the week lower, attributed to the pullback to concerns about stretched stock valuations and doubts over whether artificial intelligence will ultimately generate profits sufficient to justify the enormous corporate investment behind it. The tech-heavy Nasdaq Composite saw the steepest declines, while the S&P MidCap 400 and Russell 2000 fared somewhat better but still fell, and the large-cap S&P 500 finished roughly 4.4% below its late-October record despite a volatile Friday rebound. NVIDIA’s highly anticipated earnings report, which showed record revenue and a stronger-than-expected fourth-quarter forecast driven by robust AI chip demand, initially boosted markets Thursday morning but ultimately failed to sustain momentum, as the stock reversed to close 3% lower amid renewed AI-related worries that dragged the broader indexes down as well. Investors also absorbed other major results, including Walmart’s stronger-than-expected performance—particularly in e-commerce—and its improved full-year outlook.
Looking at the US Indexes:
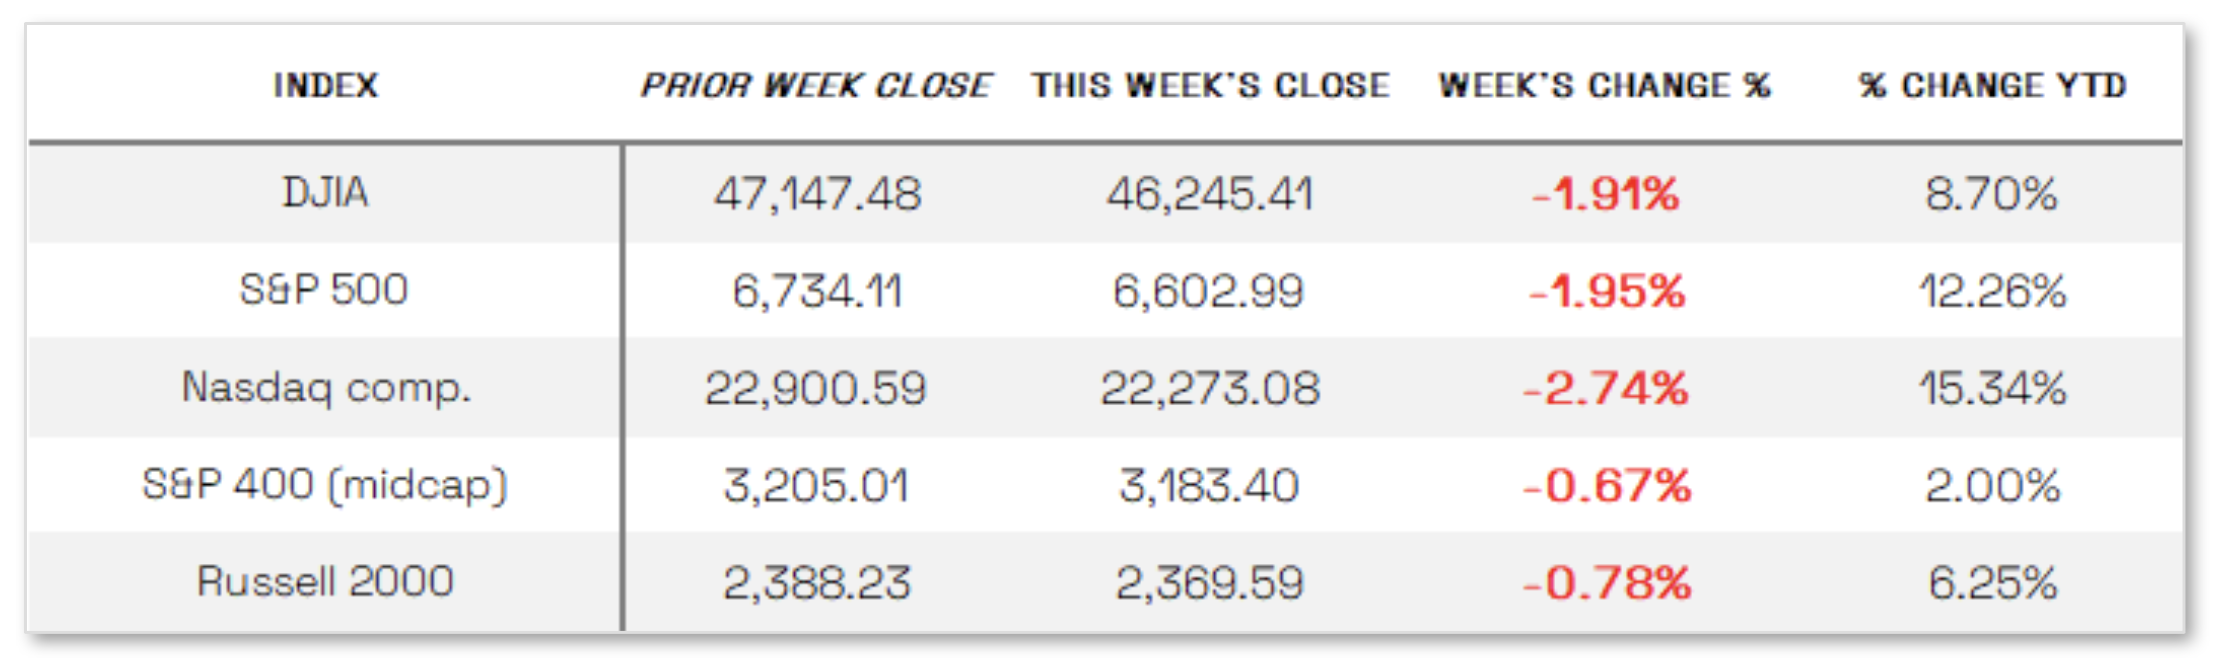
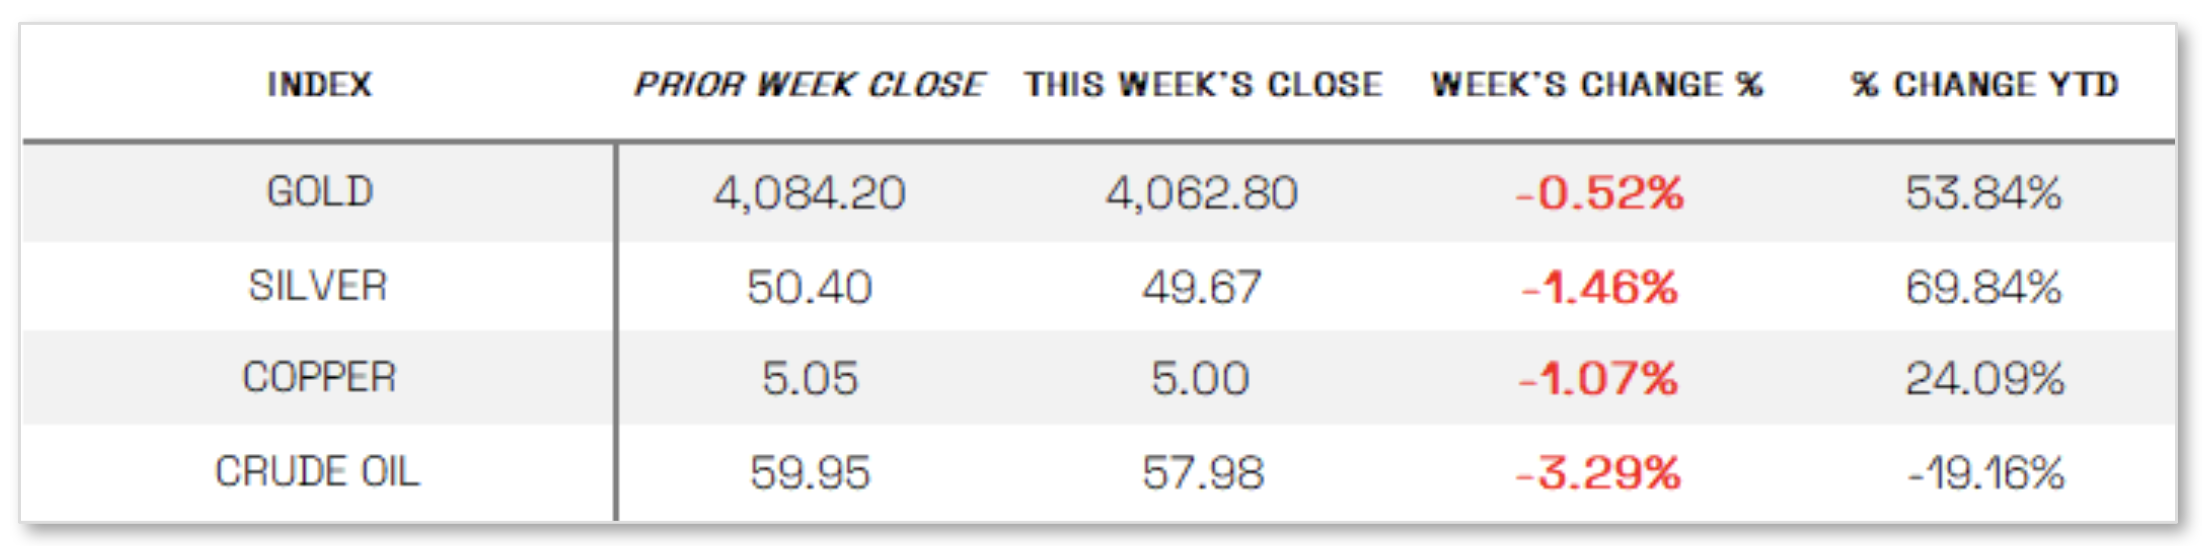
U.S. Commodities/Futures:
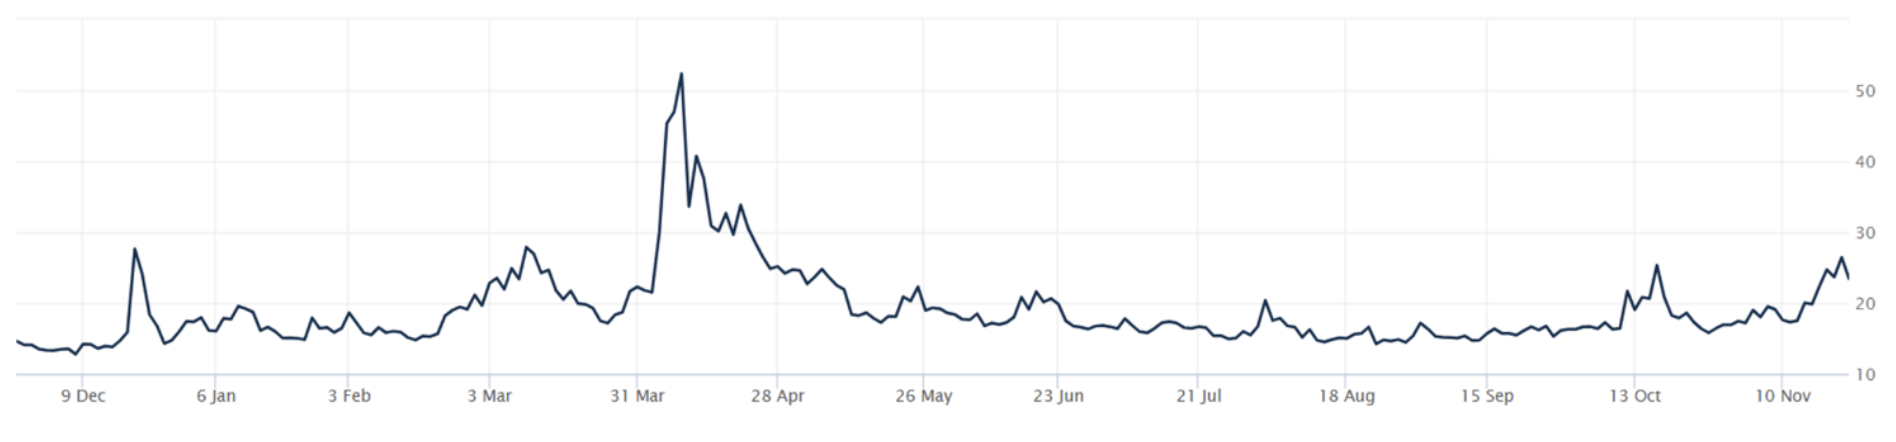
THE VOLATILITY INDEX (VIX) closed at 23.43 this week, an 18.2% increase vs last week’s close of 19.83.
International Markets:
THIS WEEK’S ECONOMIC NEWS
U.S. Economic News:
Mixed Economic Data:
The long-delayed September jobs report, held up six weeks by the government shutdown, offered a mixed economic signal on Thursday as employers added a stronger-than-expected 119,000 jobs—marking a rebound from the near-stall in summer hiring—while the unemployment rate rose to a four-year high of 4.4% from 4.3%, and the Bureau of Labor Statistics confirmed that the next report, covering November, will arrive December 16 with October’s canceled. At the same time, markets continued to fixate on whether the Federal Reserve will cut rates at its December 9–10 meeting, with October meeting minutes showing skepticism about another cut but New York Fed President John Williams’ Friday comments boosting hopes for near-term easing; by week’s end, futures pricing from CME Group indicated nearly a 70% probability of a December rate cut, sharply higher than 44% the week before.
International Economic News:
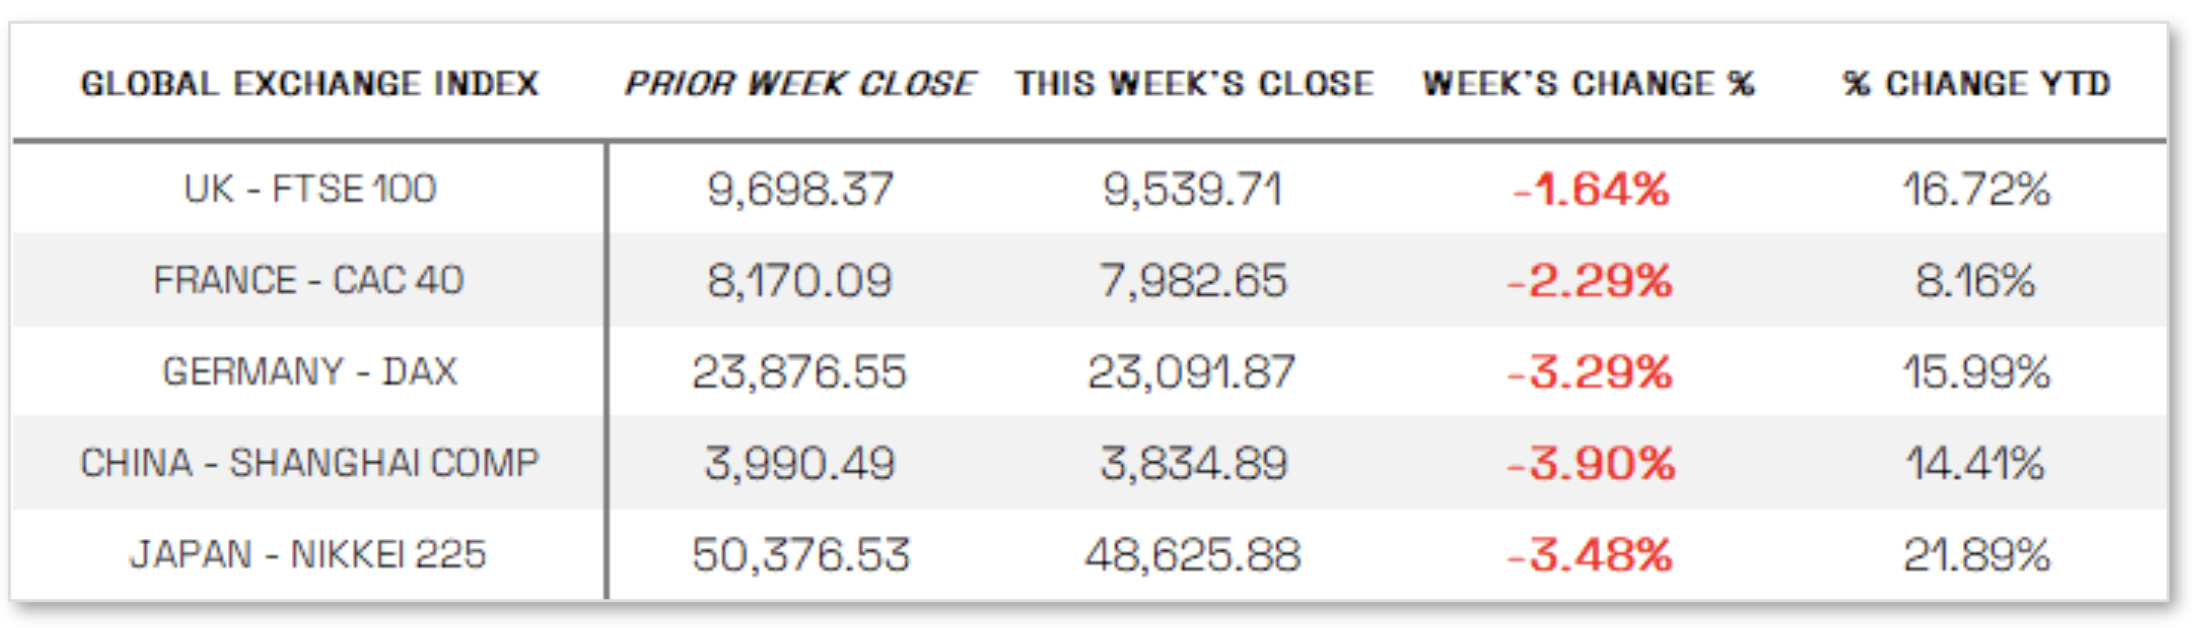
EUROPE: In local currency terms, the pan-European STOXX Europe 600 Index fell 2.21% amid renewed concerns over inflated AI stock valuations and diminished expectations for a U.S. rate cut, with major indexes also declining: France’s CAC 40 dropped 2.29%, Italy’s FTSE MIB slid 3.03%, Germany’s DAX lost 3.29%, and the UK’s FTSE 100 weakened 1.64%. Meanwhile, early November eurozone PMI readings from S&P Global showed steady overall expansion, as the composite PMI edged down slightly to 52.4—still above expectations—and the services PMI rose to an 18-month high of 53.1 while manufacturing dipped to 49.7; Germany’s output continued to grow at a slower pace, and France’s private-sector activity improved markedly, lifting its composite PMI from 47.7 to 49.9. Eurozone consumer confidence held steady at an eight-month high of –14.2 in November, though it came in slightly below expectations.
JAPAN: Japan’s stock markets declined over the week, with the Nikkei 225 falling 3.48% and the TOPIX down 1.85%, driven largely by sharp drops in AI-related technology shares amid persistent worries about stretched valuations. The government approved a JPY 21.3 trillion (about USD 135 billion) economic stimulus package—featuring spending, tax incentives, and targeted investment in areas such as shipbuilding and AI—marking progress on the expansionary fiscal measures anticipated under new Prime Minister Sanae Takaichi and aimed at supporting growth while easing inflationary pressures on households. However, concerns about the country’s mounting fiscal burden weighed on the yen, which weakened to around JPY 156.7 per USD from roughly JPY 154.5 the prior week, while the 10-year Japanese government bond yield climbed to 1.78%, briefly touching a 17-year high.
CHINA: Mainland Chinese stocks fell for the week, tracking Wall Street’s decline as worries over inflated valuations in AI-focused companies dampened risk appetite, with the CSI 300 down 3.77% and the Shanghai Composite off 3.90%, while Hong Kong’s Hang Seng Index dropped 5.09%; the CSI 300’s slide marked its second consecutive weekly decline after reaching a nearly four-year high earlier in November amid optimism about China’s tech progress. No major economic indicators were released, but Bloomberg reported that policymakers are weighing new measures to stabilize the struggling property sector—seen as a potential financial stability risk—including nationwide mortgage subsidies for first-time buyers, enhanced income tax rebates for mortgage holders, and lower home transaction costs.
Sources:
>> All index and returns data from Norgate Data and Commodity Systems Incorporated and Wall Street Journal.
>> News from Reuters, Barron’s, Wall St. Journal, Bloomberg.com, ft.com, guggenheimpartners.com, zerohedge.com, ritholtz.com, markit.com, financialpost.com, Eurostat, Statistics Canada, Yahoo! Finance, stocksandnews.com, marketwatch.com, visualcapitalist.com, wantchinatimes.com, BBC, 361capital.com, pensionpartners.com, cnbc.com, FactSet, Morningstar/Ibbotson Associates, Corporate Finance Institute.
>> Commentary from T Rowe Price Global markets weekly update — https://www.troweprice.com/personal-investing/resources/insights/global-markets-weekly-update.html
Disclosures: This material and any mention of specific investments is provided for informational purposes only and is not intended to be investment advice or a recommendation to take any action. The forecasts or forward-looking statements are based on assumptions, may not materialize, and are subject to revision without notice. The market indexes discussed are unmanaged, and generally, considered representative of their respective markets. Index performance is not indicative of the past performance of a particular investment. Indexes do not incur management fees, costs, and expenses. Individuals cannot directly invest in unmanaged indexes. Past performance does not guarantee future results.
