


THE COMPLETE PICTURE
>> Four indicators across three time frames.
>> When all the Sherman Portfolios indicators are positive status, we read the market as being in a Bull Market.
1. DELTA-V — Positive since June 27, 2025
2. GALACTIC SHIELD — Positive since April 1, 2023
3. STARFLUX — Positive since May 12, 2025
4. STARPATH — Positive since August 15, 2025
The shorter term picture:
>> GALACTIC SHIELD — POSITIVE, This indicator is based on the combination of U.S. and International Equities trend statuses at the start of each quarter.
>> STARFLUX — POSITIVE, Starflux ended the week 5.20 (down 1.51% last week). This short-term indicator measures U.S. Equities. It measures the trend-strength of the Russell 3000 index.
>> STARPATH — POSITIVE, This indicator measures the interplay on dual timeframes of our Type 1s + the Russell 3000 + our four most ‘pro-cyclical’ Type 3s, vs. Cash
The big picture:
The ‘big picture’ is the (typically) years-long timeframe, the same timeframe in which Cyclical Bulls and Bears operate.
>> The Sherman Portfolios DELTA-V Indicator measuring the Bull/Bear cycle finished the week in a Bull status at 68.76, down 3.13% from the prior week’s 70.98. It has signaled Bull since June 27, 2025.
>> The Sherman Portfolios DELTA-V Bond Indicator measuring the Bull/Bear cycle finished the week in BULL status at 61.30, down 5.33% from the prior week’s 64.75. It has signaled Bull since December 15, 2023.
The very big picture (a historical perspective): The CAPE is now at 39.72.
The cyclically adjusted price-to-earnings ratio (CAPE) can be used to smooth out the shorter-term earnings swings to get a longer-term assessment of market valuation. An extremely high CAPE ratio means that a company’s stock price is substantially higher than the company’s earnings would indicate and, therefore, overvalued. It is generally expected that the market will eventually correct the company’s stock price by pushing it down to its true value.
In the past, the CAPE ratio has proved its importance in identifying potential bubbles and market crashes. The historical average of the ratio for the S&P 500 Index is between 15-16, while the highest levels of the ratio have exceeded 30. The record-high levels occurred three times in the history of the U.S. financial markets. The first was in 1929 before the Wall Street crash that signaled the start of the Great Depression. The second was in the late 1990s before the Dotcom Crash, and the third came in 2007 before the 2007-2008 Financial Crisis. https://www.multpl.com/shiller-pe
 Note: We do not use CAPE as an official input into our methods. However, we think history serves as a guide and that it’s good to know where we are on the historic continuum.
THIS WEEK IN THE MARKETS
U.S. Markets:
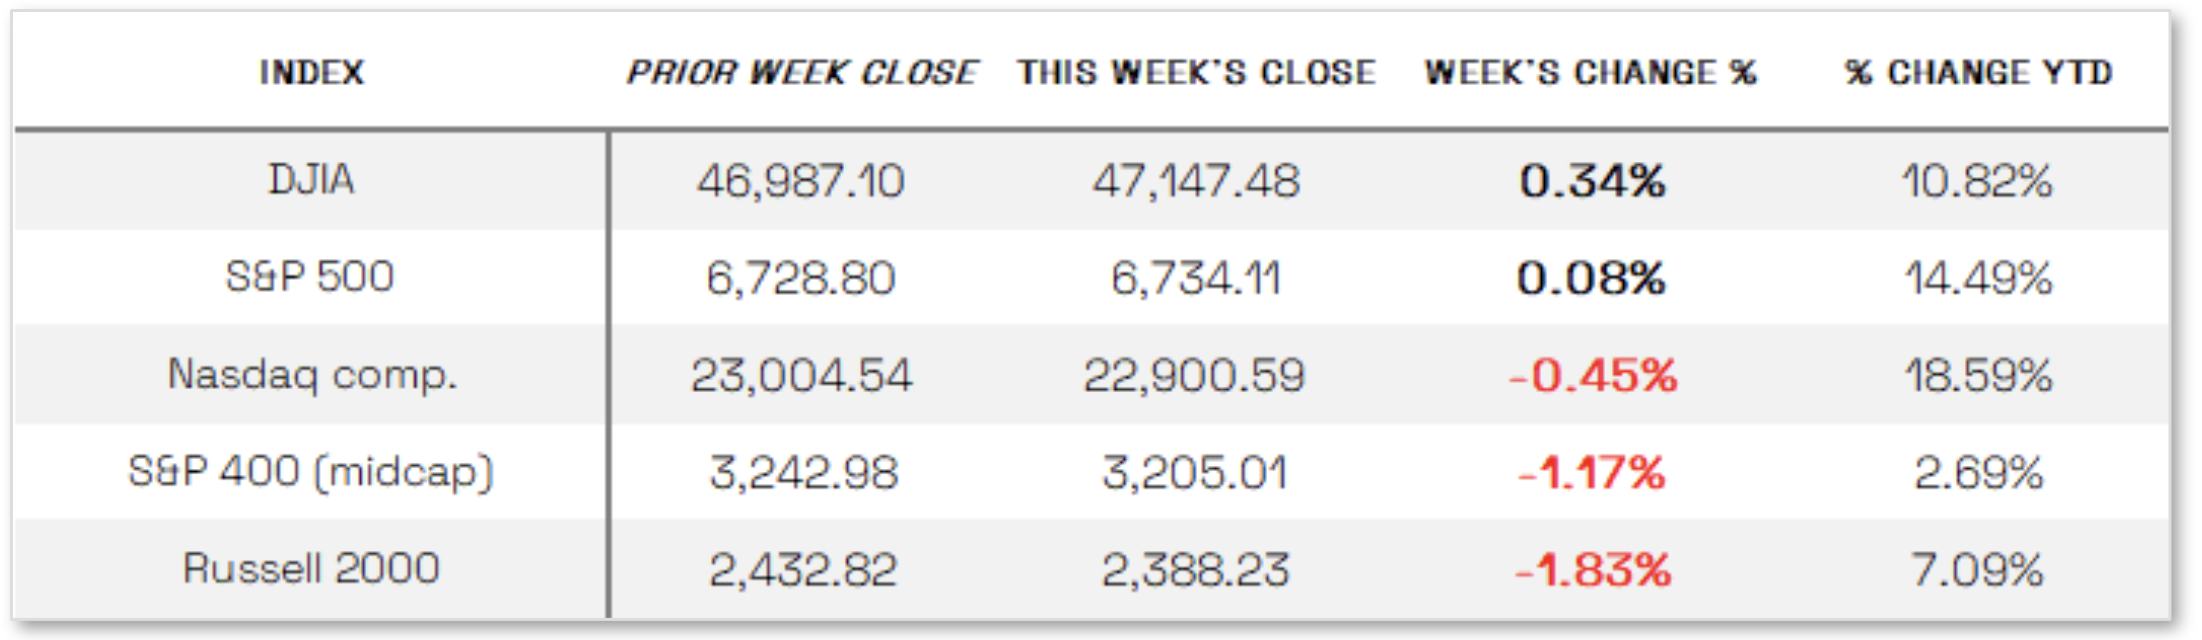
Stocks Mixed this week: U.S. stocks ended the week with mixed results: the Dow Jones Industrial Average and S&P 500 posted modest gains, while the Nasdaq Composite, S&P MidCap 400, and small-cap Russell 2000 declined amid concerns about elevated valuations and increased scrutiny of artificial intelligence spending, which contributed to a rotation out of growth-oriented names that had recently driven markets to record highs. Although stocks were mostly lower through Thursday, a volatile but catalyst-light session on Friday helped some indexes recover enough to finish the week higher. Meanwhile, the longest U.S. government shutdown on record ended Wednesday night after President Donald Trump signed a spending bill funding the government through January 30, removing a key market headwind even as uncertainty lingered regarding how quickly conditions would normalize. Economic data also remained in focus: White House officials warned that October jobs and inflation data may never be released, and the Bureau of Labor Statistics said it needed more time to determine future release dates, later announcing that the delayed September jobs report will be issued on Thursday, November 20.
Looking at the US Indexes:
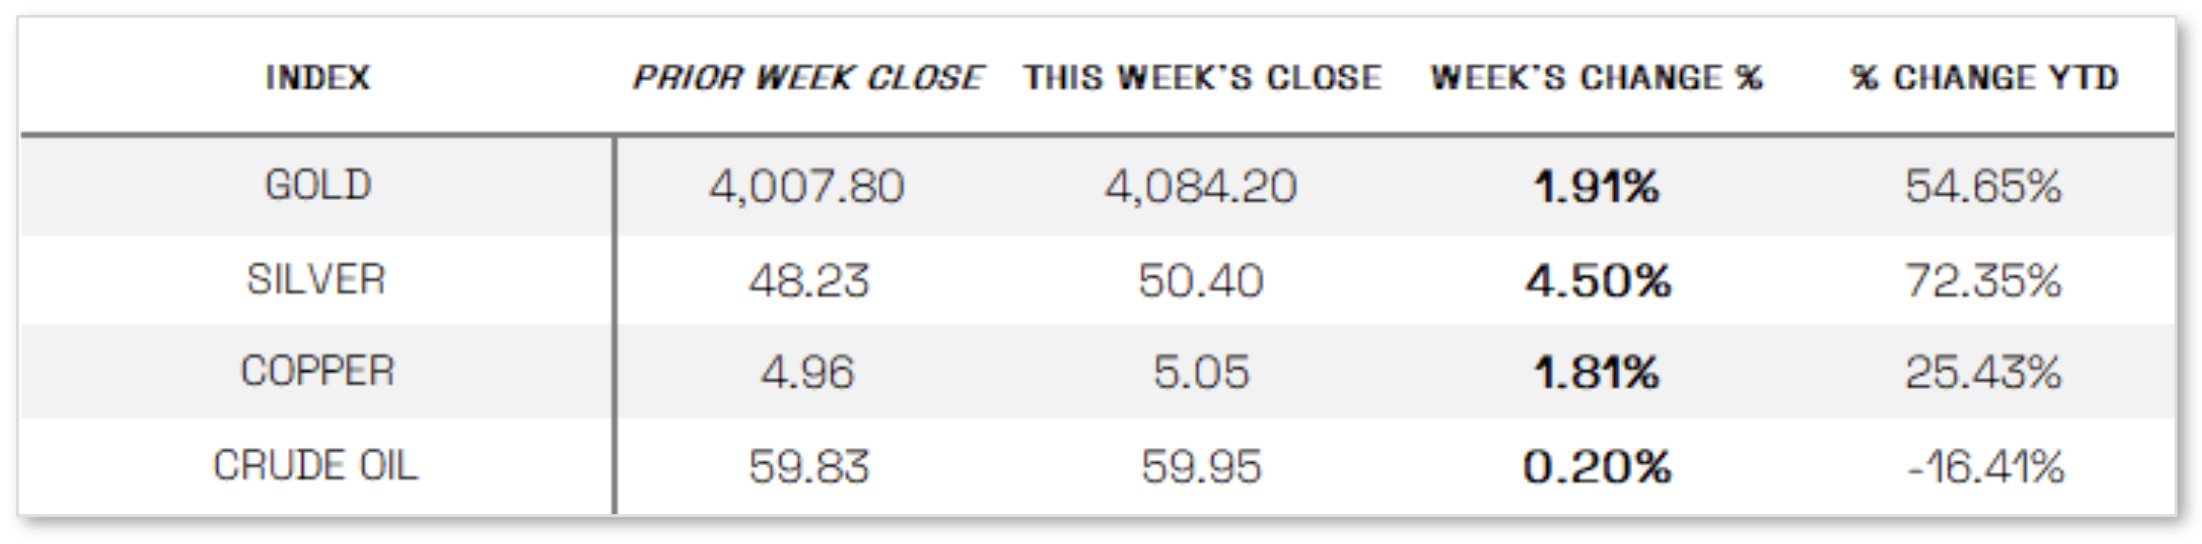
U.S. Commodities/Futures:
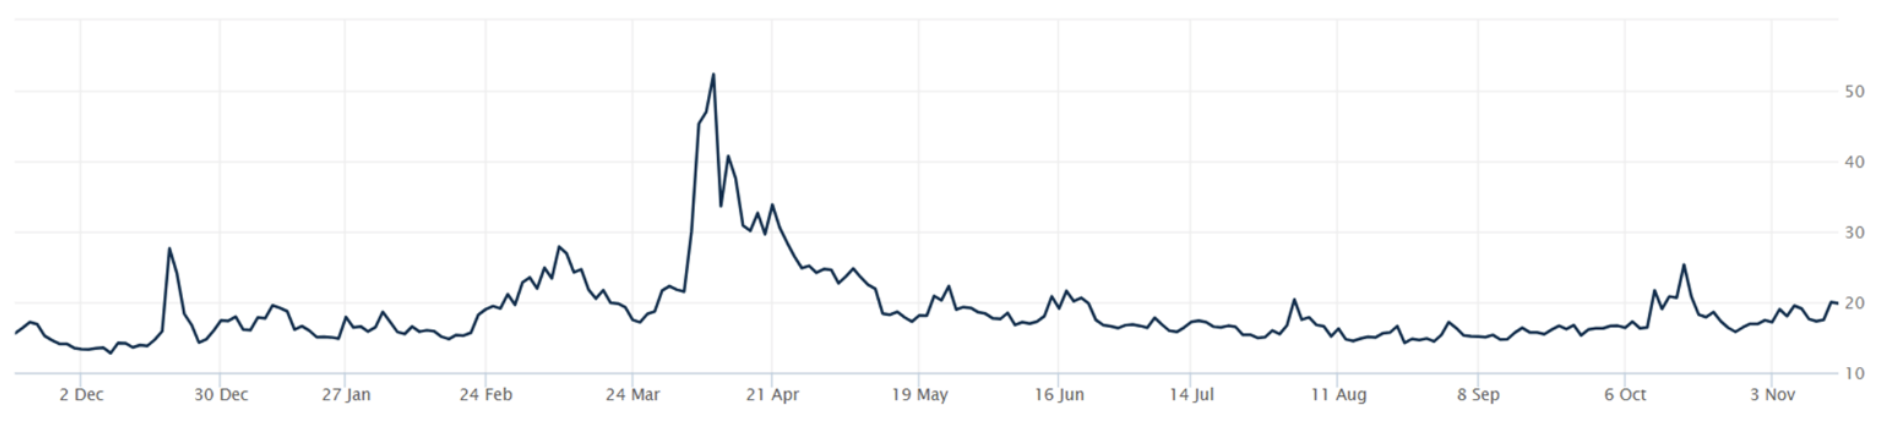
THE VOLATILITY INDEX (VIX) closed at 19.83 this week, a 3.9% increase vs last week’s close of 19.08.
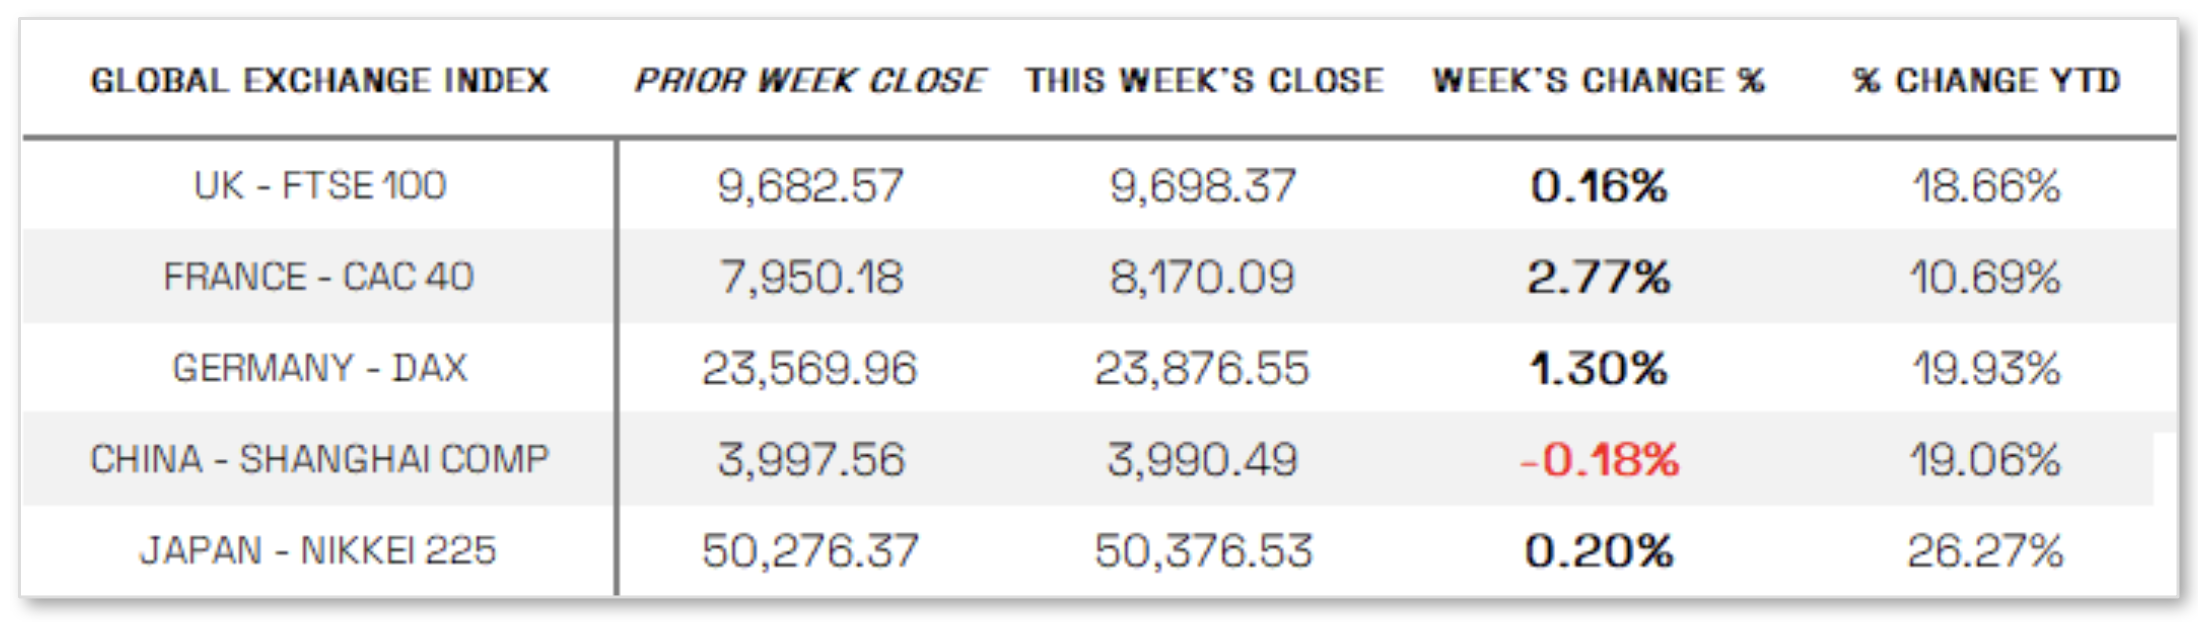
International Markets:
THIS WEEK’S ECONOMIC NEWS
U.S. Economic News:
Fed cautious about rate cut:
Hawkish commentary from several Federal Reserve officials pressured equity markets as the perceived likelihood of a December rate cut declined. Atlanta Fed President Raphael Bostic said Wednesday that labor-market signals remain “ambiguous and difficult to interpret,” arguing they are not clear enough to justify an aggressive policy response given the more evident risk of persistent inflation; he views current policy as only “marginally restrictive” and supports holding rates steady until there is clear progress toward the Fed’s 2% inflation target. St. Louis Fed President Alberto Musalem similarly emphasized the need for policymakers to “proceed and tread with caution,” while Cleveland Fed President Beth Hammack said policy should “remain somewhat restrictive” amid stubborn inflation concerns. Reflecting this shift in tone, the probability of a December rate cut fell to roughly 46% by Friday afternoon—down from 67% a week earlier and nearly 95% a month ago, according to the CME FedWatch tool—and small-cap stocks, which are more sensitive to interest-rate expectations, lagged notably with the Russell 2000 Index falling 1.83%.
International Economic News:
EUROPE: In local-currency terms, the pan-European STOXX Europe 600 Index rose 1.77% as markets welcomed the reopening of the U.S. federal government, though cooling enthusiasm around artificial intelligence tempered gains; most major markets advanced, with Germany’s DAX up 1.30%, France’s CAC 40 up 2.77%, and Italy’s FTSE MIB up 2.51%, while the UK’s FTSE 100 was little changed. In the UK, weaker-than-expected labor market and growth data disappointed investors and prompted a sharp increase in expectations for a Bank of England rate cut in December: unemployment in the three months through September rose to 5% for the first time since early 2021, and wage growth slowed as regular earnings grew 4.6% year over year, down from 4.8%. Economic momentum also softened as GDP expanded just 0.1% in the third quarter—below forecasts of 0.2%—and contracted 0.1% in September, pressured in part by a 28.6% drop in car production following a cyberattack-related shutdown at Jaguar Land Rover.
JAPAN: Japan’s stock markets advanced over the week, with the Nikkei 225 up 0.20% and the broader TOPIX rising 1.85%, supported by improved global sentiment following the end of the longest U.S. government shutdown, though concerns about stretched valuations for AI-related companies continued to weigh on Japan’s technology sector. Expectations of policy shifts under new Prime Minister Sanae Takaichi also influenced markets, as her administration signaled support for loose fiscal policy and a cautious approach by the Bank of Japan toward raising interest rates—factors that put downward pressure on the yen, which weakened to about JPY 154.6 per U.S. dollar from roughly JPY 153.4 the previous week. Takaichi has pushed for more flexible spending by reevaluating the government’s single-year fiscal discipline target and proposing a multi-year framework, arguing that responsible but aggressive fiscal measures are needed to bolster economic growth.
CHINA: Mainland Chinese stocks declined as investors took profits after the domestic benchmark reached a nearly four-year high the prior week, with the CSI 300 down 1.08% and the Shanghai Composite slipping 0.18%, while Hong Kong’s Hang Seng Index rose 1.26%. Fresh economic indicators showed China losing momentum entering the fourth quarter: fixed asset investment fell 1.7% in the first 10 months of the year, its largest drop on record for the period; industrial production grew a weaker-than-expected 4.9% year over year in October; and retail sales rose just 2.9%, marking a fifth consecutive month of slowing growth. The property sector also continued to struggle, as new home prices across 70 cities fell 0.45% in October—the sharpest decline in a year—and existing home prices dropped 0.66%, the steepest in 13 months, reflecting a prolonged housing slump that has dampened consumption and exacerbated deflationary pressures since early 2023. Despite the softer-than-expected October data, most economists still view Beijing’s roughly 5% annual growth target as attainable, aided by a one-year U.S.–China trade truce reached last month and more than RMB 1 trillion in recently approved central-government stimulus expected to begin supporting activity soon.
Sources:
>> All index and returns data from Norgate Data and Commodity Systems Incorporated and Wall Street Journal.
>> News from Reuters, Barron’s, Wall St. Journal, Bloomberg.com, ft.com, guggenheimpartners.com, zerohedge.com, ritholtz.com, markit.com, financialpost.com, Eurostat, Statistics Canada, Yahoo! Finance, stocksandnews.com, marketwatch.com, visualcapitalist.com, wantchinatimes.com, BBC, 361capital.com, pensionpartners.com, cnbc.com, FactSet, Morningstar/Ibbotson Associates, Corporate Finance Institute.
>> Commentary from T Rowe Price Global markets weekly update — https://www.troweprice.com/personal-investing/resources/insights/global-markets-weekly-update.html
Disclosures: This material and any mention of specific investments is provided for informational purposes only and is not intended to be investment advice or a recommendation to take any action. The forecasts or forward-looking statements are based on assumptions, may not materialize, and are subject to revision without notice. The market indexes discussed are unmanaged, and generally, considered representative of their respective markets. Index performance is not indicative of the past performance of a particular investment. Indexes do not incur management fees, costs, and expenses. Individuals cannot directly invest in unmanaged indexes. Past performance does not guarantee future results.
