


THE COMPLETE PICTURE
>> Four indicators across three time frames.
>> When all the Sherman Portfolios indicators are positive status, we read the market as being in a Bull Market.
1. DELTA-V — Positive since June 27, 2025
2. GALACTIC SHIELD — Positive since April 1, 2023
3. STARFLUX — Positive since May 12, 2025
4. STARPATH — Positive since August 15, 2025
The shorter term picture:
>> GALACTIC SHIELD — POSITIVE, This indicator is based on the combination of U.S. and International Equities trend statuses at the start of each quarter.
>> STARFLUX — POSITIVE, Starflux ended the week 7.01 (down 11.04% last week). This short-term indicator measures U.S. Equities. It measures the trend-strength of the Russell 3000 index.
>> STARPATH — POSITIVE, This indicator measures the interplay on dual timeframes of our Type 1s + the Russell 3000 + our four most ‘pro-cyclical’ Type 3s, vs. Cash.
The big picture:
The ‘big picture’ is the (typically) years-long timeframe, the same timeframe in which Cyclical Bulls and Bears operate.
>> The Sherman Portfolios DELTA-V Indicator measuring the Bull/Bear cycle finished the week in a Bull status at 73.18, up 1.58% from the prior week’s 72.04. It has signaled Bull since June 27, 2025.
>> The Sherman Portfolios DELTA-V Bond Indicator measuring the Bull/Bear cycle finished the week in BULL status at 67.58, down 3.58% from the prior week’s 70.09. It has signaled Bull since December 15, 2023.
The very big picture (a historical perspective): The CAPE is now at 40.88.
The cyclically adjusted price-to-earnings ratio (CAPE) can be used to smooth out the shorter-term earnings swings to get a longer-term assessment of market valuation. An extremely high CAPE ratio means that a company’s stock price is substantially higher than the company’s earnings would indicate and, therefore, overvalued. It is generally expected that the market will eventually correct the company’s stock price by pushing it down to its true value.
In the past, the CAPE ratio has proved its importance in identifying potential bubbles and market crashes. The historical average of the ratio for the S&P 500 Index is between 15-16, while the highest levels of the ratio have exceeded 30. The record-high levels occurred three times in the history of the U.S. financial markets. The first was in 1929 before the Wall Street crash that signaled the start of the Great Depression. The second was in the late 1990s before the Dotcom Crash, and the third came in 2007 before the 2007-2008 Financial Crisis. https://www.multpl.com/shiller-pe
 Note: We do not use CAPE as an official input into our methods. However, we think history serves as a guide and that it’s good to know where we are on the historic continuum.
THIS WEEK IN THE MARKETS
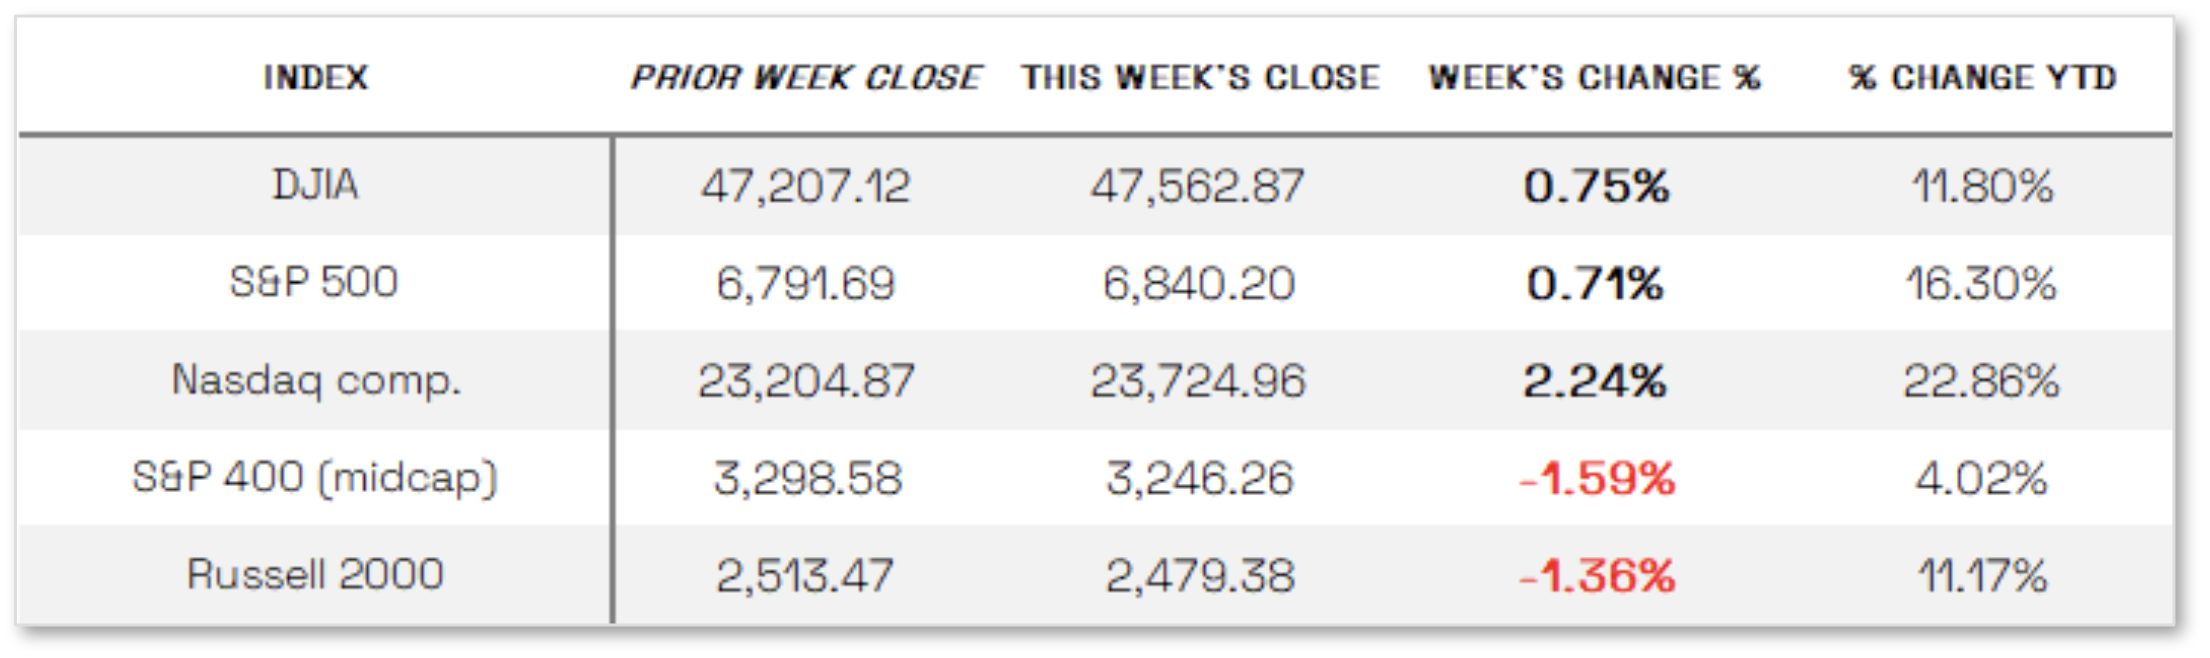
U.S. Markets:
Stock mixed this week: U.S. equity indexes ended the week mixed, with large-cap benchmarks gaining while smaller-cap indexes declined. The Nasdaq Composite led the advance, driven by ongoing strength in mega-cap technology stocks benefiting from artificial intelligence investment. However, market breadth remained narrow, as the S&P 500 rose despite losses in seven of its 11 sectors, and its equal-weighted counterpart underperformed by 2.68 percentage points. Third-quarter earnings season accelerated, with more than one-third of S&P 500 companies— including five of the “Magnificent Seven”—reporting results. FactSet data showed that by Friday morning, 64% of companies had reported, and 83% exceeded earnings expectations. Investor reactions were mixed: shares of Microsoft, Apple, and Meta Platforms declined after results, while Amazon and Alphabet advanced. Meanwhile, NVIDIA’s stock surged, briefly lifting the chipmaker’s market capitalization above USD 5 trillion, marking the first time any company has reached that milestone.
Looking at the US Indexes:
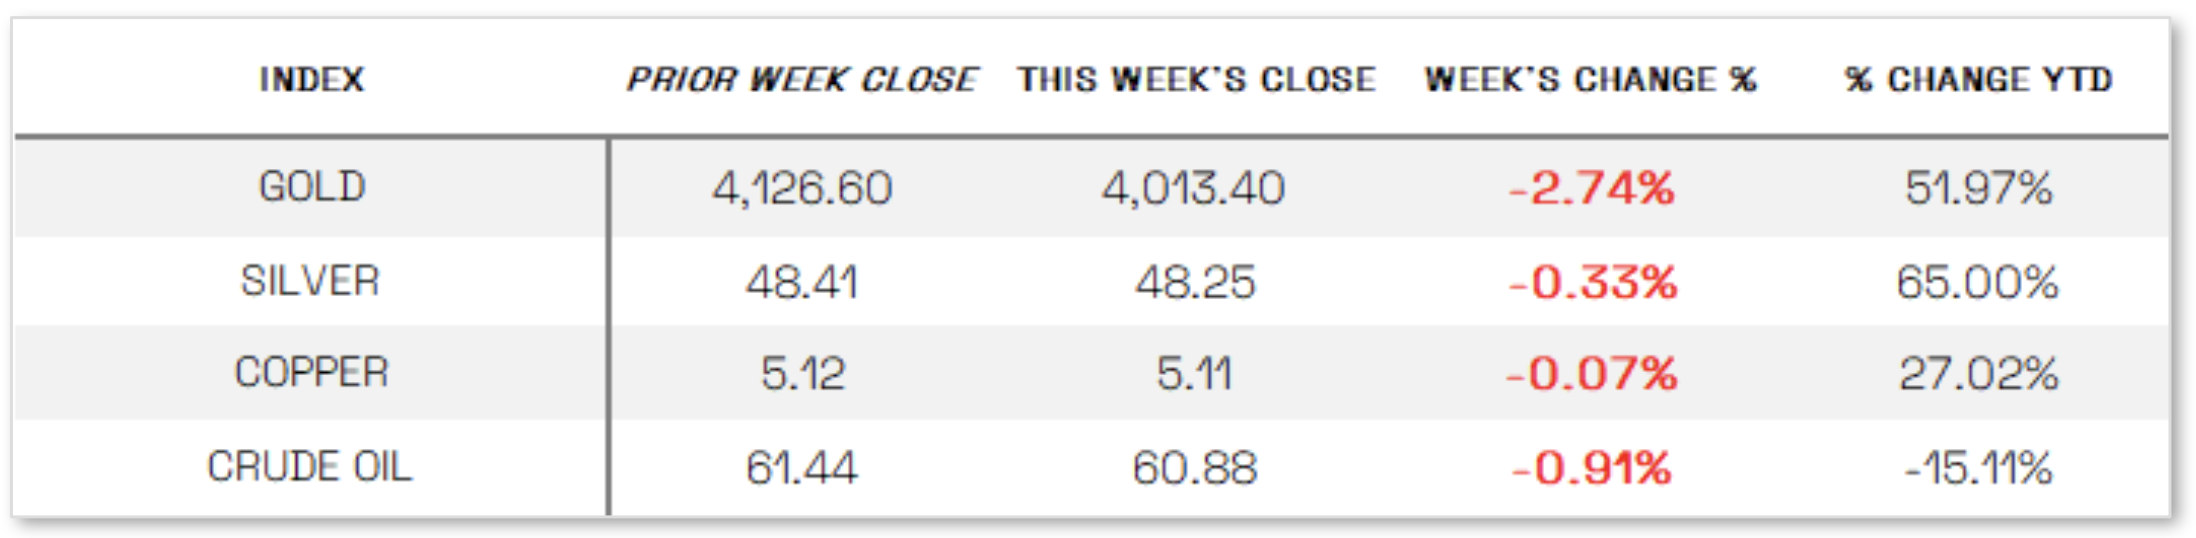
U.S. Commodities/Futures:
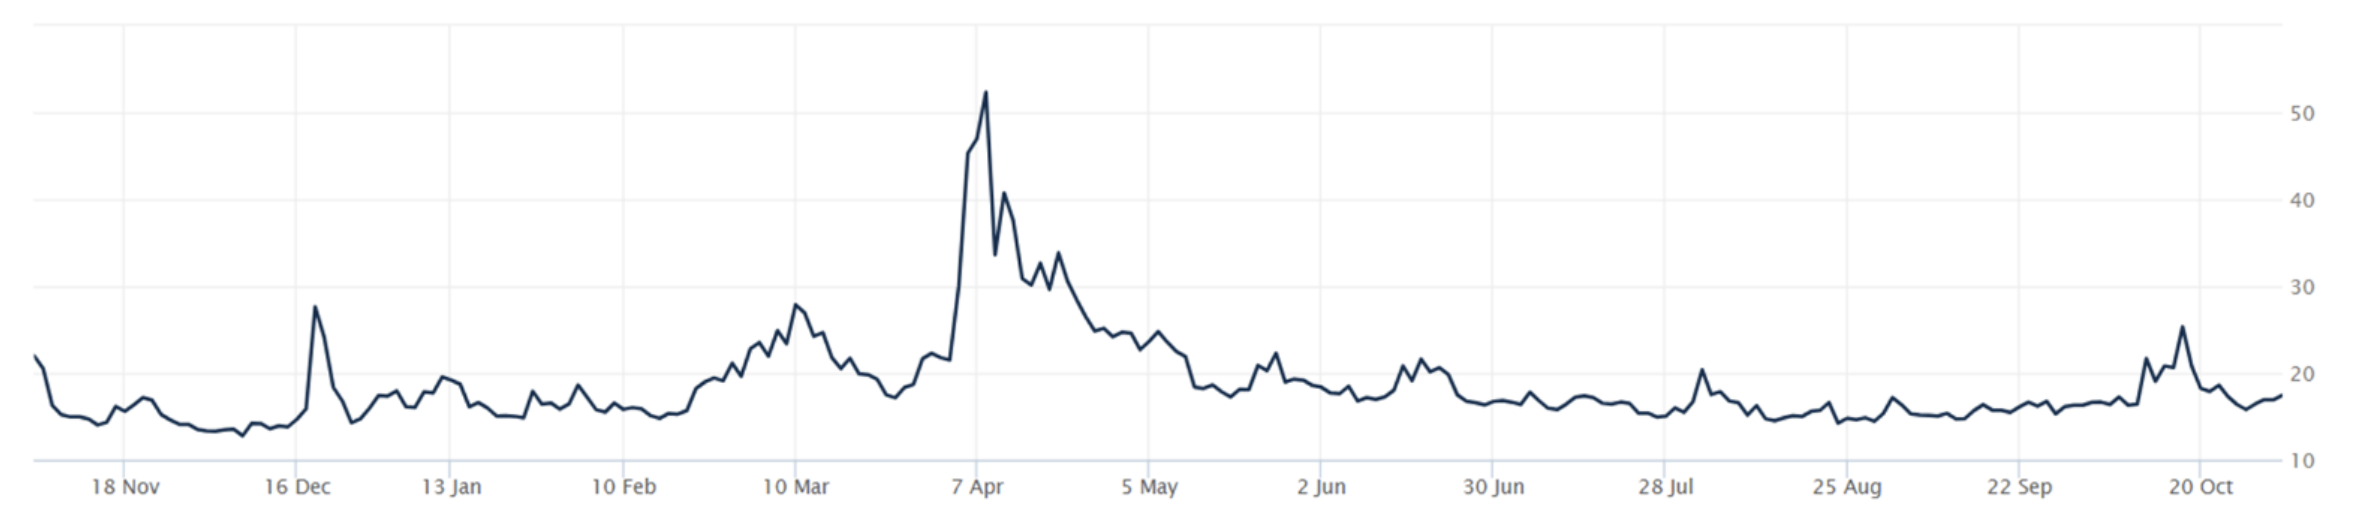
THE VOLATILITY INDEX (VIX) closed at 17.44 this week, a 6.5% increase vs last week’s close of 16.37.
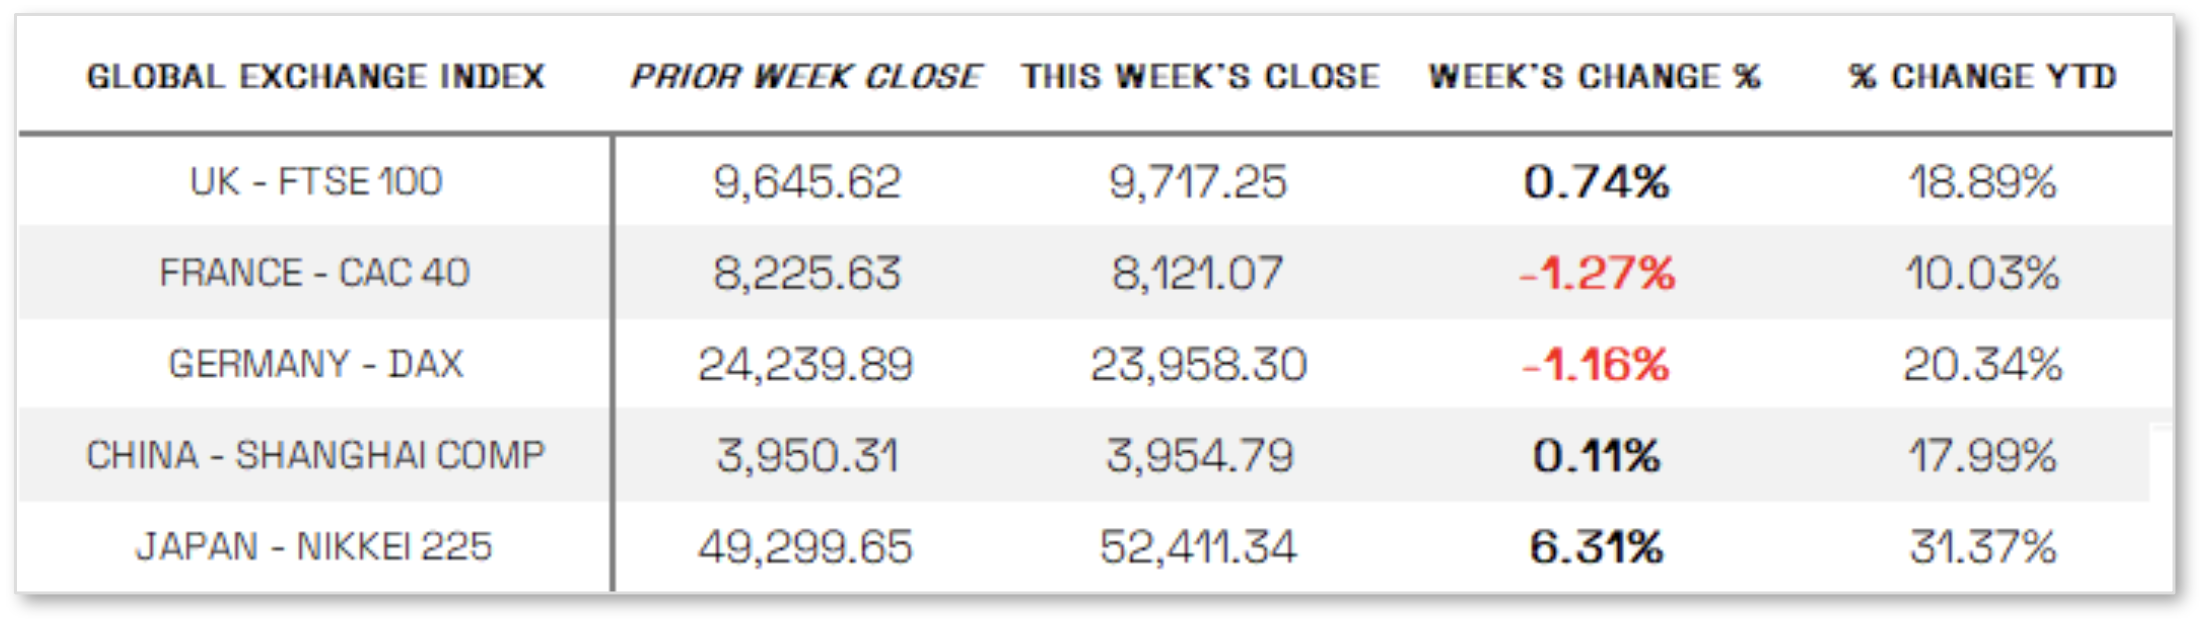
International Markets:
THIS WEEK’S ECONOMIC NEWS
U.S. Economic News:
Trade truce with China, while Fed lowers rates:
Heading into the week, markets focused on a Thursday meeting in South Korea between U.S. President Donald Trump and Chinese President Xi Jinping, where the two leaders agreed to a one-year trade truce aimed at easing tensions between the world’s largest economies. The deal included a reduction in U.S. tariffs on Chinese imports, China’s suspension of export controls on rare earth materials, and the resumption of Chinese purchases of U.S. soybeans and other agricultural goods. While modest in scope and leaving room for future disputes, the agreement provided temporary relief and improved investor sentiment. Meanwhile, the Federal Reserve dominated attention midweek by lowering its target range for the federal funds rate by 25 basis points to 3.75%–4.00%, as expected. The decision exposed divisions within the Fed, with Governor Stephen Miran favoring a deeper cut and Kansas City Fed President Jeffrey Schmid preferring no change. In his post-meeting remarks, Fed Chair Jerome Powell signaled caution about further easing, emphasizing that another rate cut in December was “not a foregone conclusion” and noting that policymakers may adopt a more measured stance amid limited economic data caused by the ongoing federal government shutdown.
International Economic News:
EUROPE: In local currency terms, the pan-European STOXX Europe 600 Index declined 0.67% after reaching a new high earlier in the week, as fading expectations for additional European Central Bank (ECB) rate cuts weighed on sentiment. Major markets were mixed, with France’s CAC 40 down 1.27%, Germany’s DAX off 1.16%, and Italy’s FTSE MIB up 1.62%, while the UK’s FTSE 100 rose 0.74%, supported by a weaker British pound that benefits multinational companies with significant overseas revenues. The ECB, as anticipated, left interest rates unchanged for the third straight meeting, noting that inflation remains close to its 2% target. President Christine Lagarde reaffirmed that monetary policy decisions will continue to be data dependent and made on a meeting-by-meeting basis, emphasizing that while the eurozone economy is growing and inflation is stable, uncertainty persists due to global trade disputes and geopolitical tensions.
JAPAN: Japan’s stock markets surged to new record highs, with the Nikkei 225 Index jumping 6.31% and the broader TOPIX Index rising 1.91% for the week, marking the Nikkei’s strongest monthly gain since January 1994 with a 16.6% increase in October. Investor optimism was fueled by the Bank of Japan’s (BoJ) decision to keep interest rates unchanged, anticipation of a major economic stimulus package, and strong earnings from U.S. tech giants Amazon and Apple, which lifted technology shares. At a press conference, BoJ Governor Kazuo Ueda maintained a hawkish tone, stating that the likelihood of a rate hike is increasing, though he shifted focus from underlying inflation to monitoring conditions ahead of spring wage negotiations, especially in the tariff-sensitive auto sector. The Japanese yen weakened to around JPY 154 per U.S. dollar from JPY 152.9 the previous week, as expectations for an imminent rate hike faded, prompting new Finance Minister Satsuki Katayama to warn against “excessive fluctuations” in currency markets. Meanwhile, the 10-year Japanese government bond yield held steady near 1.65%.
CHINA: Mainland Chinese stocks ended the week mixed as lingering concerns over a slowing economy offset optimism about easing U.S.-China trade tensions. The onshore CSI 300 Index slipped 0.43%, while the Shanghai Composite Index inched up 0.11%, according to FactSet data. In Hong Kong, the benchmark Hang Seng Index fell 0.97%, reflecting continued investor caution despite signs of improving trade relations.
Sources:
>> All index and returns data from Norgate Data and Commodity Systems Incorporated and Wall Street Journal.
>> News from Reuters, Barron’s, Wall St. Journal, Bloomberg.com, ft.com, guggenheimpartners.com, zerohedge.com, ritholtz.com, markit.com, financialpost.com, Eurostat, Statistics Canada, Yahoo! Finance, stocksandnews.com, marketwatch.com, visualcapitalist.com, wantchinatimes.com, BBC, 361capital.com, pensionpartners.com, cnbc.com, FactSet, Morningstar/Ibbotson Associates, Corporate Finance Institute.
>> Commentary from T Rowe Price Global markets weekly update — https://www.troweprice.com/personal-investing/resources/insights/global-markets-weekly-update.html
Disclosures: This material and any mention of specific investments is provided for informational purposes only and is not intended to be investment advice or a recommendation to take any action. The forecasts or forward-looking statements are based on assumptions, may not materialize, and are subject to revision without notice. The market indexes discussed are unmanaged, and generally, considered representative of their respective markets. Index performance is not indicative of the past performance of a particular investment. Indexes do not incur management fees, costs, and expenses. Individuals cannot directly invest in unmanaged indexes. Past performance does not guarantee future results.
