


THE COMPLETE PICTURE
>> Four indicators across three time frames.
>> When all the Sherman Portfolios indicators are positive status, we read the market as being in a Bull Market.
1. DELTA-V — Positive since June 27, 2025
2. GALACTIC SHIELD — Positive since April 1, 2023
3. STARFLUX — Positive since May 12, 2025
4. STARPATH — Positive since August 15, 2025
The shorter term picture:
>> GALACTIC SHIELD — POSITIVE, This indicator is based on the combination of U.S. and International Equities trend statuses at the start of each quarter.
>> STARFLUX — POSITIVE,, Starflux ended the week 7.88 (Up 30.03% last week). This short-term indicator measures U.S. Equities. It measures the trend-strength of the Russell 3000 index.
>> STARPATH — POSITIVE, This indicator measures the interplay on dual timeframes of our Type 1s + the Russell 3000 + our four most ‘pro-cyclical’ Type 3s, vs. Cash.
The big picture:
The ‘big picture’ is the (typically) years-long timeframe, the same timeframe in which Cyclical Bulls and Bears operate.
>> The Sherman Portfolios DELTA-V Indicator measuring the Bull/Bear cycle finished the week in a Bull status at 72.04, up 1.29% from the prior week’s 71.12. It has signaled Bull since June 27, 2025.
>> The Sherman Portfolios DELTA-V Bond Indicator measuring the Bull/Bear cycle finished the week in BULL status at 70.09, up 2.65% from the prior week’s 68.28. It has signaled Bull since December 15, 2023.
The very big picture (a historical perspective): The CAPE is now at 40.58.
The cyclically adjusted price-to-earnings ratio (CAPE) can be used to smooth out the shorter-term earnings swings to get a longer-term assessment of market valuation. An extremely high CAPE ratio means that a company’s stock price is substantially higher than the company’s earnings would indicate and, therefore, overvalued. It is generally expected that the market will eventually correct the company’s stock price by pushing it down to its true value.
In the past, the CAPE ratio has proved its importance in identifying potential bubbles and market crashes. The historical average of the ratio for the S&P 500 Index is between 15-16, while the highest levels of the ratio have exceeded 30. The record-high levels occurred three times in the history of the U.S. financial markets. The first was in 1929 before the Wall Street crash that signaled the start of the Great Depression. The second was in the late 1990s before the Dotcom Crash, and the third came in 2007 before the 2007-2008 Financial Crisis. https://www.multpl.com/shiller-pe
 Note: We do not use CAPE as an official input into our methods. However, we think history serves as a guide and that it’s good to know where we are on the historic continuum.
THIS WEEK IN THE MARKETS
U.S. Markets:
Stock up this week: Stocks advanced for the week, overcoming volatile headlines about U.S.-China trade relations and a spike in oil prices following U.S. sanctions on Russia’s two largest oil companies. Small- and mid-cap indexes, including the Russell 2000 and S&P MidCap 400, outperformed larger-cap benchmarks, while within the S&P 500, information technology and energy sectors led gains as utilities and consumer staples declined. Despite the ongoing U.S. government shutdown disrupting key economic data releases, the Bureau of Labor Statistics published September inflation figures on October 24 to facilitate the Social Security cost-of-living adjustment. Headline inflation rose to 3.0% from 2.9% in August, slightly below the Bloomberg consensus estimate of 3.1%, while core inflation, excluding food and energy, also registered 3.0%, marking a modest decline from the previous month.
Looking at the US Indexes:

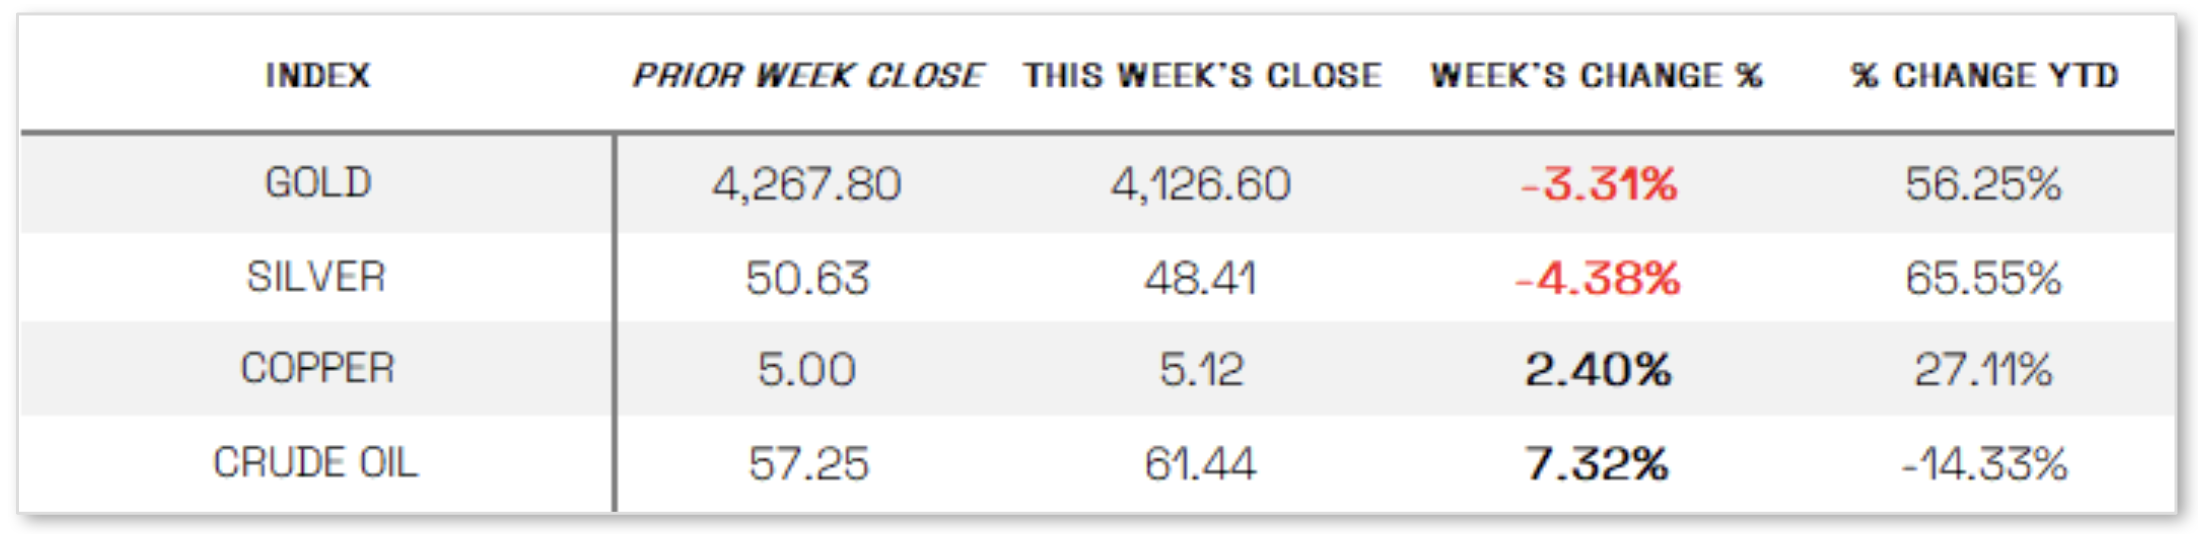
U.S. Commodities/Futures:
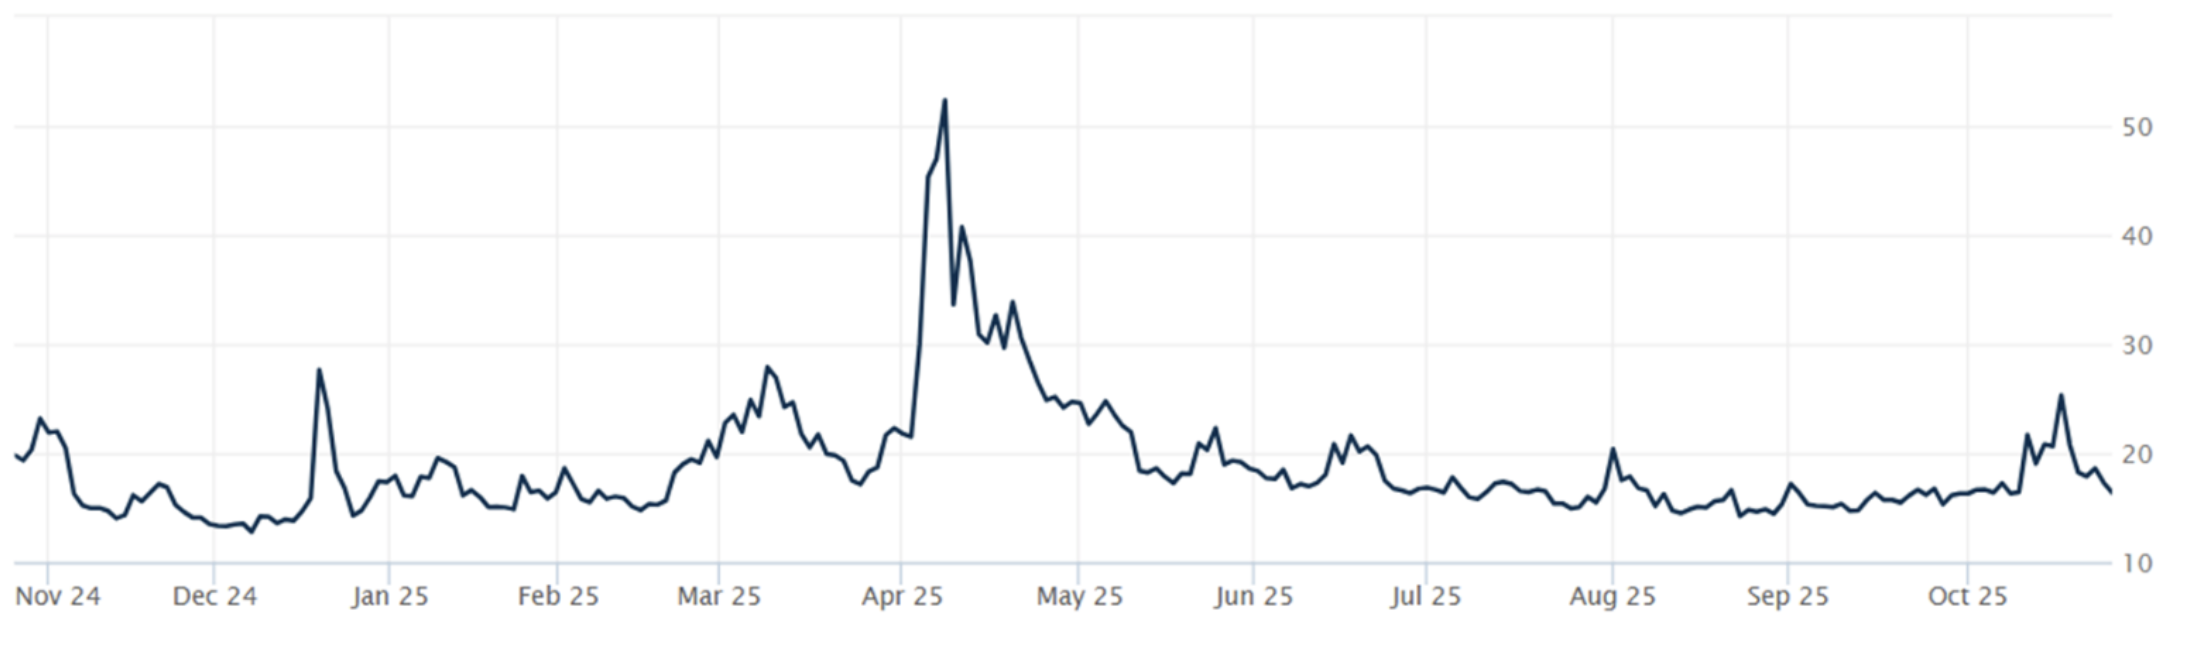
THE VOLATILITY INDEX (VIX) closed at 16.37 this week, a 21.2% decrease vs last week’s close of 20.78.
International Markets:
THIS WEEK’S ECONOMIC NEWS
U.S. Economic News:
Business activity shows growth in October:
Business activity gained momentum in October, according to early readings of the purchasing managers’ indexes (PMIs) from S&P Global, which showed continued expansion across the economy. The composite PMI, encompassing both manufacturing and services, rose to 54.8 from 53.9 in September, marking the 33rd straight month above the 50 threshold that signals growth. The service sector remained the key driver, reaching a three-month high of 55.2, while the manufacturing PMI edged up to 52.2 from 52.0, indicating modest improvement in business conditions. Despite the overall acceleration, manufacturer optimism declined to its second-lowest level since June 2024, reflecting lingering concerns over tariffs and ongoing policy uncertainty.
International Economic News:
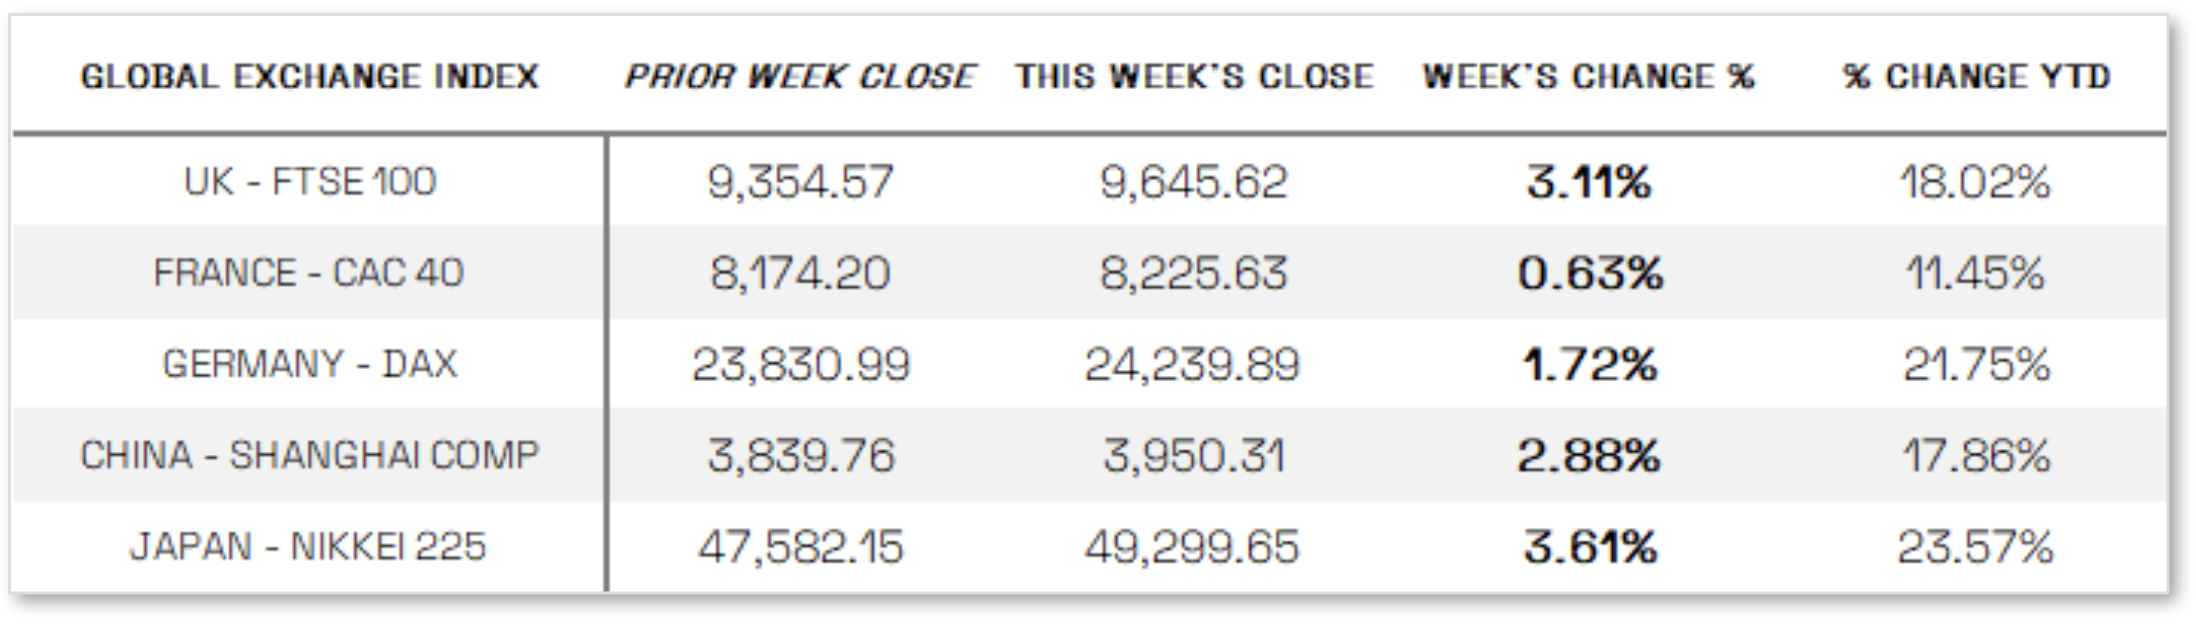
EUROPE: In local currency terms, the pan-European STOXX Europe 600 Index rose 1.68% for the week, with major markets also advancing—Germany’s DAX gained 1.72%, Italy’s FTSE MIB added 1.44%, France’s CAC 40 rose 0.63%, and the UK’s FTSE 100 outperformed with a 3.11% increase. In the UK, headline inflation held steady at 3.8% for a third straight month, defying expectations for a slight rise to 3.9%, while core inflation eased to 3.5% from 3.6% in August. The data led financial markets to sharply increase expectations for an interest rate cut in December. At the same time, UK retail sales surprised to the upside, expanding 0.5% in September for a fourth consecutive month, driven by strong demand from online jewelers amid heightened gold purchases and robust sales in non-store retail as well as computer and telecommunications segments—contrary to economists’ forecasts of a 0.4% decline.
JAPAN: Japan’s stock markets surged over the week, with the Nikkei 225 Index climbing 3.61% and the broader TOPIX Index advancing 3.12%, as investors welcomed the election of the Liberal Democratic Party’s (LDP) Sanae Takaichi as prime minister. Her emphasis on economic growth and proactive fiscal policy boosted optimism for equities. Although the LDP’s coalition with the Japan Innovation Party (JIP) falls slightly short of a majority in both parliamentary houses, the government is expected to maintain stability through support from smaller neutral opposition parties on individual bills. Meanwhile, growing speculation that Takaichi may unveil a large-scale stimulus package soon pressured the yen, which weakened to around JPY 152.9 per U.S. dollar from JPY 150.6 the previous week, as improved risk sentiment reduced demand for safe-haven assets.
CHINA: Mainland Chinese stocks climbed as technology-focused shares led gains despite data underscoring weak domestic demand. The CSI 300 Index rose 3.24% and the Shanghai Composite added 2.88%, while Hong Kong’s Hang Seng Index advanced 3.62%, according to FactSet. China’s economy expanded 4.8% year over year in the third quarter, which the national statistics bureau said provides a “solid foundation” for achieving the government’s roughly 5% annual growth target. However, several indicators pointed to ongoing challenges: retail sales grew just 3.0% year over year in September—the slowest pace since November—while fixed asset investment fell 0.5% in the first nine months of the year. Industrial output, buoyed by strong exports, rose a better-than-expected 6.5% in September. Overall, the data highlighted persistent weakness in domestic demand, as a prolonged property slump and deflation continue to dampen consumer confidence, prompting Beijing to seek ways to spur spending amid rising global trade protectionism.
Sources:
>> All index and returns data from Norgate Data and Commodity Systems Incorporated and Wall Street Journal.
>> News from Reuters, Barron’s, Wall St. Journal, Bloomberg.com, ft.com, guggenheimpartners.com, zerohedge.com, ritholtz.com, markit.com, financialpost.com, Eurostat, Statistics Canada, Yahoo! Finance, stocksandnews.com, marketwatch.com, visualcapitalist.com, wantchinatimes.com, BBC, 361capital.com, pensionpartners.com, cnbc.com, FactSet, Morningstar/Ibbotson Associates, Corporate Finance Institute.
>> Commentary from T Rowe Price Global markets weekly update — https://www.troweprice.com/personal-investing/resources/insights/global-markets-weekly-update.html
Disclosures: This material and any mention of specific investments is provided for informational purposes only and is not intended to be investment advice or a recommendation to take any action. The forecasts or forward-looking statements are based on assumptions, may not materialize, and are subject to revision without notice. The market indexes discussed are unmanaged, and generally, considered representative of their respective markets. Index performance is not indicative of the past performance of a particular investment. Indexes do not incur management fees, costs, and expenses. Individuals cannot directly invest in unmanaged indexes. Past performance does not guarantee future results.
