


THE COMPLETE PICTURE
>> Four indicators across three time frames.
>> When all the Sherman Portfolios indicators are positive status, we read the market as being in a Bull Market.
1. DELTA-V — Positive since June 27, 2025
2. GALACTIC SHIELD — Positive since April 1, 2023
3. STARFLUX — Positive since May 12, 2025
4. STARPATH — Positive since August 15, 2025
The shorter term picture:
>>GALACTIC SHIELD — POSITIVE, This indicator is based on the combination of U.S. and International Equities trend statuses at the start of each quarter.
>> STARFLUX — POSITIVE, Starflux ended the week 6.06 (Up 40.93% last week). This short-term indicator measures U.S. Equities.
>> STARPATH — POSITIVE, This indicator measures the interplay on dual timeframes of our Type 1s + the Russell 3000 + our four most ‘pro-cyclical’ Type 3s, vs. Cash.
The big picture:
The ‘big picture’ is the (typically) years-long timeframe, the same timeframe in which Cyclical Bulls and Bears operate.
>> The Sherman Portfolios DELTA-V Indicator measuring the Bull/Bear cycle finished the week in a Bull status at 71.12, down 0.63% from the prior week’s 71.57. It has signaled Bull since June 27, 2025.
>> The Sherman Portfolios DELTA-V Bond Indicator measuring the Bull/Bear cycle finished the week in BULL status at 68.28, up 6.57% from the prior week’s 64.07. It has signaled Bull since December 15, 2023.
The very big picture (a historical perspective): The CAPE is now at 39.79.
The cyclically adjusted price-to-earnings ratio (CAPE) can be used to smooth out the shorter-term earnings swings to get a longer-term assessment of market valuation. An extremely high CAPE ratio means that a company’s stock price is substantially higher than the company’s earnings would indicate and, therefore, overvalued. It is generally expected that the market will eventually correct the company’s stock price by pushing it down to its true value.
In the past, the CAPE ratio has proved its importance in identifying potential bubbles and market crashes. The historical average of the ratio for the S&P 500 Index is between 15-16, while the highest levels of the ratio have exceeded 30. The record-high levels occurred three times in the history of the U.S. financial markets. The first was in 1929 before the Wall Street crash that signaled the start of the Great Depression. The second was in the late 1990s before the Dotcom Crash, and the third came in 2007 before the 2007-2008 Financial Crisis. https://www.multpl.com/shiller-pe
 Note: We do not use CAPE as an official input into our methods. However, we think history serves as a guide and that it’s good to know where we are on the historic continuum.
THIS WEEK IN THE MARKETS
U.S. Markets:
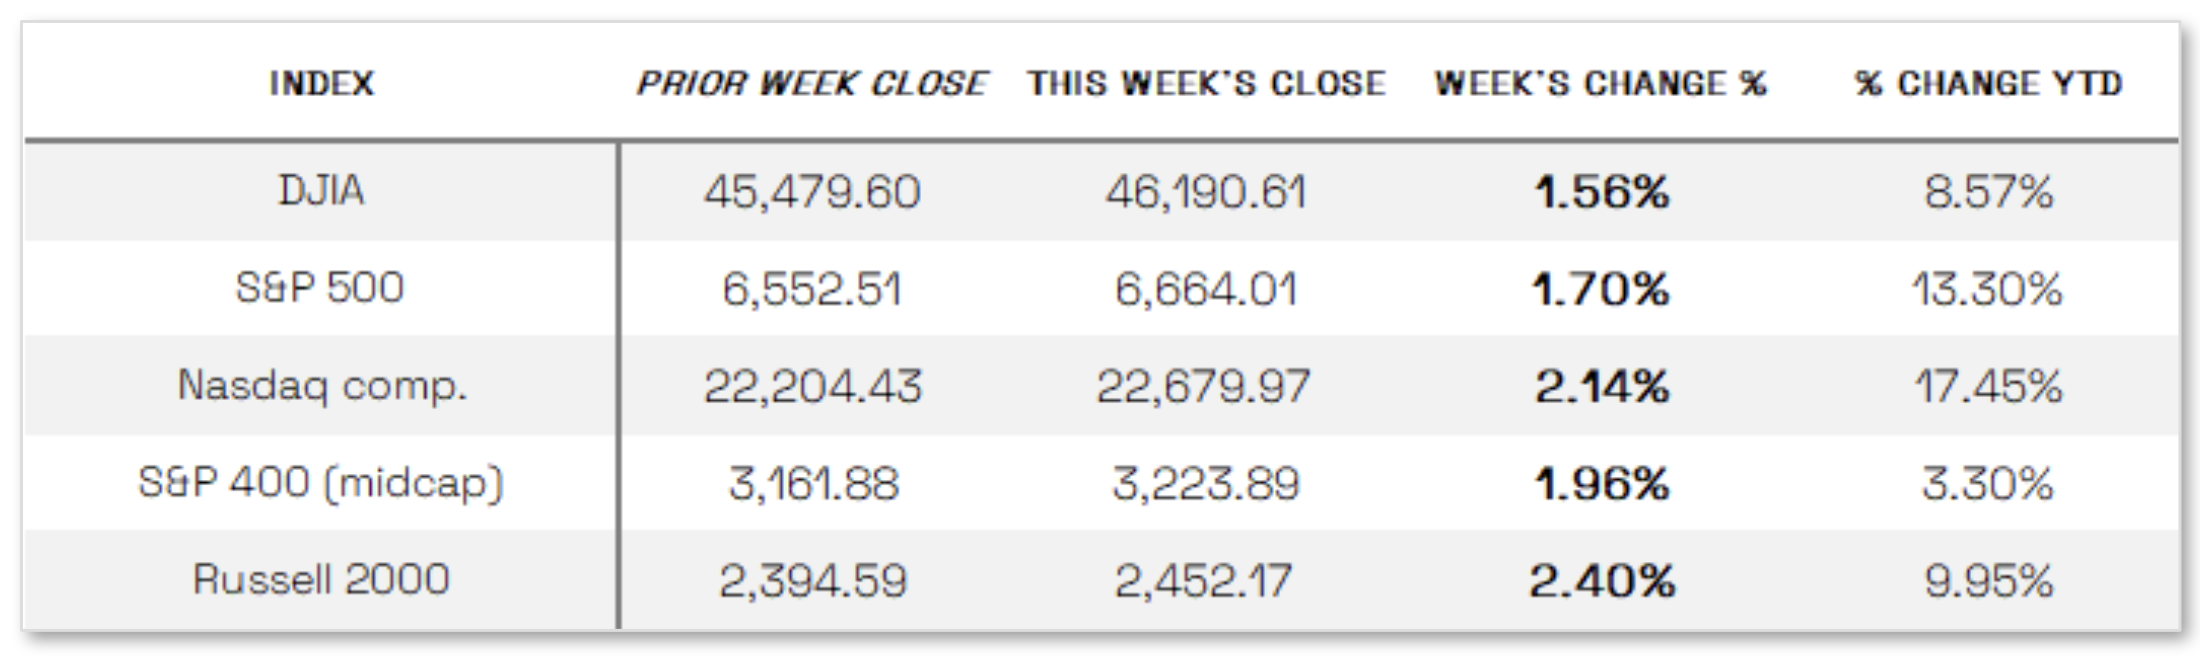
Stock up this week: U.S. stocks ended the week higher after rebounding from the prior Friday’s steep sell-off that had marked the S&P 500’s worst day since April. The week was marked by volatility, beginning positively as U.S. and Chinese officials appeared to ease recent trade tensions, while dovish remarks from Federal Reserve policymakers and several artificial intelligence (AI) deal announcements boosted sentiment. Earnings season also kicked off on Tuesday, with major banks—including JPMorgan Chase, Citigroup, and Wells Fargo—reporting stronger-than-expected third-quarter results; by Friday, about 12% of S&P 500 companies had reported, with 86% surpassing earnings estimates, according to FactSet. However, gains moderated Thursday after two regional banks revealed loan issues linked to alleged fraud, amplifying worries about credit risks and the regional banking sector’s health—especially following recent bankruptcies in the subprime auto lending and auto parts industries. These developments pushed the CBOE Volatility Index to its highest level since April.
Looking at the US Indexes:
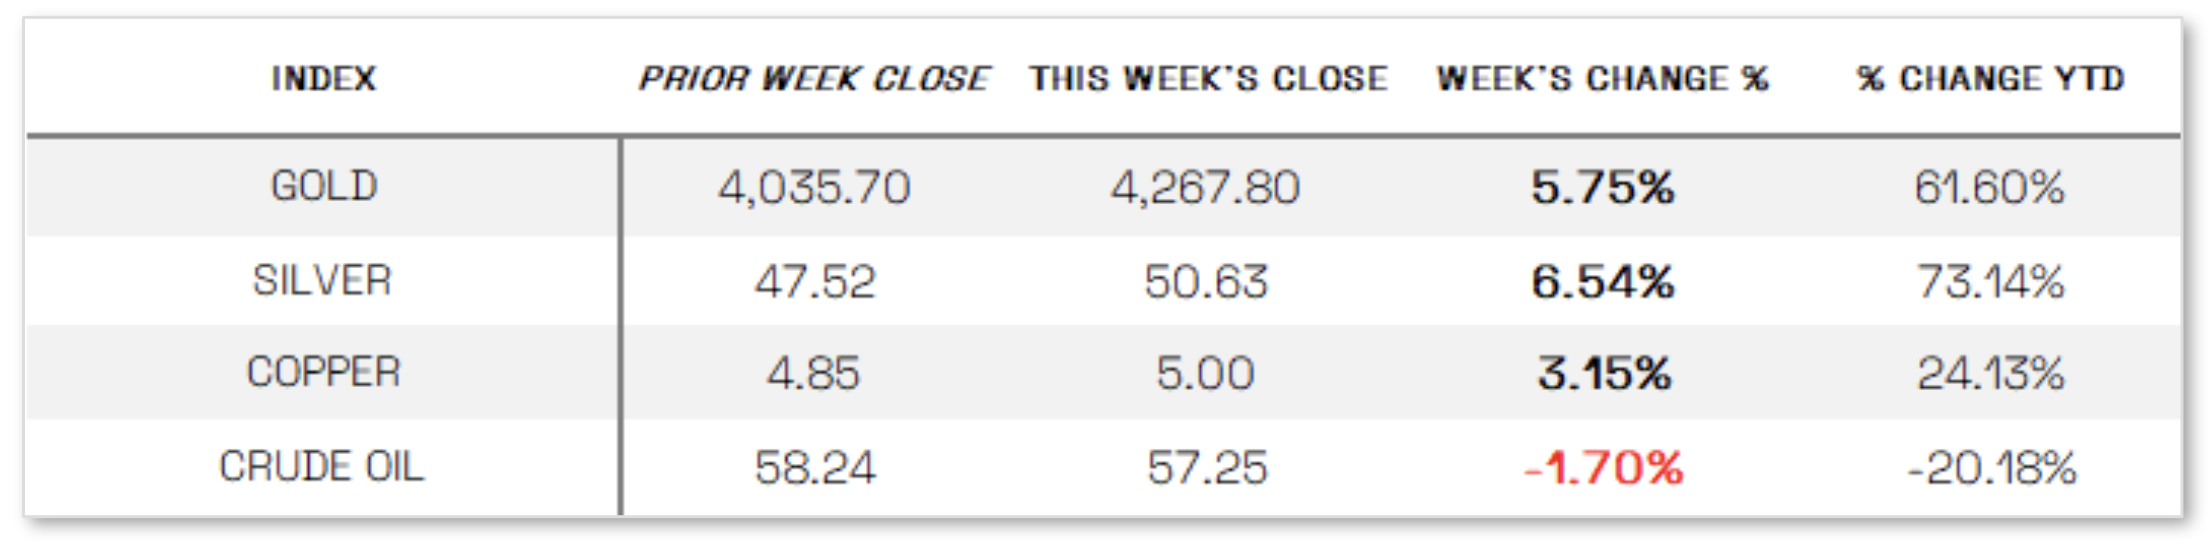
U.S. Commodities/Futures:
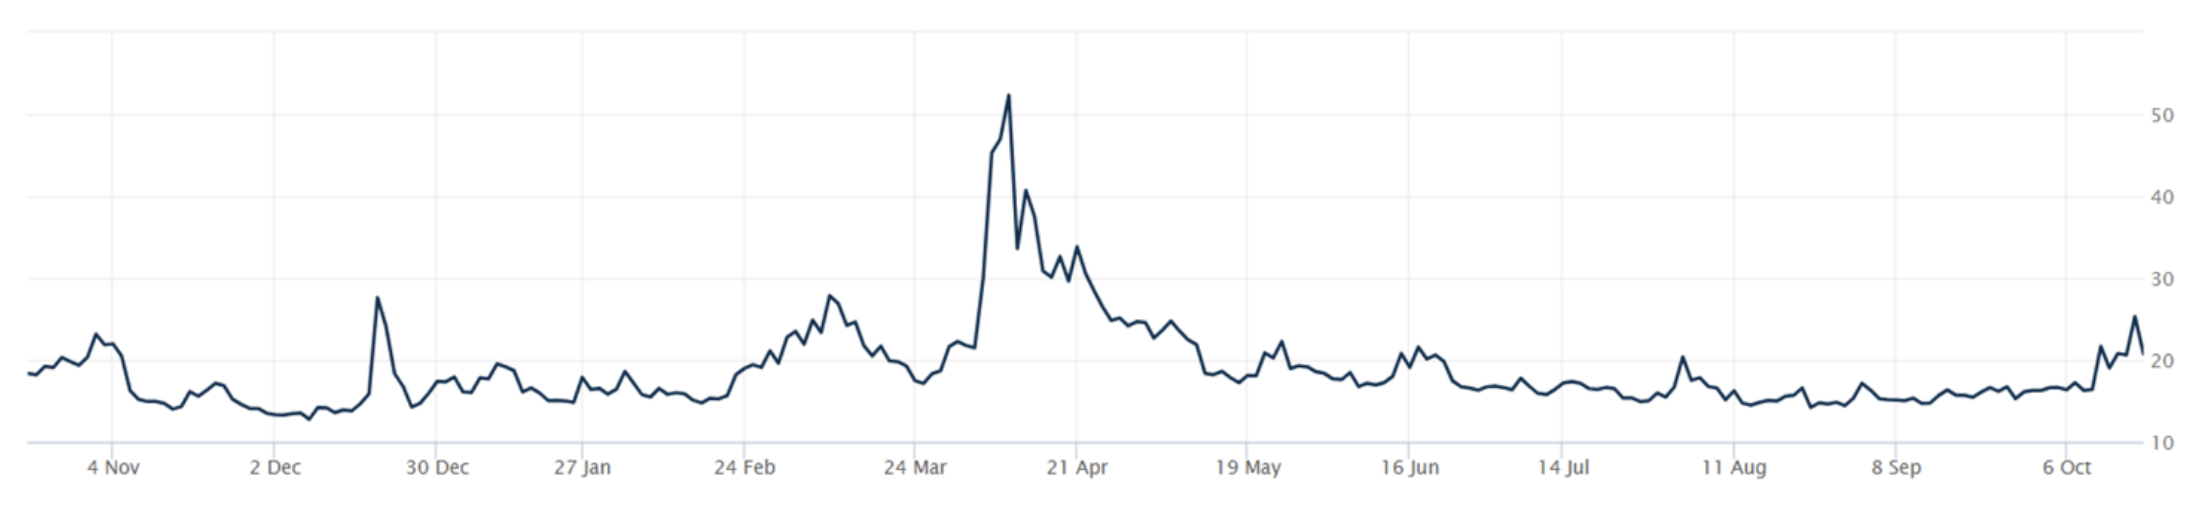
THE VOLATILITY INDEX (VIX) closed at 20.78 this week, a 4.1% decrease vs last week’s close of 21.66.
International Markets:
THIS WEEK’S ECONOMIC NEWS
U.S. Economic News:
Another rate cut possible this year:
Federal Reserve Chair Jerome Powell signaled that the central bank remains on course to cut short-term interest rates again this year amid signs of a weakening labor market. Speaking Tuesday, Powell reiterated remarks from the Fed’s mid-September meeting, emphasizing that growing “downside risks to employment” have shifted the economic outlook, reinforcing investor expectations for further monetary easing despite inflation staying above target. Several other Fed officials, including Christopher Waller and Stephen Miran, also voiced support for additional rate cuts in 2025. Meanwhile, the Fed’s Beige Book, released Wednesday, showed little overall change in economic activity since the previous report, painting a mixed picture across districts: employment levels were steady and wages continued to rise, but consumer spending edged lower, prices climbed further, and more employers reported reducing staff through layoffs and attrition.
International Economic News:
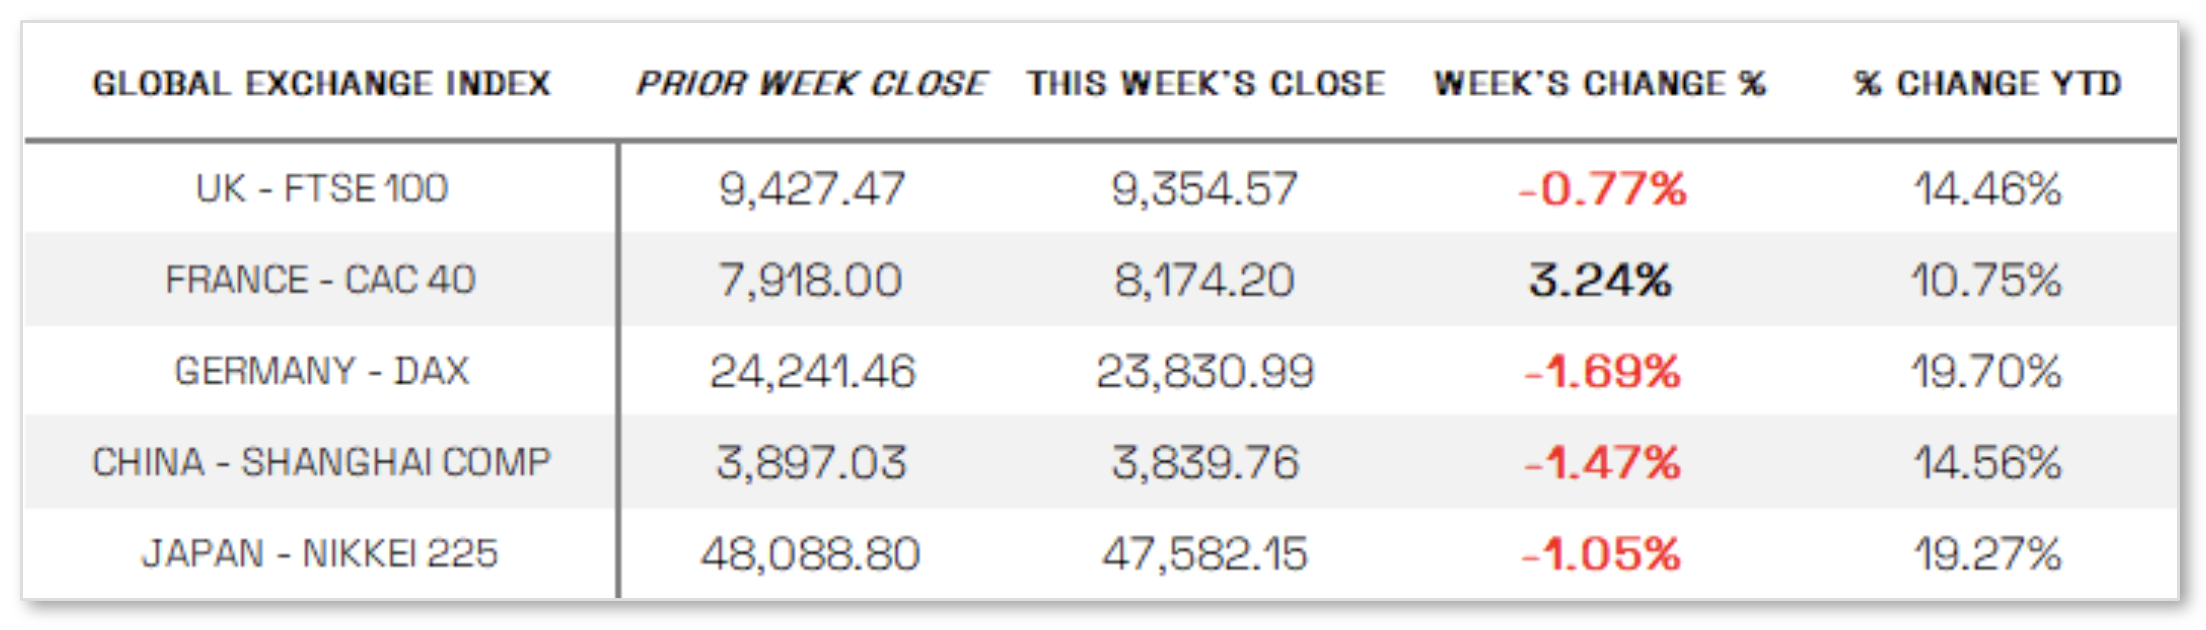
EUROPE: In local currency terms, the pan-European STOXX Europe 600 Index rose 0.37%, supported by dovish remarks from U.S. Federal Reserve Chair Jerome Powell and indications of easing U.S.-China trade tensions, though major national indexes were mixed: France’s CAC 40 jumped 3.24%, Germany’s DAX fell 1.69%, Italy’s FTSE MIB slipped 0.69%, and the UK’s FTSE 100 declined 0.77%. In the UK, the economy showed little momentum as GDP inched up 0.1% in August following a 0.1% contraction in July, while growth over the three months to August reached 0.3%. Industrial and manufacturing output rebounded in August after July’s declines, but the labor market showed signs of softening, with unemployment ticking up to 4.8% from 4.7%. The Office for National Statistics noted hiring declines may be stabilizing, as payrolled employment rose by 10,000 between July and August before falling by the same amount in September. Wage growth excluding bonuses eased slightly to 4.7% year over year from 4.8% in the previous three-month period.
JAPAN: Japan’s stock markets declined over the week, with the Nikkei 225 Index down 1.05% and the broader TOPIX falling 0.85%, as yen strength, political uncertainty, and ongoing U.S.-China trade tensions weighed on sentiment. The yen appreciated to the high end of the JPY 149 range against the U.S. dollar, up from around JPY 151 the previous week, as investors sought safe-haven assets. Domestically, political uncertainty persisted after the Komeito Party exited its coalition with the ruling Liberal Democratic Party (LDP). Markets awaited the outcome of talks between the LDP and Nippon Ishin no Kai (Japan Innovation Party, or JIP), which could result in a new coalition government and pave the way for newly elected LDP President Sanae Takaichi to become Japan’s next prime minister. A vote to select Shigeru Ishiba’s successor was expected to take place on October 21.
CHINA: Mainland Chinese stock markets declined as trade tensions with the U.S. escalated, with the onshore benchmark CSI 300 falling 2.22% and the Shanghai Composite Index slipping 1.47%, according to FactSet, while Hong Kong’s Hang Seng Index tumbled 3.97%. Economically, China reported that factory gate prices dropped 2.3% year over year in September, marking the 36th consecutive month of declines but at a slower pace than August’s 2.9% fall. Consumer prices fell 0.3%, a steeper drop than economists had expected, though the core consumer price index—which excludes food and energy—rose to a 19-month high of 1.0%. The data underscored persistent deflationary pressures weighing on China’s economy, which continues to grapple with weak consumer demand following the pandemic and a prolonged slump in the housing market.
Sources:
>> All index and returns data from Norgate Data and Commodity Systems Incorporated and Wall Street Journal.
>> News from Reuters, Barron’s, Wall St. Journal, Bloomberg.com, ft.com, guggenheimpartners.com, zerohedge.com, ritholtz.com, markit.com, financialpost.com, Eurostat, Statistics Canada, Yahoo! Finance, stocksandnews.com, marketwatch.com, visualcapitalist.com, wantchinatimes.com, BBC, 361capital.com, pensionpartners.com, cnbc.com, FactSet, Morningstar/Ibbotson Associates, Corporate Finance Institute.
>> Commentary from T Rowe Price Global markets weekly update — https://www.troweprice.com/personal-investing/resources/insights/global-markets-weekly-update.html
Disclosures: This material and any mention of specific investments is provided for informational purposes only and is not intended to be investment advice or a recommendation to take any action. The forecasts or forward-looking statements are based on assumptions, may not materialize, and are subject to revision without notice. The market indexes discussed are unmanaged, and generally, considered representative of their respective markets. Index performance is not indicative of the past performance of a particular investment. Indexes do not incur management fees, costs, and expenses. Individuals cannot directly invest in unmanaged indexes. Past performance does not guarantee future results.
