


THE COMPLETE PICTURE
>> Four indicators across three time frames.
>> When all the Sherman Portfolios indicators are positive status, we read the market as being in a Bull Market.
1. DELTA-V — Positive since June 27, 2025
2. GALACTIC SHIELD — Positive since April 1, 2023
3. STARFLUX — Positive since May 12, 2025
4. STARPATH — Positive since August 15, 2025
The shorter term picture:
>> GALACTIC SHIELD — POSITIVE, This indicator is based on the combination of U.S. and International Equities trend statuses at the start of each quarter.
>> STARFLUX — POSITIVE, Starflux ended the week 4.30 (Down 40.11% last week). This short-term indicator measures U.S. Equities.
>> STARPATH — POSITIVE, This indicator measures the interplay on dual timeframes of our Type 1s + the Russell 3000 + our four most ‘pro-cyclical’ Type 3s, vs. Cash.
The big picture:
The ‘big picture’ is the (typically) years-long timeframe, the same timeframe in which Cyclical Bulls and Bears operate.
>> The Sherman Portfolios DELTA-V Indicator measuring the Bull/Bear cycle finished the week in a Bull status at 71.57, down 4.10% from the prior week’s 74.63. It has signaled Bull since June 27, 2025.
>> The Sherman Portfolios DELTA-V Bond Indicator measuring the Bull/Bear cycle finished the week in BULL status at 64.07, down 2.03% from the prior week’s 65.40. It has signaled Bull since December 15, 2023.
The very big picture (a historical perspective): The CAPE is now at 39.09.
The cyclically adjusted price-to-earnings ratio (CAPE) can be used to smooth out the shorter-term earnings swings to get a longer-term assessment of market valuation. An extremely high CAPE ratio means that a company’s stock price is substantially higher than the company’s earnings would indicate and, therefore, overvalued. It is generally expected that the market will eventually correct the company’s stock price by pushing it down to its true value.
In the past, the CAPE ratio has proved its importance in identifying potential bubbles and market crashes. The historical average of the ratio for the S&P 500 Index is between 15-16, while the highest levels of the ratio have exceeded 30. The record-high levels occurred three times in the history of the U.S. financial markets. The first was in 1929 before the Wall Street crash that signaled the start of the Great Depression. The second was in the late 1990s before the Dotcom Crash, and the third came in 2007 before the 2007-2008 Financial Crisis. https://www.multpl.com/shiller-pe
 Note: We do not use CAPE as an official input into our methods. However, we think history serves as a guide and that it’s good to know where we are on the historic continuum.
THIS WEEK IN THE MARKETS
U.S. Markets:
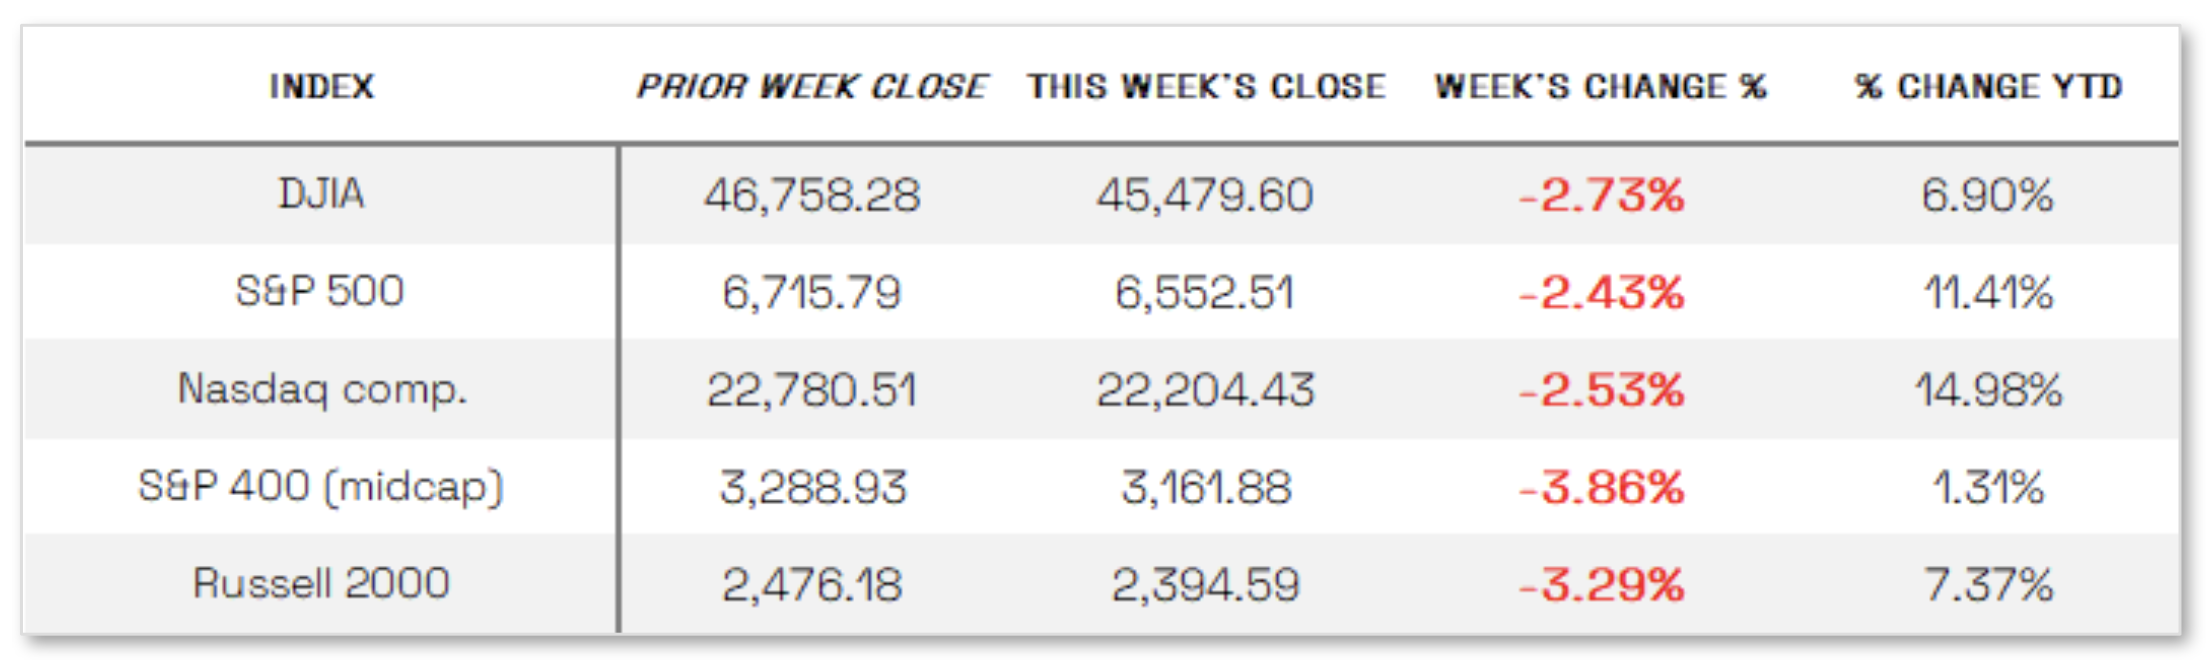
Stocks down over trade tensions: U.S. stock indexes declined for the week as fears of renewed global trade tensions and concerns over the prolonged U.S. government shutdown weighed on sentiment. Although the Nasdaq Composite and S&P 500 Index spent much of the week in positive territory—buoyed by enthusiasm for artificial intelligence–related companies and news of a strategic partnership between Advanced Micro Devices and OpenAI that lifted AMD shares over 20% on Monday—markets turned sharply lower on Friday after President Donald Trump announced on social media that he was considering “a massive increase of tariffs on Chinese products” in response to China’s proposed new export controls on rare earths. Gold prices extended their record-breaking rally, surpassing USD 4,000 per ounce for the first time, reflecting heightened geopolitical and economic uncertainty. Investors were also looking ahead to the third-quarter earnings season, set to begin with JPMorgan Chase’s report on October 14, and noted that with the government shutdown limiting key economic data releases, corporate earnings could have an outsized influence on market sentiment; analysts polled by FactSet expect the S&P 500 to post its ninth straight quarter of year-over-year earnings growth.
Looking at the US Indexes:
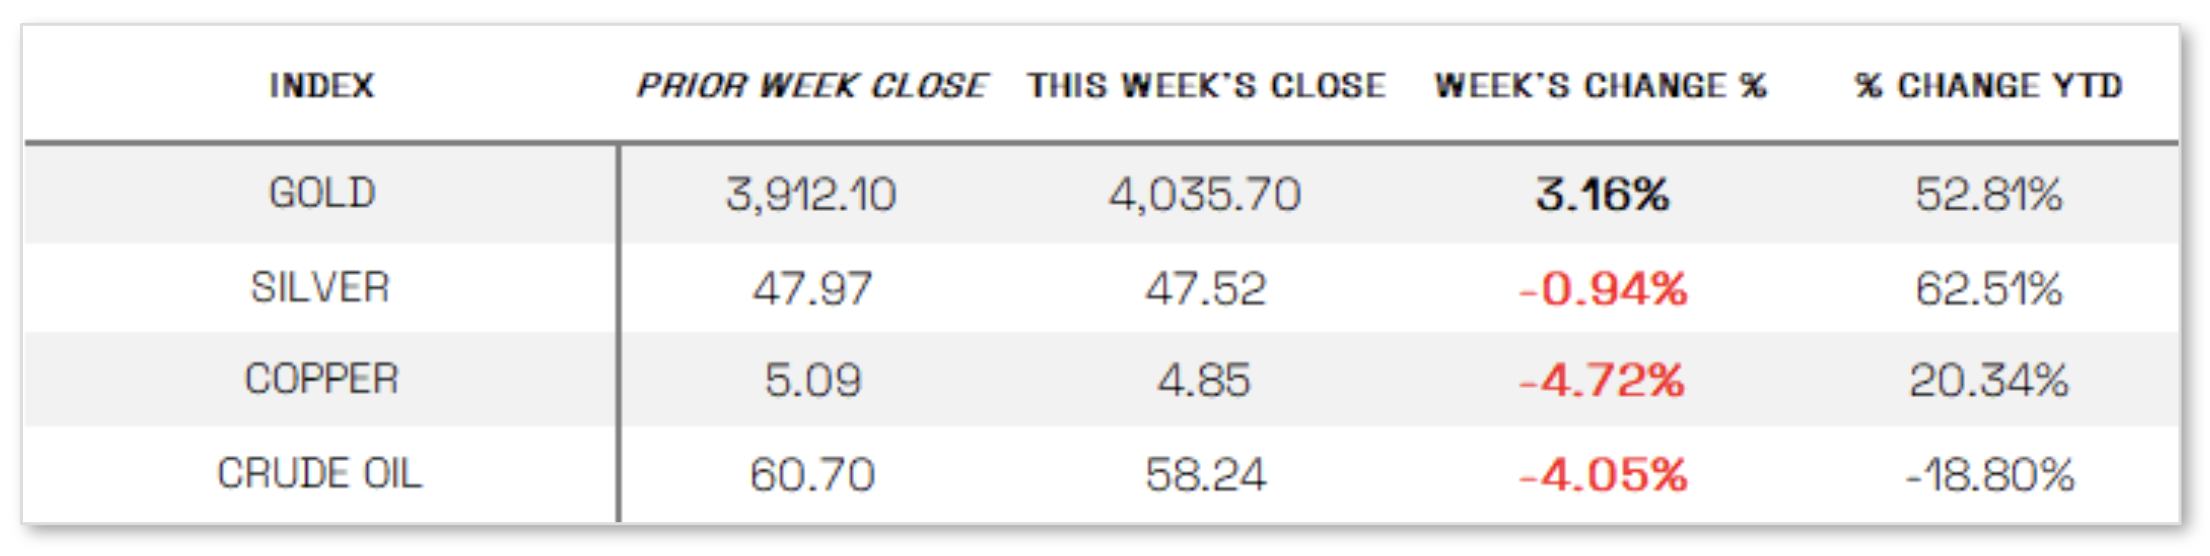
U.S. Commodities/Futures:
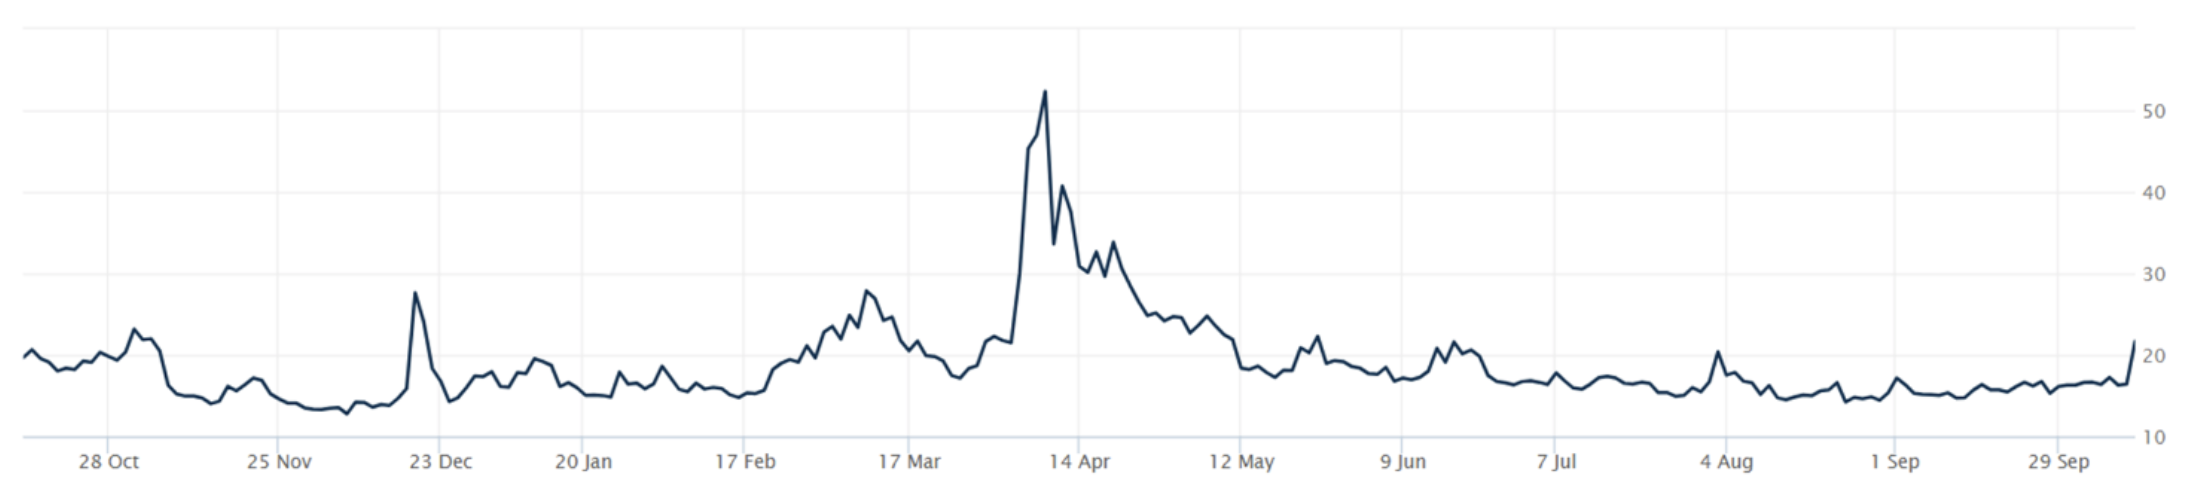
THE VOLATILITY INDEX (VIX) closed at 21.66 this week, a 30.1% increase vs last week’s close of 16.65.
International Markets:
THIS WEEK’S ECONOMIC NEWS
U.S. Economic News:
Fed cautious about rate cuts:
With few major economic data releases due to the ongoing U.S. government shutdown, investor focus shifted to the minutes from the Federal Reserve’s mid-September policy meeting, which revealed cautious support for further rate cuts. The minutes showed divisions among policymakers as they weighed conflicting signals, expressing concern about both persistently high inflation and a weakening labor market, noting that “upside risks to inflation remained elevated and downside risks to employment were elevated and had increased.” Most officials agreed that it would likely be appropriate to ease policy further before year-end, though some argued that current monetary policy might not be especially restrictive, warranting a cautious approach to additional changes. Separately, the University of Michigan’s preliminary October Index of Consumer Sentiment held steady at 55, as improved views on current personal finances and near-term business conditions were offset by weaker expectations for future finances and durable goods purchases. Inflation expectations for the year ahead edged down to 4.6% from 4.7%, while long-term expectations remained unchanged at 3.7%.
International Economic News:
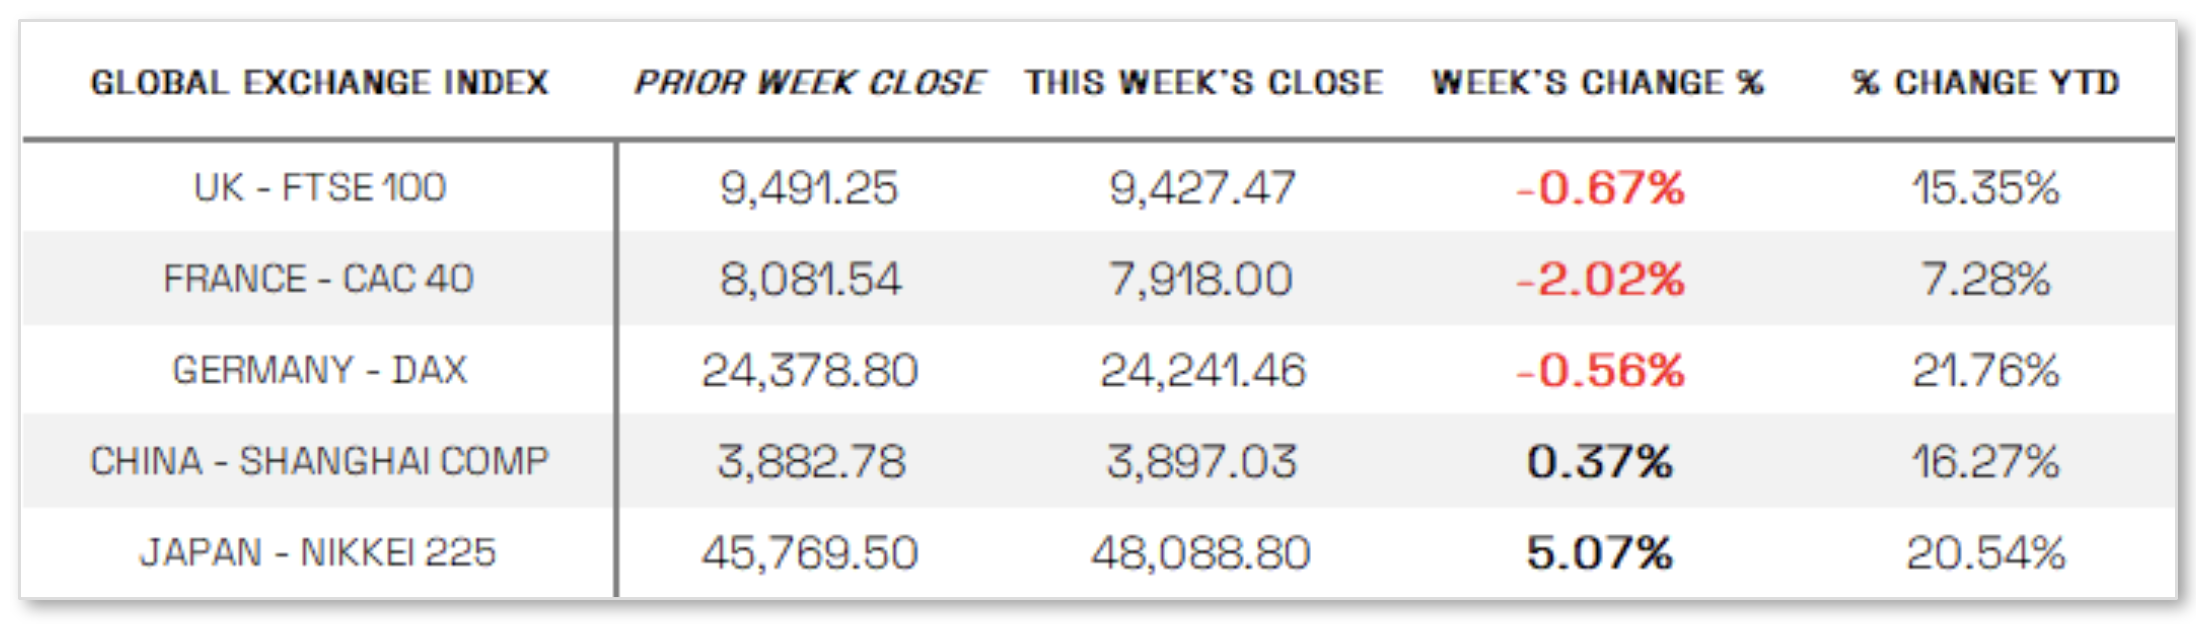
EUROPE: In local currency terms, the pan-European STOXX Europe 600 Index fell 1.10% for the week, as investors took profits after record highs and sentiment weakened due to political turmoil in France and escalating global trade tensions. Major national indexes also declined, with Germany’s DAX down 0.56%, France’s CAC 40 dropping 2.02%, Italy’s FTSE MIB sliding 2.80%, and the UK’s FTSE 100 easing 0.67%. In Germany, fresh data pointed to deepening economic weakness as the effects of front-loading activity ahead of a U.S. tariff deadline in April faded. Industrial output plunged 4.3% in August—far more than expected—driven largely by a steep drop in auto production, alongside declines in machinery, pharmaceuticals, and electronic equipment. Exports also unexpectedly fell 0.5% from July, with shipments to the U.S.—Germany’s largest trade partner in 2024—down 2.5% month over month and 20.1% year over year on a calendar- and seasonally adjusted basis. In response, the coalition government announced a package of measures aimed at reducing budget costs and supporting the auto sector, including tighter welfare restrictions and subsidies for the purchase of German-made electric vehicles.
JAPAN: Japan’s stock markets surged over the week, with the Nikkei 225 Index climbing 5.07% and the broader TOPIX Index advancing 2.19%, as investors welcomed Sanae Takaichi’s victory in the Liberal Democratic Party’s presidential election, positioning her to likely become Japan’s next prime minister. The result was seen as supportive for equities amid expectations of expansionary fiscal measures and continued loose monetary policy. Reflecting these expectations, the yen weakened sharply, depreciating to around JPY 152.8 per U.S. dollar from roughly JPY 147.5 at the end of the prior week.
CHINA: Mainland Chinese stock markets ended a holiday-shortened week mixed, with the onshore benchmark CSI 300 Index falling 0.51% and the Shanghai Composite Index rising 0.37% over the two-day trading week ended Friday. Trading resumed on October 9 after an eight-day National Day and Mid-Autumn Festival break, while in Hong Kong, the Hang Seng Index declined 3.13%, according to FactSet. Preliminary data indicated that consumer activity during China’s Golden Week lagged behind the five-day Labor Day holiday in May, with sales at select retailers and restaurants rising 3.3% in the first half of the week—roughly half the earlier pace—according to Bloomberg, citing government data. The Ministry of Transport estimated average passenger traffic rose 6.2% year over year, compared with an 8% increase during Labor Day. The weaker consumption figures, typically a key indicator of domestic demand during the holiday, came as Beijing continues efforts to rebalance the economy toward consumption and services and away from exports and heavy industry. Looking ahead, investors are focused on China’s upcoming fourth plenum, a key political meeting scheduled for October 20–23, where Communist Party officials are expected to review and approve proposals for the next five-year plan outlining the nation’s economic and social priorities.
Sources:
>> All index and returns data from Norgate Data and Commodity Systems Incorporated and Wall Street Journal.
>> News from Reuters, Barron’s, Wall St. Journal, Bloomberg.com, ft.com, guggenheimpartners.com, zerohedge.com, ritholtz.com, markit.com, financialpost.com, Eurostat, Statistics Canada, Yahoo! Finance, stocksandnews.com, marketwatch.com, visualcapitalist.com, wantchinatimes.com, BBC, 361capital.com, pensionpartners.com, cnbc.com, FactSet, Morningstar/Ibbotson Associates, Corporate Finance Institute.
>> Commentary from T Rowe Price Global markets weekly update — https://www.troweprice.com/personal-investing/resources/insights/global-markets-weekly-update.html
Disclosures: This material and any mention of specific investments is provided for informational purposes only and is not intended to be investment advice or a recommendation to take any action. The forecasts or forward-looking statements are based on assumptions, may not materialize, and are subject to revision without notice. The market indexes discussed are unmanaged, and generally, considered representative of their respective markets. Index performance is not indicative of the past performance of a particular investment. Indexes do not incur management fees, costs, and expenses. Individuals cannot directly invest in unmanaged indexes. Past performance does not guarantee future results.
