


THE COMPLETE PICTURE
>> Four indicators across three time frames.
>> When all the Sherman Portfolios indicators are positive status, we read the market as being in a Bull Market.
1. DELTA-V — Positive since June 27, 2025
2. GALACTIC SHIELD — Positive since April 1, 2023
3. STARFLUX — Positive since May 12, 2025
4. STARPATH — Positive since August 15, 2025
The shorter term picture:
>> GALACTIC SHIELD — POSITIVE, for Q4 2025, This indicator is based on the combination of U.S. and International Equities trend statuses at the start of each quarter.
>> STARFLUX — POSITIVE, Starflux ended the week at 7.18 (Down 0.28% last week) This short-term indicator measures U.S. Equities.
>> STARPATH — POSITIVE, This indicator measures the interplay on dual timeframes of our Type 1s + the Russell 3000 + our four most ‘pro-cyclical’ Type 3s, vs. Cash.
The big picture:
The ‘big picture’ is the (typically) years-long timeframe, the same timeframe in which Cyclical Bulls and Bears operate.
>> The Sherman Portfolios DELTA-V Indicator measuring the Bull/Bear cycle finished the week in a Bull status at 74.63, up 1.91% from the prior week’s 73.23. It has signaled Bull since June 27, 2025.
>> The Sherman Portfolios DELTA-V Bond Indicator measuring the Bull/Bear cycle finished the week in BULL status at 65.40, up 1.36% from the prior week’s 64.52. It has signaled Bull since December 15, 2023.
The very big picture (a historical perspective): The CAPE is now at 40.08.
The cyclically adjusted price-to-earnings ratio (CAPE) can be used to smooth out the shorter-term earnings swings to get a longer-term assessment of market valuation. An extremely high CAPE ratio means that a company’s stock price is substantially higher than the company’s earnings would indicate and, therefore, overvalued. It is generally expected that the market will eventually correct the company’s stock price by pushing it down to its true value.
In the past, the CAPE ratio has proved its importance in identifying potential bubbles and market crashes. The historical average of the ratio for the S&P 500 Index is between 15-16, while the highest levels of the ratio have exceeded 30. The record-high levels occurred three times in the history of the U.S. financial markets. The first was in 1929 before the Wall Street crash that signaled the start of the Great Depression. The second was in the late 1990s before the Dotcom Crash, and the third came in 2007 before the 2007-2008 Financial Crisis. https://www.multpl.com/shiller-pe
 Note: We do not use CAPE as an official input into our methods. However, we think history serves as a guide and that it’s good to know where we are on the historic continuum.
THIS WEEK IN THE MARKETS
U.S. Markets:
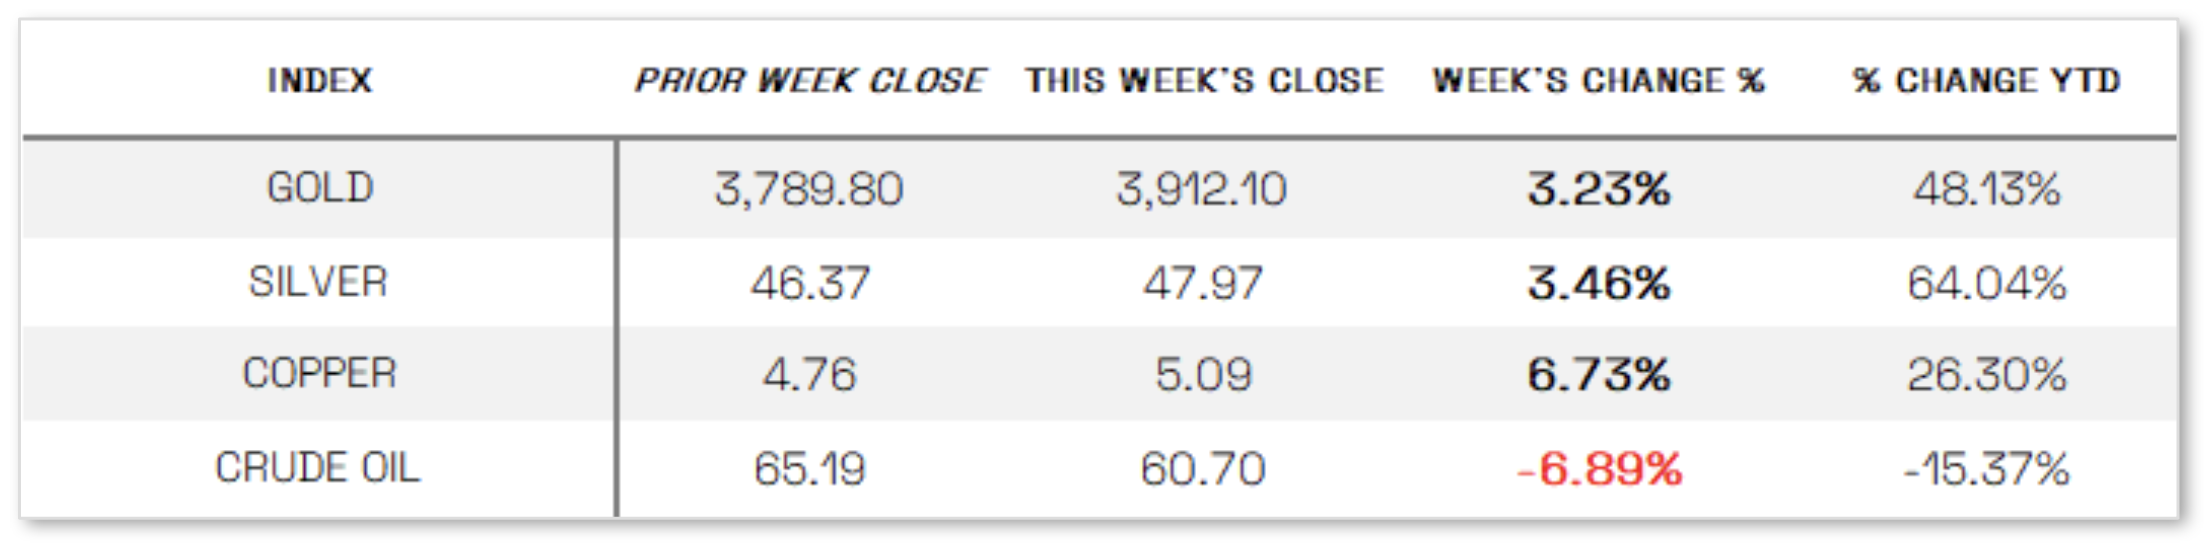
Stocks up despite government shutdown: Stocks posted solid gains despite the U.S. government shutdown that began Thursday after lawmakers failed to reach a funding deal to keep nonessential operations open. In a “bad news is good news” environment, equities found support from ADP’s September private payrolls report showing job losses, which investors interpreted as increasing the likelihood of a Federal Reserve rate cut in October. The technology-heavy Nasdaq Composite led the advance, with growth stocks outperforming value, while the small-cap Russell 2000 Index, typically more sensitive to lower rates, outpaced the broader S&P 500. In commodities, West Texas Intermediate crude oil fell more than 7% after OPEC+ signaled plans to raise production in November, weighing on value stocks, while gold climbed over 3% and copper surged more than 6%, reflecting strength in industrial demand.
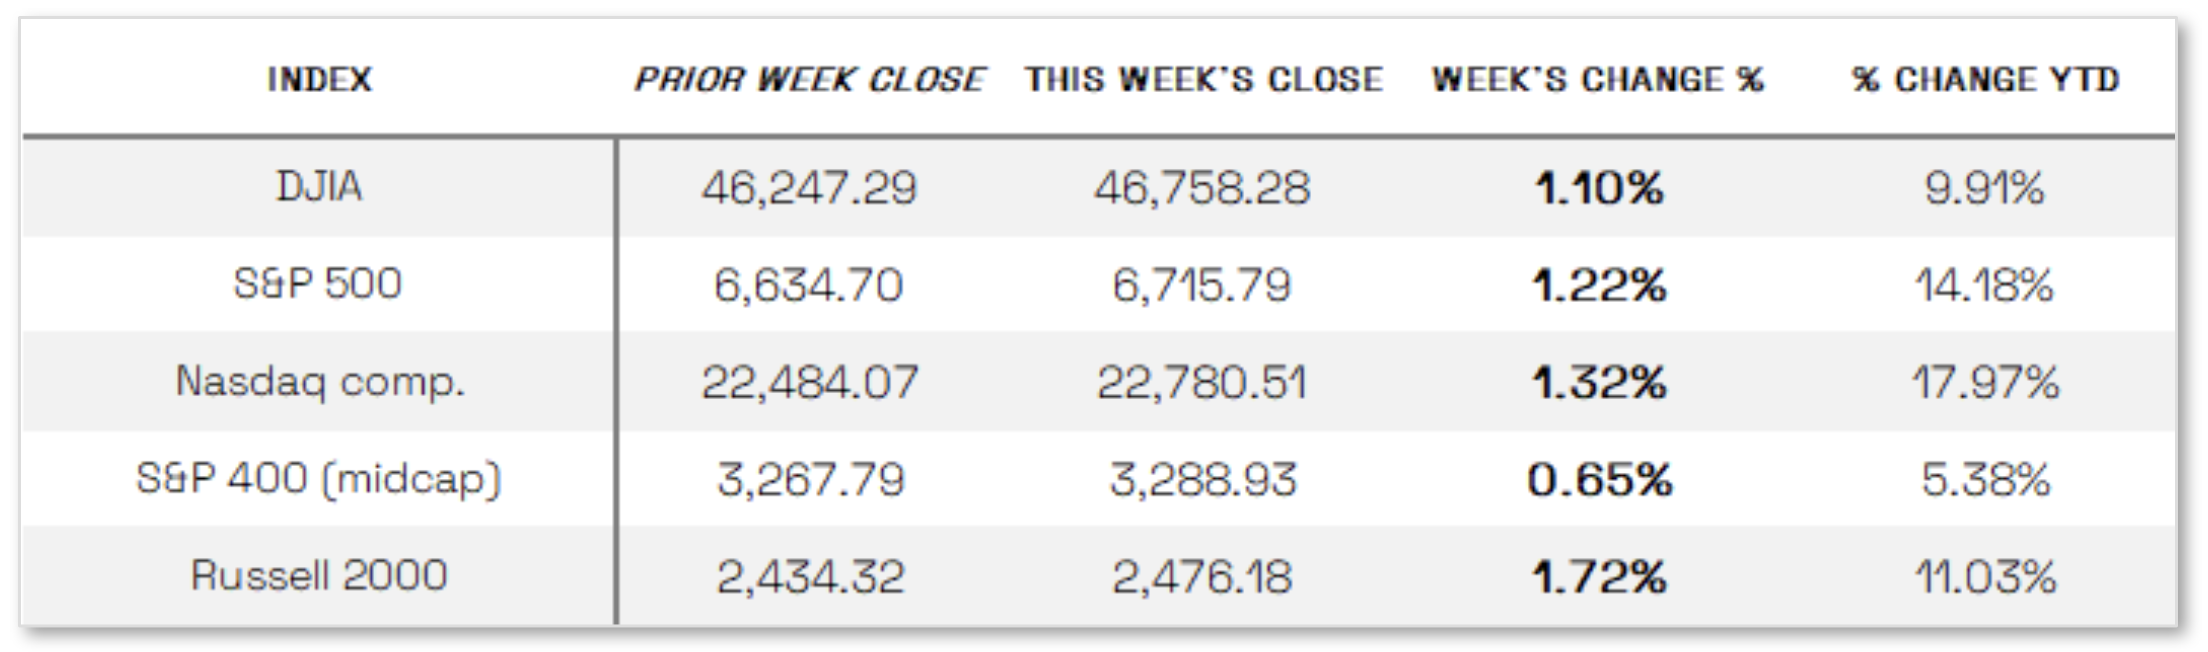
Looking at the US Indexes:
U.S. Commodities/Futures:
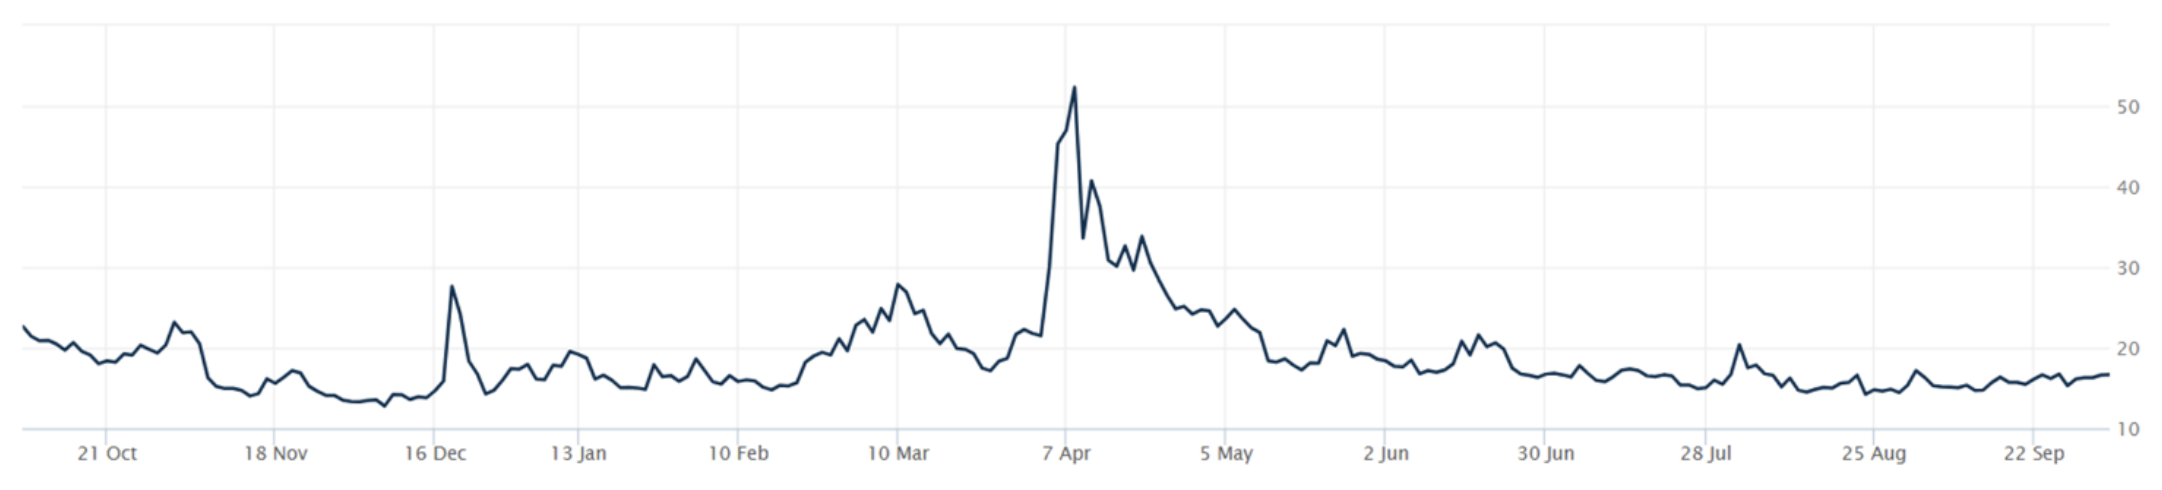
THE VOLATILITY INDEX (VIX) closed at 16.65 this week, an 8.9% increase vs last week’s close of 15.29.
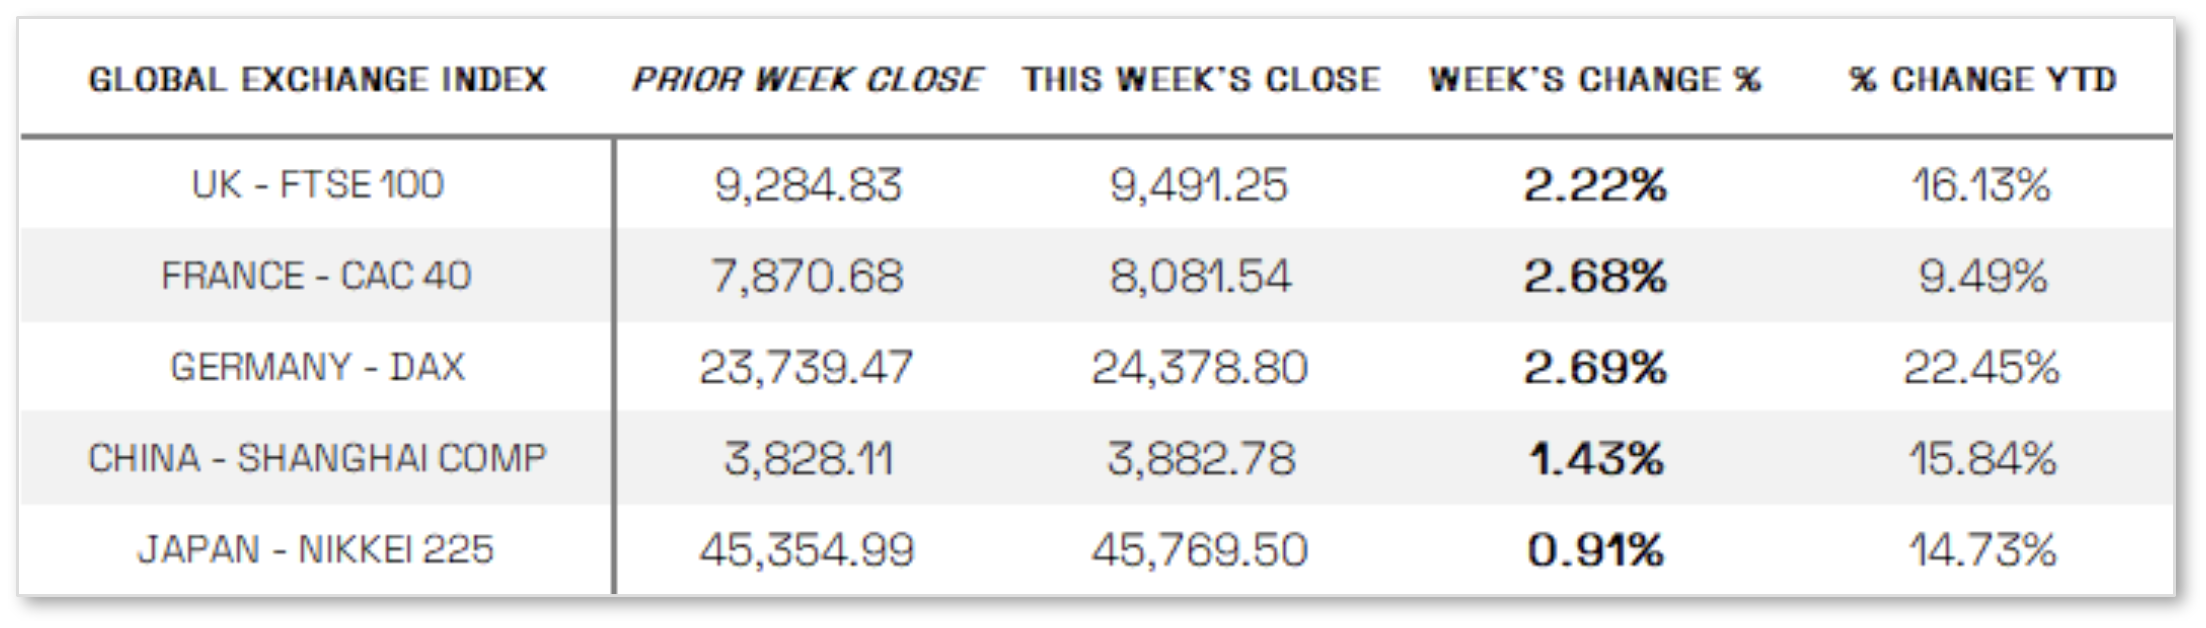
International Markets:
THIS WEEK’S ECONOMIC NEWS
U.S. Economic News:
Government data delayed:
With the U.S. government shutdown halting the release of key economic data, investors turned their attention to alternative labor indicators after the Bureau of Labor Statistics’ September nonfarm payrolls report was postponed. The shutdown, which has furloughed about 750,000 federal workers according to the Congressional Budget Office, also threatens to delay other key reports such as the September consumer price index (CPI) due October 15—potentially clouding the outlook ahead of the Federal Reserve’s late-October policy meeting. In the absence of official data, markets focused on ADP’s September report showing a loss of 32,000 jobs versus expectations for a 51,000 gain, reinforcing expectations for upcoming Fed rate cuts. However, Fed officials maintained a somewhat hawkish tone, with Chicago Fed President Austan Goolsbee warning that a CPI delay would be “problematic” amid persistent services inflation, while Dallas Fed President Lorie Logan said she favored a slower pace of policy normalization.
International Economic News:
EUROPE: In local currency terms, the pan-European STOXX Europe 600 Index rose 2.87% to record highs, lifted by a rally in technology stocks and optimism that U.S. borrowing costs may decline this month. Major European indexes also advanced, with Germany’s DAX gaining 2.69%, France’s CAC 40 up 2.68%, Italy’s FTSE MIB rising 1.43%, and the UK’s FTSE 100 adding 2.22%. Eurozone inflation accelerated to 2.2% in September from 2.0% in August, driven by higher services costs and a slower decline in energy prices, while core inflation held steady at 2.3%. European Central Bank President Christine Lagarde said at a Bank of Finland conference that inflation risks appeared “quite contained” and that with policy rates at 2%, the ECB was well positioned to respond to any shifts or new shocks. Meanwhile, the eurozone unemployment rate edged up to 6.3% in August from July’s record low of 6.2%, though consumer confidence improved to -14.9 from -15.5, signaling stronger intentions for major purchases in the year ahead.
JAPAN: Japan’s stock markets delivered mixed results for the week, with the Nikkei 225 Index rising 0.91% while the broader TOPIX Index fell 1.82%, as technology shares advanced on optimism surrounding artificial intelligence investments. Despite lingering uncertainty over the outcome of the ruling Liberal Democratic Party’s presidential election scheduled for October 4, the yen strengthened to around JPY 147.3 per U.S. dollar from roughly JPY 149.5 the previous week, supported by a weaker greenback following the U.S. government shutdown.
CHINA: Mainland Chinese stock markets rose during a holiday-shortened week, with the CSI 300 and Shanghai Composite Index both advancing through Tuesday, September 30, before closing from October 1 to 8 for the National Day and Mid-Autumn Festival holiday. In Hong Kong, where markets were closed Wednesday for National Day, the Hang Seng Index gained 3.88%, according to FactSet. The eight-day Golden Week holiday typically drives a surge in consumer spending as millions travel, shop, and dine out—activity expected to lift domestic consumption-related stocks such as liquor makers and airlines. Analysts closely watch Golden Week sales data as a barometer of consumer strength and progress in China’s economic rebalancing toward services and consumption. On the economic front, China’s official manufacturing Purchasing Managers’ Index (PMI) improved to 49.8 in September from 49.4 in August, while the nonmanufacturing PMI slipped to 50 from 50.3. Although manufacturing activity slightly outperformed expectations, both readings suggested continued economic softness into the third quarter after robust growth in the first half of the year.
Sources:
>> All index and returns data from Norgate Data and Commodity Systems Incorporated and Wall Street Journal.
>> News from Reuters, Barron’s, Wall St. Journal, Bloomberg.com, ft.com, guggenheimpartners.com, zerohedge.com, ritholtz.com, markit.com, financialpost.com, Eurostat, Statistics Canada, Yahoo! Finance, stocksandnews.com, marketwatch.com, visualcapitalist.com, wantchinatimes.com, BBC, 361capital.com, pensionpartners.com, cnbc.com, FactSet, Morningstar/Ibbotson Associates, Corporate Finance Institute.
>> Commentary from T Rowe Price Global markets weekly update — https://www.troweprice.com/personal-investing/resources/insights/global-markets-weekly-update.html
Disclosures: This material and any mention of specific investments is provided for informational purposes only and is not intended to be investment advice or a recommendation to take any action. The forecasts or forward-looking statements are based on assumptions, may not materialize, and are subject to revision without notice. The market indexes discussed are unmanaged, and generally, considered representative of their respective markets. Index performance is not indicative of the past performance of a particular investment. Indexes do not incur management fees, costs, and expenses. Individuals cannot directly invest in unmanaged indexes. Past performance does not guarantee future results.
