


THE COMPLETE PICTURE
>> Four indicators across three time frames.
>> When all the Sherman Portfolios indicators are positive status, we read the market as being in a Bull Market.
1. DELTA-V — Positive since June 27, 2025
2. GALACTIC SHIELD — Positive since April 1, 2023
3. STARFLUX — Positive since May 12, 2025
4. STARPATH — Positive since August 15, 2025
The shorter term picture:
>> GALACTIC SHIELD — POSITIVE, for Q3 2025, This indicator is based on the combination of U.S. and International Equities trend statuses at the start of each quarter.
>> STARFLUX — POSITIVE, Starflux ended the week at 7.20 (Down 9.32% last week) This short-term indicator measures U.S. Equities.
>> STARPATH — POSITIVE, This indicator measures the interplay on dual timeframes of our Type 1s + the Russell 3000 + our four most ‘pro-cyclical’ Type 3s, vs. Cash.
The big picture:
The ‘big picture’ is the (typically) years-long timeframe, the same timeframe in which Cyclical Bulls and Bears operate.
>> The Sherman Portfolios DELTA-V Indicator measuring the Bull/Bear cycle finished the week in a Bull status at 73.23, up 0.69% from the prior week’s 72.73. It has signaled Bull since June 27, 2025.
>> The Sherman Portfolios DELTA-V Bond Indicator measuring the Bull/Bear cycle finished the week in BULL status at 64.52, down 3.0% from the prior week’s 66.50. It has signaled Bull since December 15, 2023.
The very big picture (a historical perspective): The CAPE is now at 39.84.
The cyclically adjusted price-to-earnings ratio (CAPE) can be used to smooth out the shorter-term earnings swings to get a longer-term assessment of market valuation. An extremely high CAPE ratio means that a company’s stock price is substantially higher than the company’s earnings would indicate and, therefore, overvalued. It is generally expected that the market will eventually correct the company’s stock price by pushing it down to its true value.
In the past, the CAPE ratio has proved its importance in identifying potential bubbles and market crashes. The historical average of the ratio for the S&P 500 Index is between 15-16, while the highest levels of the ratio have exceeded 30. The record-high levels occurred three times in the history of the U.S. financial markets. The first was in 1929 before the Wall Street crash that signaled the start of the Great Depression. The second was in the late 1990s before the Dotcom Crash, and the third came in 2007 before the 2007-2008 Financial Crisis. https://www.multpl.com/shiller-pe
 Note: We do not use CAPE as an official input into our methods. However, we think history serves as a guide and that it’s good to know where we are on the historic continuum.
THIS WEEK IN THE MARKETS
U.S. Markets:
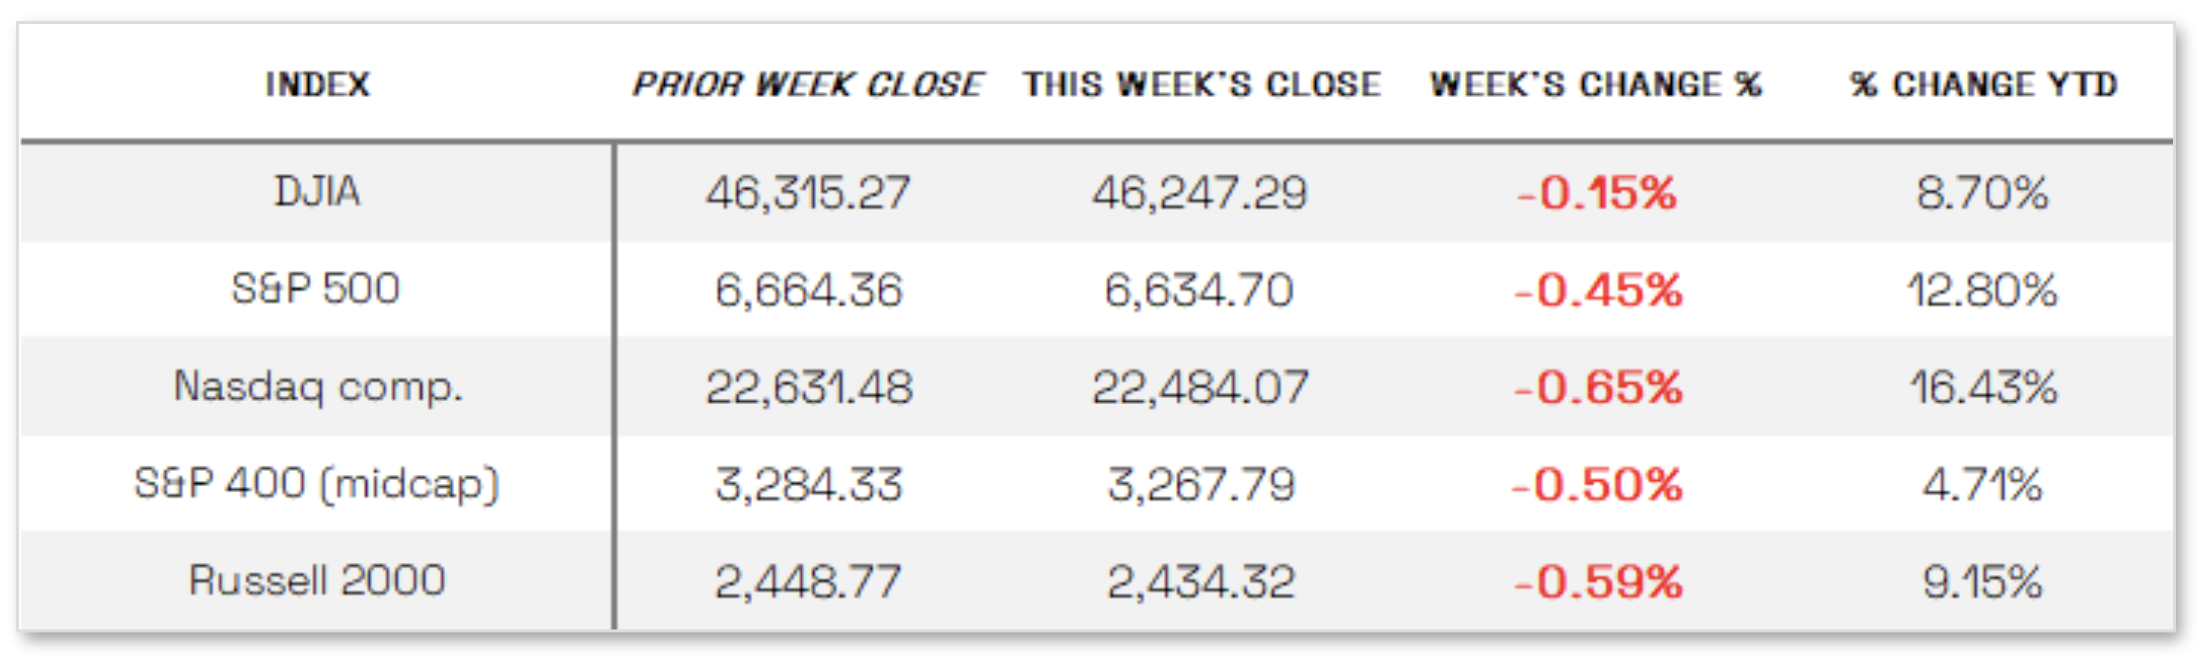
Stocks down after consumer sentiment concerns: Major U.S. stock indexes ended the week lower as cautious commentary from Federal Reserve officials weighed on investor sentiment, tempering optimism about the pace of future interest rate cuts. The Nasdaq Composite led declines with a 0.65% drop, followed by the Russell 2000 Index, which posted its first weekly loss since early August, while the S&P MidCap 400 and S&P 500 also fell and the Dow Jones Industrial Average was little changed. Within the S&P 500, the energy sector advanced alongside rising oil prices after President Donald Trump urged European Union nations to halt purchases of Russian oil and gas, but most other sectors declined. Contributing to the pullback, Fed Chair Jerome Powell warned of a “challenging situation” marked by inflation risks, labor market pressures, and “fairly highly valued” equities, while officials including St. Louis Fed President Alberto Musalem and Atlanta Fed President Raphael Bostic echoed concerns about persistent inflation and cautioned against additional monetary easing.
Looking at the US Indexes:
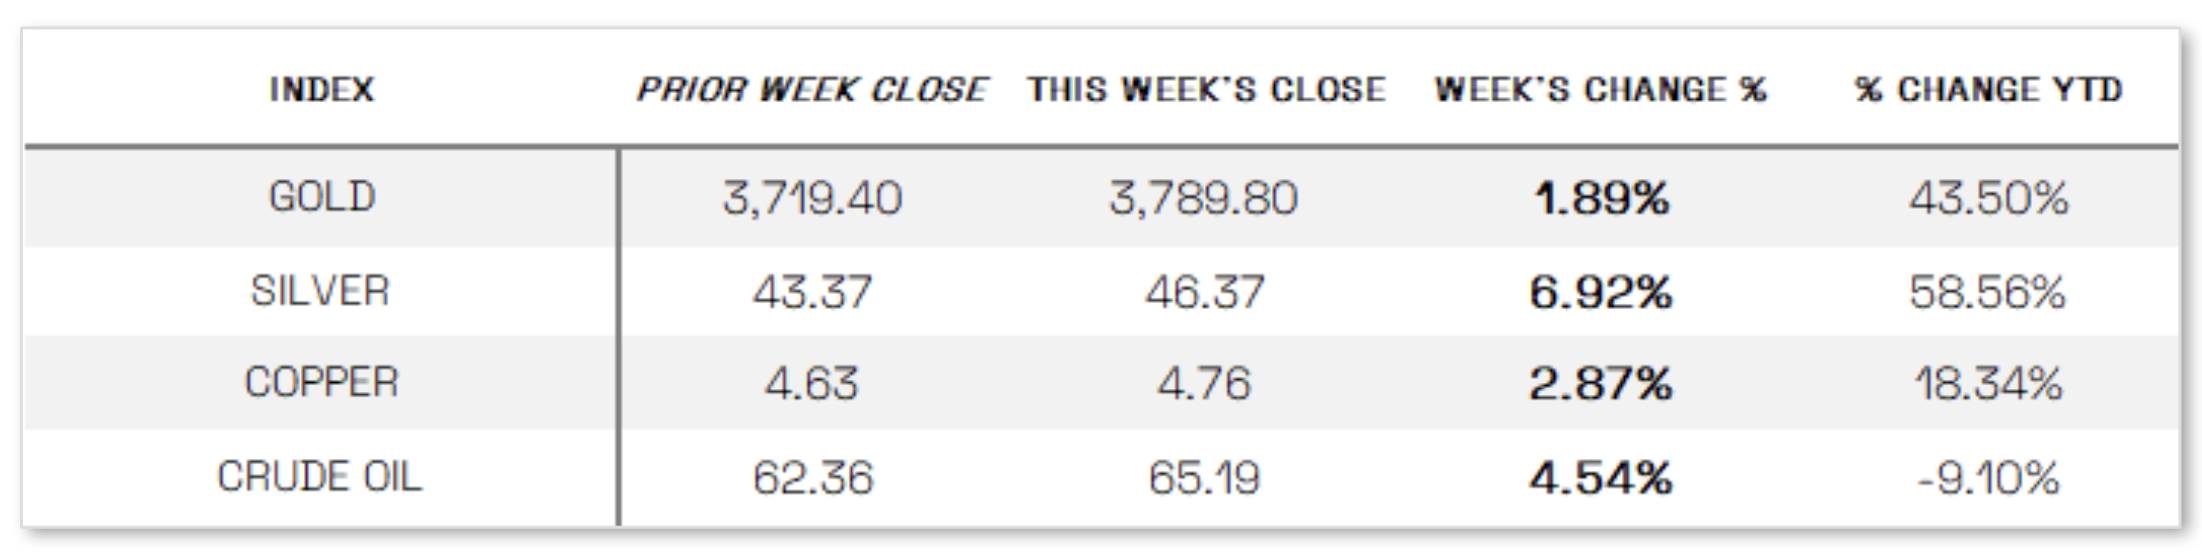
U.S. Commodities/Futures:
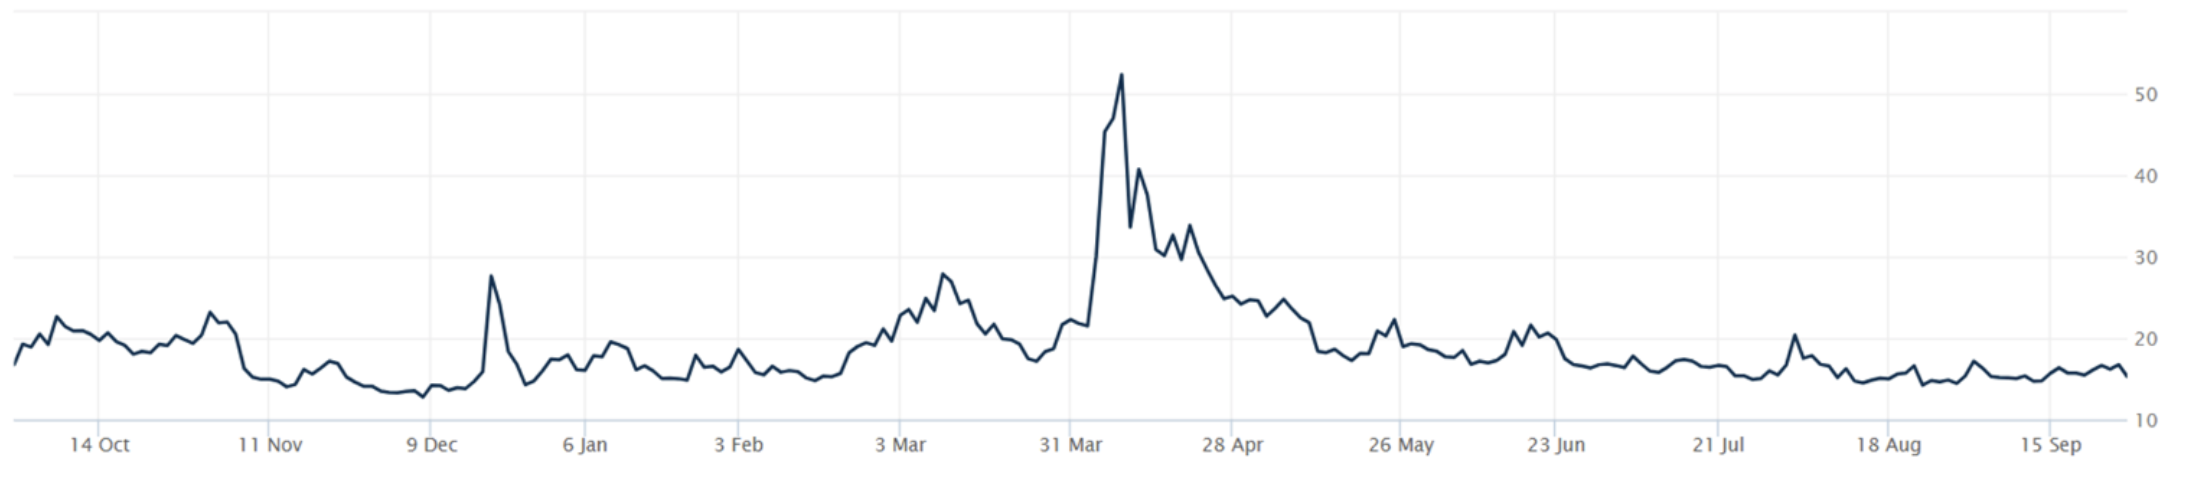
THE VOLATILITY INDEX (VIX) closed at 15.29 this week, a 1.0% decrease vs last week’s close of 15.45.
International Markets:
THIS WEEK’S ECONOMIC NEWS
U.S. Economic News:
Inflation shows little change:
Inflation was little changed in August as the core personal consumption expenditures (PCE) price index, the Federal Reserve’s preferred measure, rose 0.2% from July and 2.9% year over year, both in line with expectations, while personal spending and income increased slightly more than forecast at 0.6% and 0.4%, respectively. The Bureau of Economic Analysis also revised second-quarter GDP growth upward to an annualized 3.8% from 3.3%, citing stronger consumer spending as the main driver. Meanwhile, S&P Global’s September Flash PMI data showed moderating but still positive business activity, with manufacturing at 52.0 and services at 53.9, pointing to a 2.2% annualized growth rate in the third quarter, according to Chief Business Economist Chris Williamson. In housing, new single-family home sales surged more than 20% to an annual rate of 800,000 in August, the highest since January 2022 and well above forecasts, while existing home sales were little changed at 4 million, with the median price climbing 2% from a year earlier to $422,600, marking the 26th straight month of annual gains.
International Economic News:
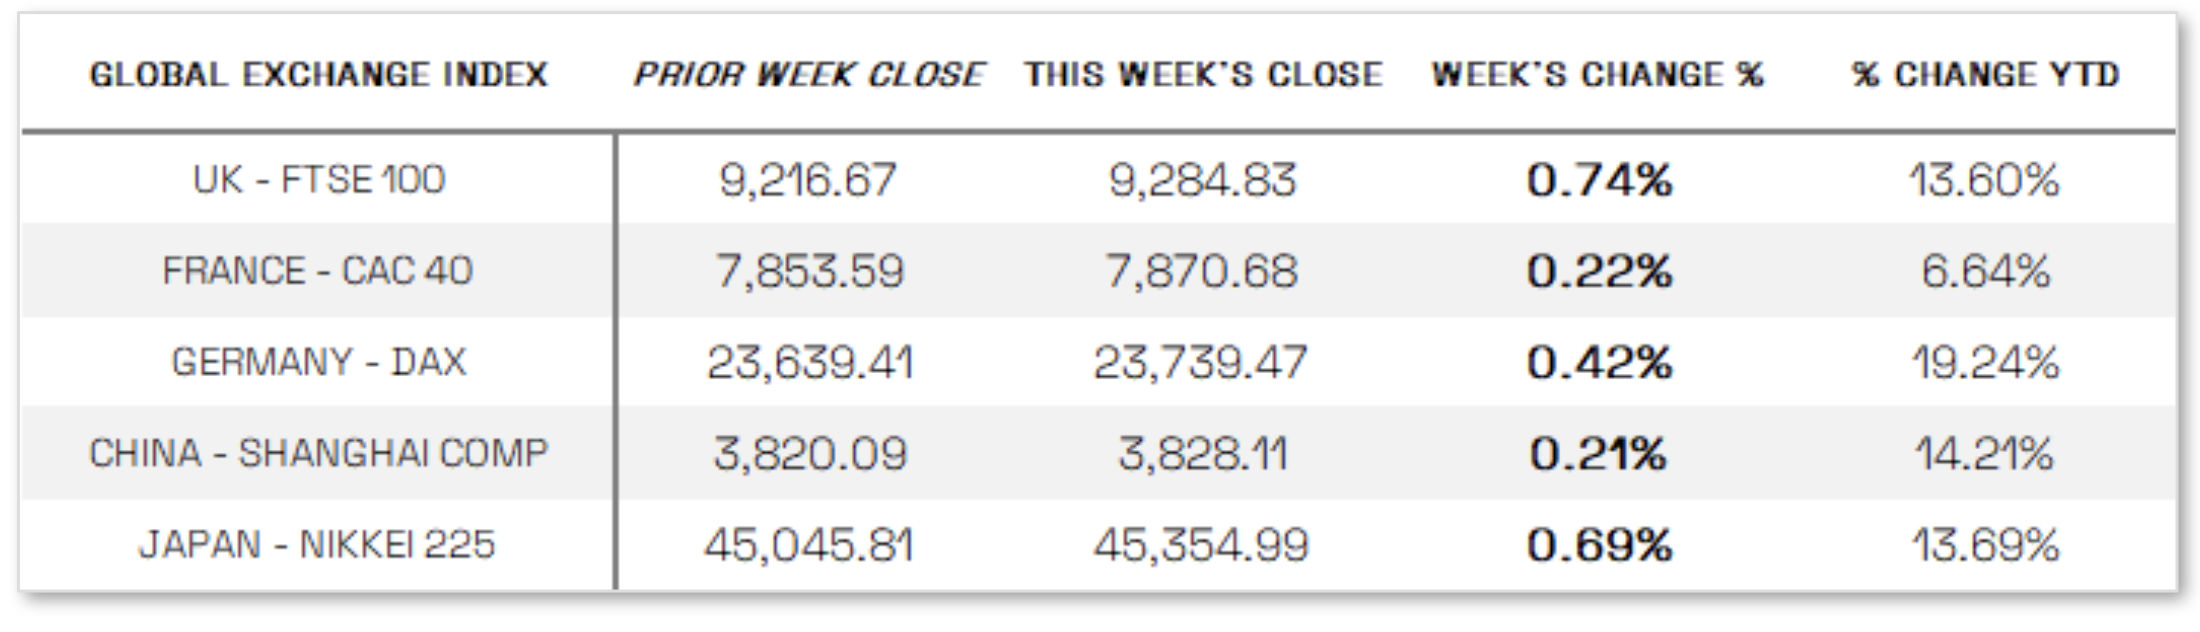
EUROPE: In local currency terms, the pan-European STOXX Europe 600 Index finished little changed as investors weighed interest rate policies and renewed trade concerns, though major national indexes advanced, with Italy’s FTSE MIB up 0.79%, Germany’s DAX rising 0.42%, France’s CAC 40 adding 0.22%, and the UK’s FTSE 100 gaining 0.74%. Economic data showed the eurozone maintained modest growth in the third quarter, as the HCOB Flash Eurozone Composite PMI Output Index climbed to a 16-month high of 51.2 in September from 51.0 in August, driven by stronger services activity despite slowing manufacturing. While companies were generally optimistic about future output, weaker manufacturing confidence pulled overall business sentiment to a four-month low. In contrast, UK business activity slowed sharply, with the PMI dropping to 51.0 from August’s 12-month high of 53.5, as services and manufacturing both softened, the latter hit by auto industry disruptions, while business confidence slid to its lowest since June ahead of the November budget.
JAPAN: Japan’s stock markets advanced over the week, with the Nikkei 225 up 0.69% and the TOPIX rising 1.25%, as expectations of a near-term Bank of Japan rate hike were moderated by weaker-than-expected Tokyo area inflation, while pharmaceutical stocks lagged following new U.S. tariff announcements targeting the sector. The 10-year Japanese government bond yield edged up to 1.64% from 1.62%, remaining near 17-year highs, and the yen weakened to around JPY 149.7 per U.S. dollar from JPY 147.9 amid political uncertainty surrounding the Liberal Democratic Party’s presidential election and broad-based U.S. dollar strength driven by solid U.S. economic data that dampened expectations for deeper Federal Reserve rate cuts.
CHINA: Mainland Chinese stock markets ended the week higher, with the CSI 300 Index rising 1.07% and the Shanghai Composite Index up 0.21% in local currency terms, while Hong Kong’s Hang Seng Index fell 1.57%, according to FactSet. With no major economic indicators or corporate earnings released, trading was largely driven by ample domestic liquidity, as cash-rich households sought better returns amid low interest rates and limited alternatives. Investor sentiment was further supported by breakthroughs in local artificial intelligence startups and Beijing’s “anti-involution” campaign to curb excessive price competition, offsetting concerns over slowing growth and persistent deflation.
Sources:
>> All index and returns data from Norgate Data and Commodity Systems Incorporated and Wall Street Journal.
>> News from Reuters, Barron’s, Wall St. Journal, Bloomberg.com, ft.com, guggenheimpartners.com, zerohedge.com, ritholtz.com, markit.com, financialpost.com, Eurostat, Statistics Canada, Yahoo! Finance, stocksandnews.com, marketwatch.com, visualcapitalist.com, wantchinatimes.com, BBC, 361capital.com, pensionpartners.com, cnbc.com, FactSet, Morningstar/Ibbotson Associates, Corporate Finance Institute.
>> Commentary from T Rowe Price Global markets weekly update — https://www.troweprice.com/personal-investing/resources/insights/global-markets-weekly-update.html
Disclosures: This material and any mention of specific investments is provided for informational purposes only and is not intended to be investment advice or a recommendation to take any action. The forecasts or forward-looking statements are based on assumptions, may not materialize, and are subject to revision without notice. The market indexes discussed are unmanaged, and generally, considered representative of their respective markets. Index performance is not indicative of the past performance of a particular investment. Indexes do not incur management fees, costs, and expenses. Individuals cannot directly invest in unmanaged indexes. Past performance does not guarantee future results.
