


THE COMPLETE PICTURE
>> Four indicators across three time frames.
>> When all the Sherman Portfolios indicators are positive status, we read the market as being in a Bull Market.
1. DELTA-V — Positive since June 27, 2025
2. GALACTIC SHIELD — Positive since April 1, 2023
3. STARFLUX — Positive since May 12, 2025
4. STARPATH — Positive since August 15, 2025
The shorter term picture:
>> GALACTIC SHIELD — POSITIVE, for Q3 2025, This indicator is based on the combination of U.S. and International Equities trend statuses at the start of each quarter.
>> STARFLUX — POSITIVE, Positive, Starflux ended the week at 7.94 (Down 0.25% last week) This short-term indicator measures U.S. Equities.
>> STARPATH — POSITIVE, This indicator measures the interplay on dual timeframes of our Type 1s + the Russell 3000 + our four most ‘pro-cyclical’ Type 3s, vs. Cash.
The big picture:
The ‘big picture’ is the (typically) years-long timeframe, the same timeframe in which Cyclical Bulls and Bears operate.
>> The Sherman Portfolios DELTA-V Indicator measuring the Bull/Bear cycle finished the week in a Bull status at 72.73, up 2.91% from the prior week’s 70.67. It has signaled Bull since June 27, 2025.
>> The Sherman Portfolios DELTA-V Bond Indicator measuring the Bull/Bear cycle finished the week in BULL status at 66.50, up 0.20% from the prior week’s 66.37. It has signaled Bull since December 15, 2023.
The very big picture (a historical perspective): The CAPE is now at 39.95.
The cyclically adjusted price-to-earnings ratio (CAPE) can be used to smooth out the shorter-term earnings swings to get a longer-term assessment of market valuation. An extremely high CAPE ratio means that a company’s stock price is substantially higher than the company’s earnings would indicate and, therefore, overvalued. It is generally expected that the market will eventually correct the company’s stock price by pushing it down to its true value.
In the past, the CAPE ratio has proved its importance in identifying potential bubbles and market crashes. The historical average of the ratio for the S&P 500 Index is between 15-16, while the highest levels of the ratio have exceeded 30. The record-high levels occurred three times in the history of the U.S. financial markets. The first was in 1929 before the Wall Street crash that signaled the start of the Great Depression. The second was in the late 1990s before the Dotcom Crash, and the third came in 2007 before the 2007-2008 Financial Crisis. https://www.multpl.com/shiller-pe
 Note: We do not use CAPE as an official input into our methods. However, we think history serves as a guide and that it’s good to know where we are on the historic continuum.
THIS WEEK IN THE MARKETS
U.S. Markets:
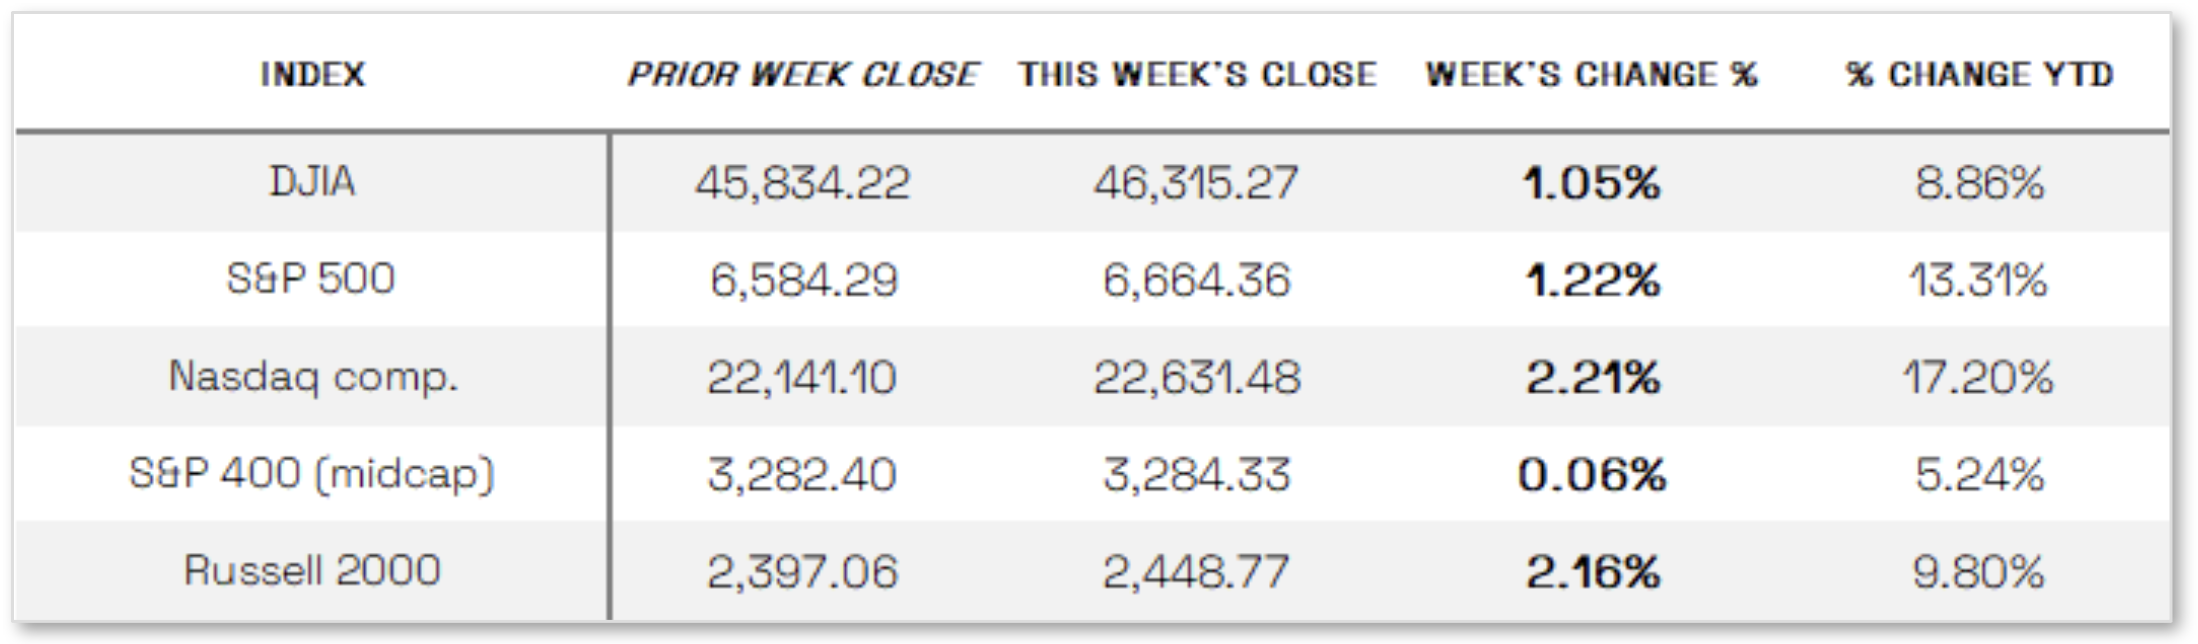
Markets up this week: Major U.S. stock indexes climbed to record highs during the week after the Federal Reserve cut short-term interest rates for the first time in nine months, with small-cap stocks—often more sensitive to rate changes—rallying as the Russell 2000 gained 2.16%; the Nasdaq Composite rose 2.21%, while the S&P 500 and Dow Jones Industrial Average advanced 1.22% and 1.05%, respectively. Trade developments also drew attention after a Friday call between U.S. President Donald Trump and Chinese President Xi Jinping, during which Trump later announced on social media that they had reached an agreement on U.S. ownership of TikTok and made progress on broader trade negotiations.
Looking at the US Indexes:
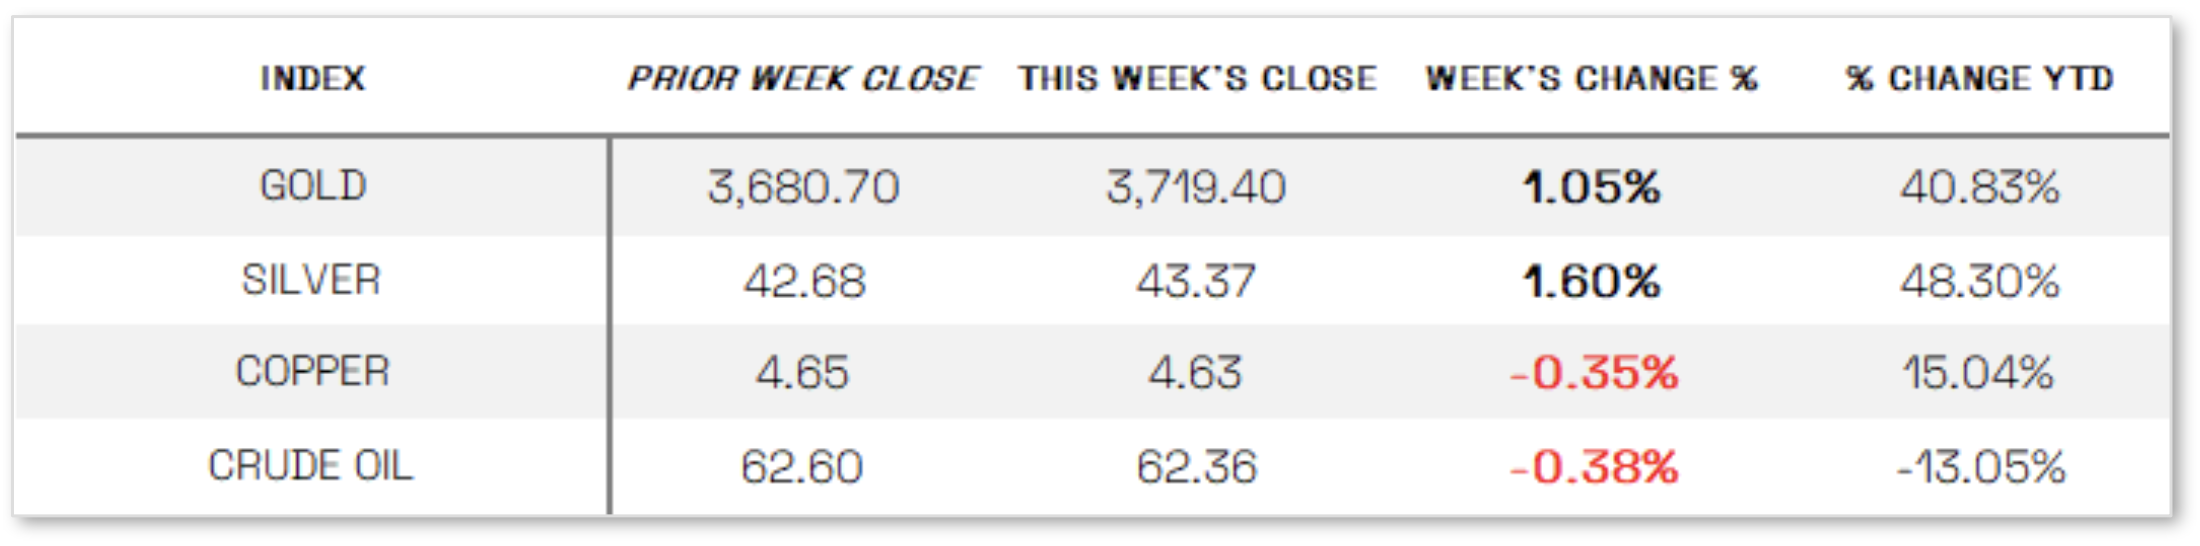
U.S. Commodities/Futures:
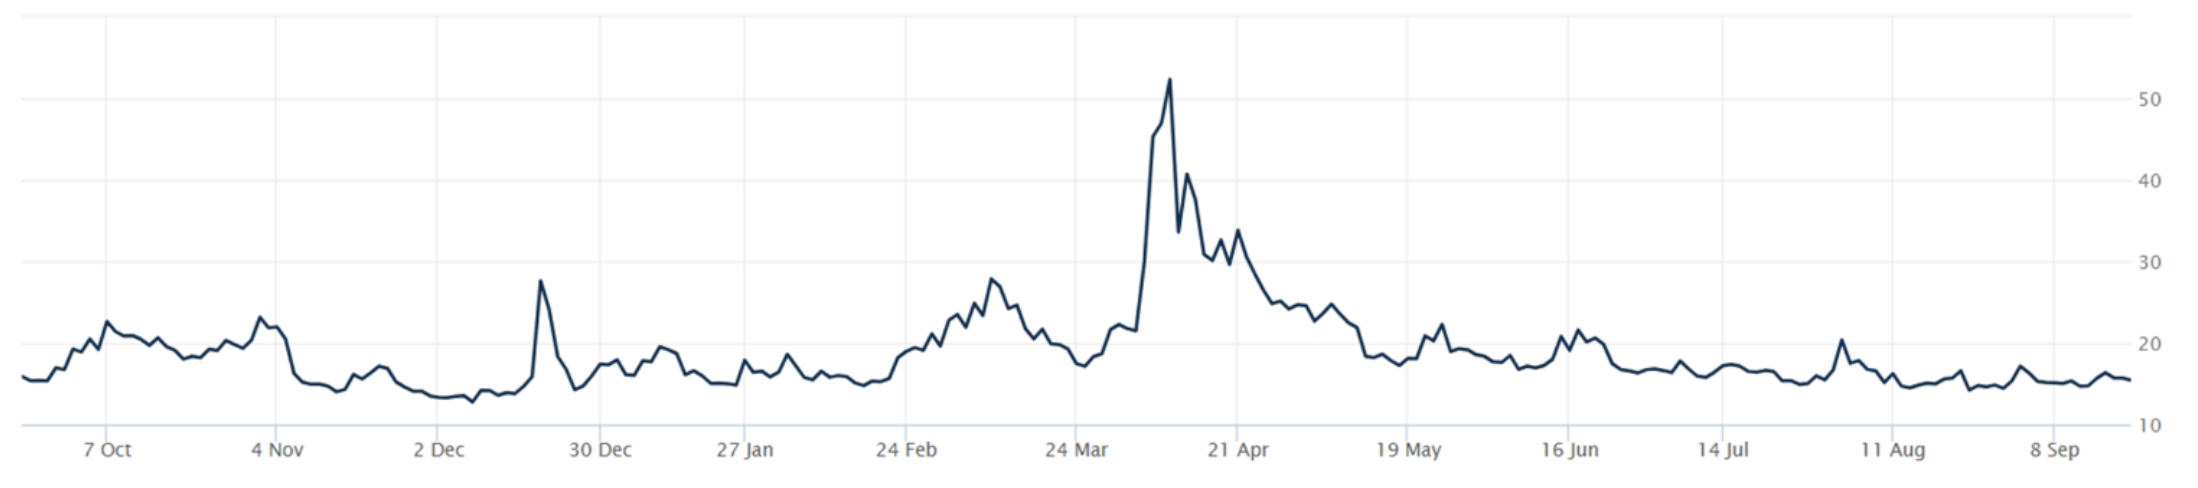
THE VOLATILITY INDEX (VIX) closed at closed at 15.45 this week, a 4.7% increase vs last week’s close of 14.76.
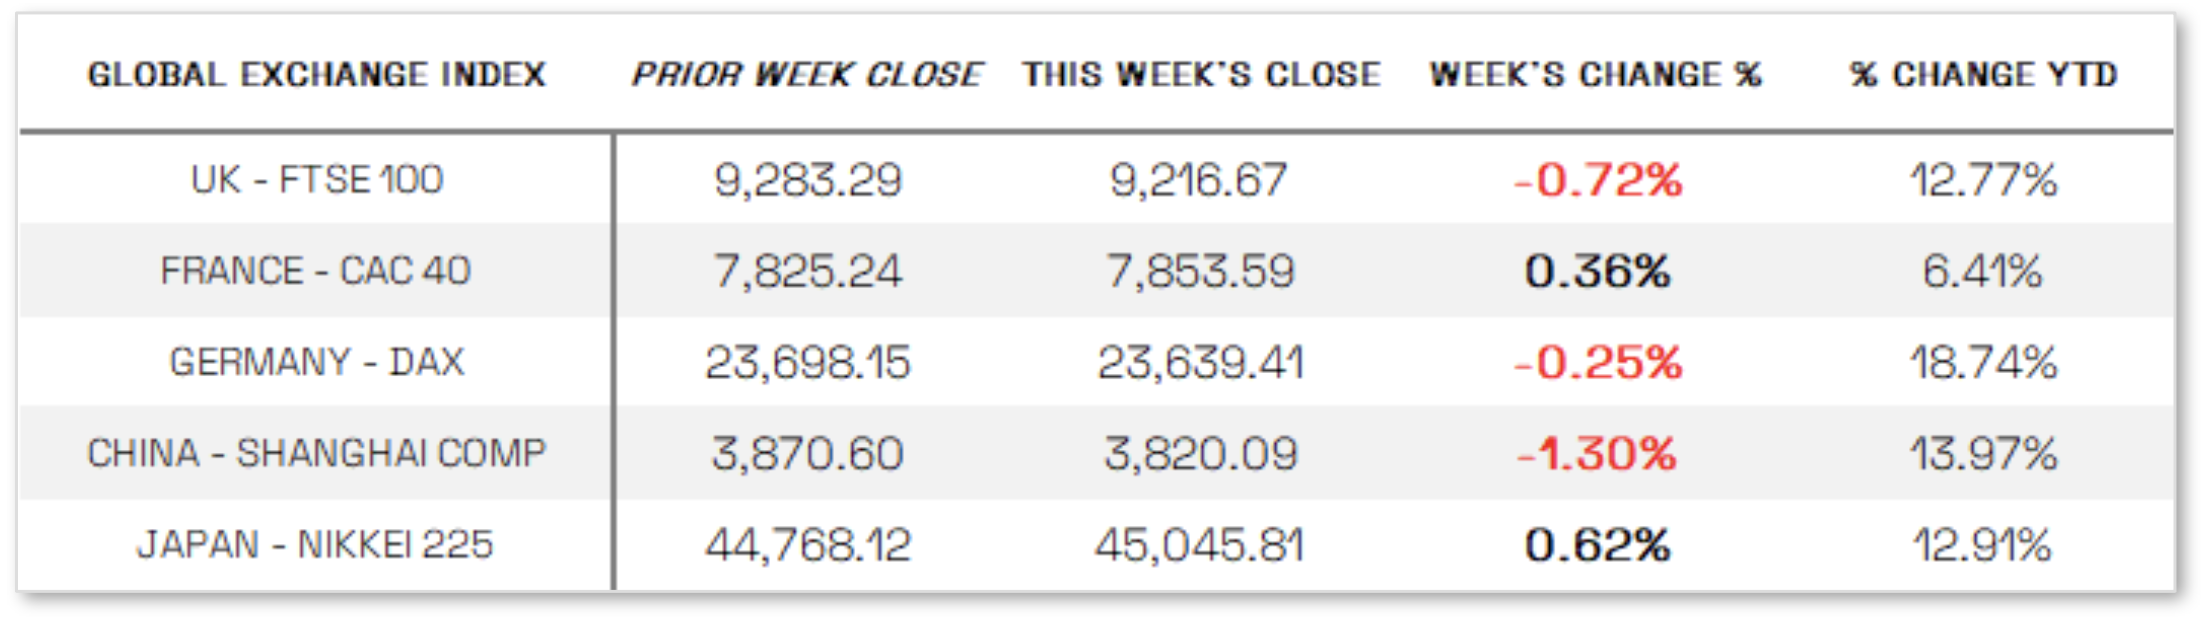
International Markets:
THIS WEEK’S ECONOMIC NEWS
U.S. Economic News:
Fed lowers interest rates:
The week’s economic spotlight was the Federal Reserve’s decision to cut short-term interest rates by 25 basis points—the first move since December 2024—following its two-day policy meeting, with newly appointed Fed Governor Stephen Miran dissenting in favor of a larger 50-basis-point cut; policymakers cited slowing job gains and rising downside risks to employment as key reasons for easing. Investors quickly shifted focus to the Fed’s Summary of Economic Projections, which pointed to an additional 50 basis points of rate cuts by year-end and increased expectations for further easing in 2026 and 2027. Beyond monetary policy, economic data showed retail sales rising 0.6% in August, surpassing expectations and marking a third straight monthly gain, while housing market indicators disappointed: housing starts fell 8.5% to a 1.31 million annualized pace, below estimates, and the National Association of Home Builders’ sentiment index held steady at 32, short of forecasts, though builders’ six-month sales expectations improved on lower mortgage rates and the prospect of further Fed cuts.
International Economic News:
EUROPE: In local currency terms, the pan-European STOXX Europe 600 Index finished the week slightly lower as investors digested a series of monetary policy decisions, with major indexes posting mixed results: France’s CAC 40 gained 0.36%, Germany’s DAX slipped 0.25%, Italy’s FTSE MIB fell 0.60%, and the UK’s FTSE 100 dropped 0.72%. The Bank of England, in a 7–2 vote, left its key interest rate unchanged at 4% as expected but slowed the pace of its bond sales to GBP 70 billion annually from GBP 100 billion to limit pressure on the gilt market amid elevated long-term yields; Governor Andrew Bailey emphasized that while inflation is expected to return to the 2% target, future rate cuts must be gradual and cautious.
JAPAN: Japan’s stock markets ended the week mixed, with the Nikkei 225 rising 0.62% while the broader TOPIX slipped 0.41%, as the Bank of Japan surprised investors by announcing plans to start selling its holdings of exchange-traded funds and real estate investment trusts earlier than expected—a step seen as moving toward policy normalization. As anticipated, the BoJ kept interest rates unchanged at 0.50%, but for the first time under Governor Kazuo Ueda, two policymakers dissented in favor of a hike; the central bank reiterated its willingness to raise rates if economic and price trends align with forecasts. Markets viewed the meeting as hawkish, leaving the possibility of a rate hike later this year, and the 10-year Japanese government bond yield climbed to 1.62% from 1.58% the week before.
CHINA: Mainland Chinese stocks retreated as investors locked in profits following a recent rally and data signaled slowing momentum, with the CSI 300 down 0.44% and the Shanghai Composite off 1.30%, while Hong Kong’s Hang Seng Index rose 0.59%. August retail sales grew 3.4% and industrial output increased 5.2% year over year—the weakest monthly readings of 2025—while fixed asset investment expanded just 0.5% in the first eight months, its lowest pace on record outside of 2020. All three indicators missed expectations, underscoring a broad slowdown after China’s economy grew 5.3% in the first half and reinforcing expectations for further stimulus as Beijing seeks to meet its 5% growth target amid persistent deflationary pressures; producer prices fell for the 35th consecutive month in August, while consumer prices dipped negative for the first time in three months.
Sources:
>> All index and returns data from Norgate Data and Commodity Systems Incorporated and Wall Street Journal.
>> News from Reuters, Barron’s, Wall St. Journal, Bloomberg.com, ft.com, guggenheimpartners.com, zerohedge.com, ritholtz.com, markit.com, financialpost.com, Eurostat, Statistics Canada, Yahoo! Finance, stocksandnews.com, marketwatch.com, visualcapitalist.com, wantchinatimes.com, BBC, 361capital.com, pensionpartners.com, cnbc.com, FactSet, Morningstar/Ibbotson Associates, Corporate Finance Institute.
>> Commentary from T Rowe Price Global markets weekly update — https://www.troweprice.com/personal-investing/resources/insights/global-markets-weekly-update.html
Disclosures: This material and any mention of specific investments is provided for informational purposes only and is not intended to be investment advice or a recommendation to take any action. The forecasts or forward-looking statements are based on assumptions, may not materialize, and are subject to revision without notice. The market indexes discussed are unmanaged, and generally, considered representative of their respective markets. Index performance is not indicative of the past performance of a particular investment. Indexes do not incur management fees, costs, and expenses. Individuals cannot directly invest in unmanaged indexes. Past performance does not guarantee future results.
