


THE COMPLETE PICTURE
>> Four indicators across three time frames.
>> When all the Sherman Portfolios indicators are positive status, we read the market as being in a Bull Market.
1. DELTA-V — Positive since June 27, 2025
2. GALACTIC SHIELD — Positive since April 1, 2023
3. STARFLUX — Positive since May 12, 2025
4. STARPATH — Positive since August 15, 2025
The shorter term picture:
>> GALACTIC SHIELD — POSITIVE, for Q3 2025, This indicator is based on the combination of U.S. and International Equities trend statuses at the start of each quarter.
>> STARFLUX — POSITIVE, Starflux ended the week at 7.96 (Down 6.35% last week) This short-term indicator measures U.S. Equities.
>> STARPATH — POSITIVE, This indicator measures the interplay on dual timeframes of our Type 1s + the Russell 3000 + our four most ‘pro-cyclical’ Type 3s, vs. Cash.
The big picture:
The ‘big picture’ is the (typically) years-long timeframe, the same timeframe in which Cyclical Bulls and Bears operate.
>> The Sherman Portfolios DELTA-V Indicator measuring the Bull/Bear cycle finished the week in a Bull status at 70.67, up 3.02% from the prior week’s 68.60. It has signaled Bull since June 27, 2025.
>> The Sherman Portfolios DELTA-V Bond Indicator measuring the Bull/Bear cycle finished the week in BULL status at 66.37, up 4.11% from the prior week’s 63.75. It has signaled Bull since December 15, 2023.
The very big picture (a historical perspective): The CAPE is now at 39.56.
The cyclically adjusted price-to-earnings ratio (CAPE) can be used to smooth out the shorter-term earnings swings to get a longer-term assessment of market valuation. An extremely high CAPE ratio means that a company’s stock price is substantially higher than the company’s earnings would indicate and, therefore, overvalued. It is generally expected that the market will eventually correct the company’s stock price by pushing it down to its true value.
In the past, the CAPE ratio has proved its importance in identifying potential bubbles and market crashes. The historical average of the ratio for the S&P 500 Index is between 15-16, while the highest levels of the ratio have exceeded 30. The record-high levels occurred three times in the history of the U.S. financial markets. The first was in 1929 before the Wall Street crash that signaled the start of the Great Depression. The second was in the late 1990s before the Dotcom Crash, and the third came in 2007 before the 2007-2008 Financial Crisis. https://www.multpl.com/shiller-pe
 Note: We do not use CAPE as an official input into our methods. However, we think history serves as a guide and that it’s good to know where we are on the historic continuum.
THIS WEEK IN THE MARKETS
U.S. Markets:
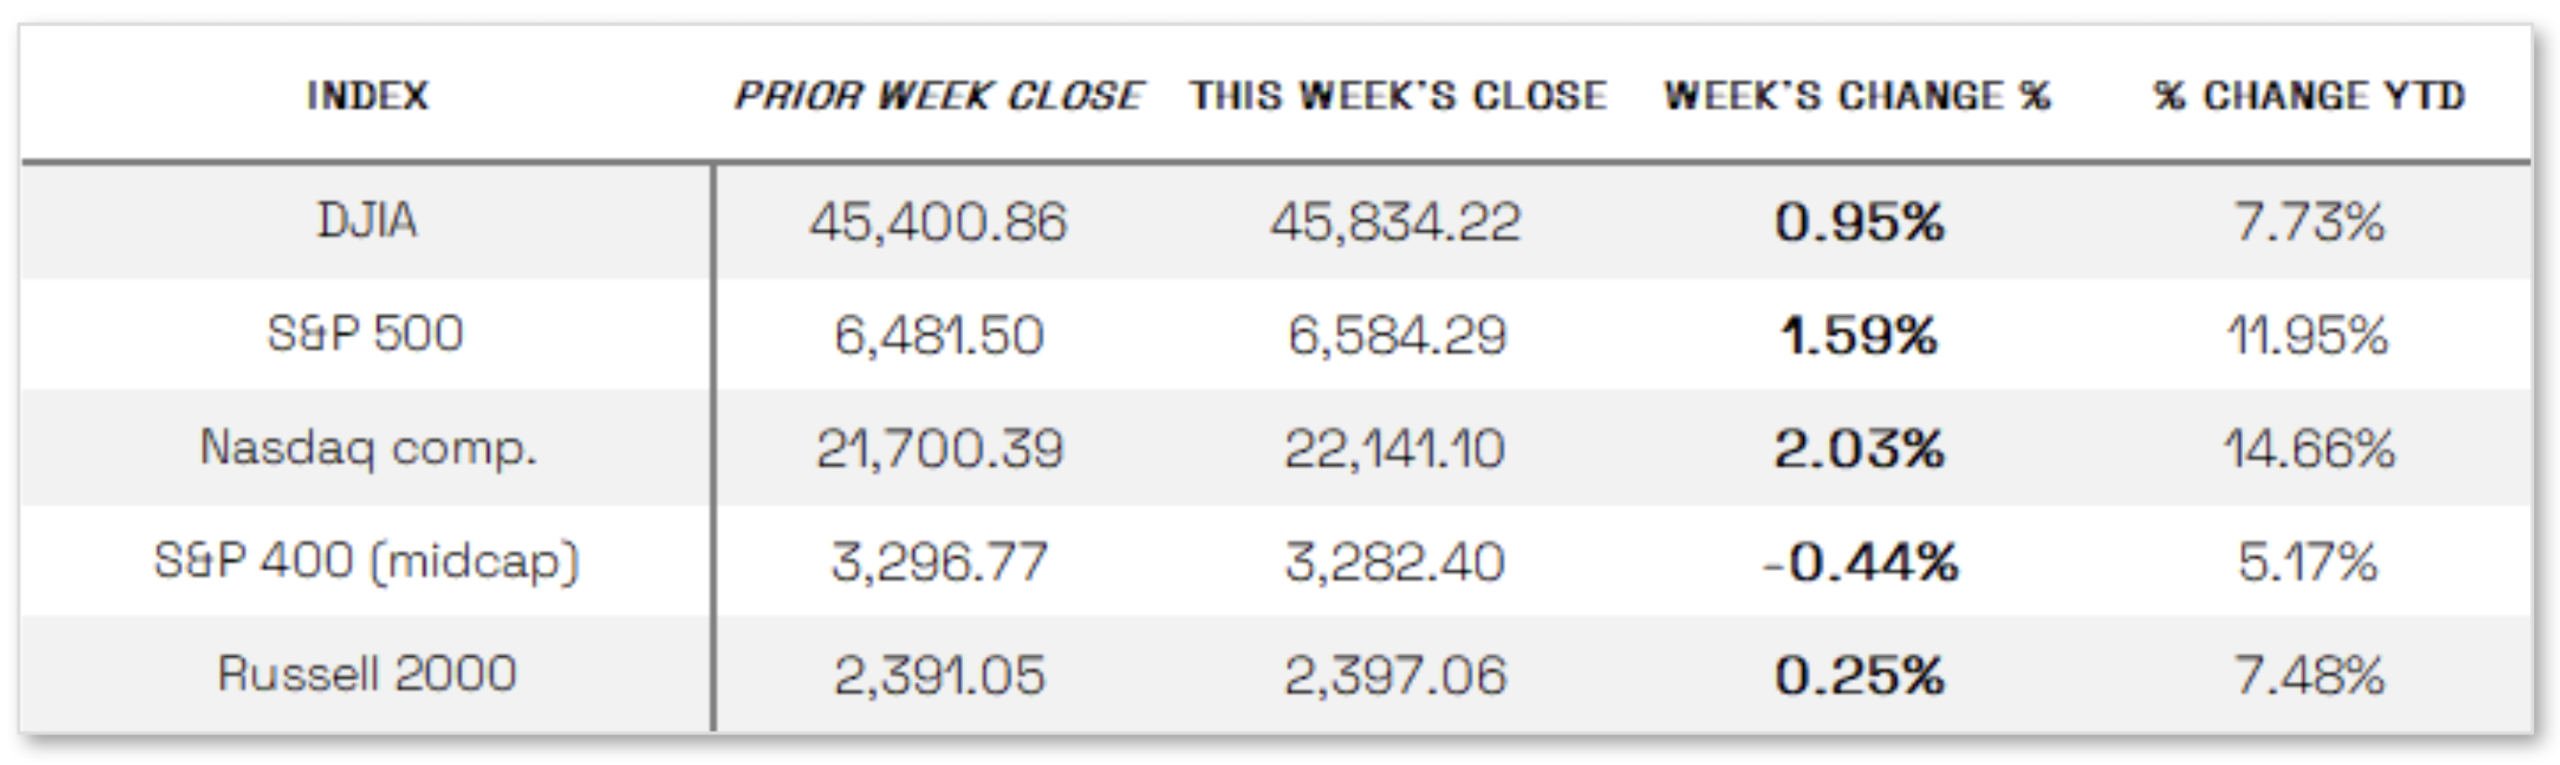
Markets up this week: U.S. stocks climbed higher last week as investors looked ahead to the Federal Reserve’s September 16–17 meeting, where a short-term rate cut is widely expected, while optimism around artificial intelligence added momentum following Oracle’s announcement of a major guidance boost tied to large new AI deals. The Dow Jones Industrial Average, S&P 500, and Nasdaq Composite each hit record highs before the Dow and S&P eased slightly in Friday’s quiet session, while the Russell 2000 extended its winning streak to six weeks. Treasuries also advanced, with long-term yields generally declining and short-term yields holding steady, as strong demand at several auctions and movements tied to Thursday’s CPI report shaped the yield curve.
Looking at the US Indexes:
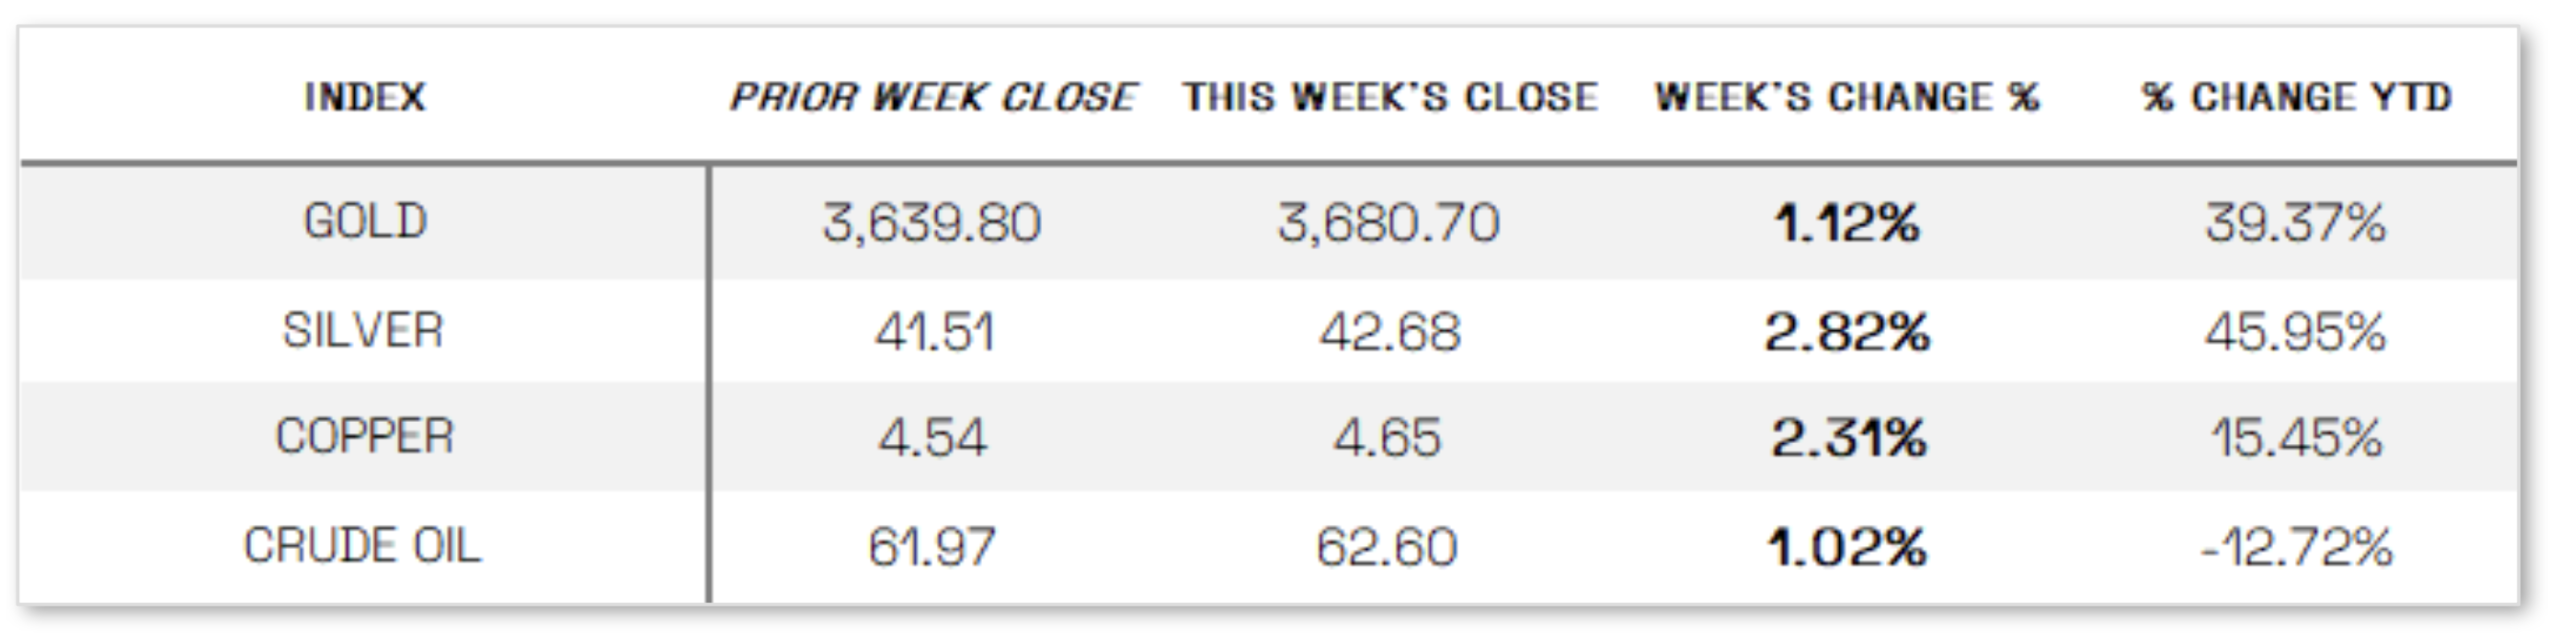
U.S. Commodities/Futures:
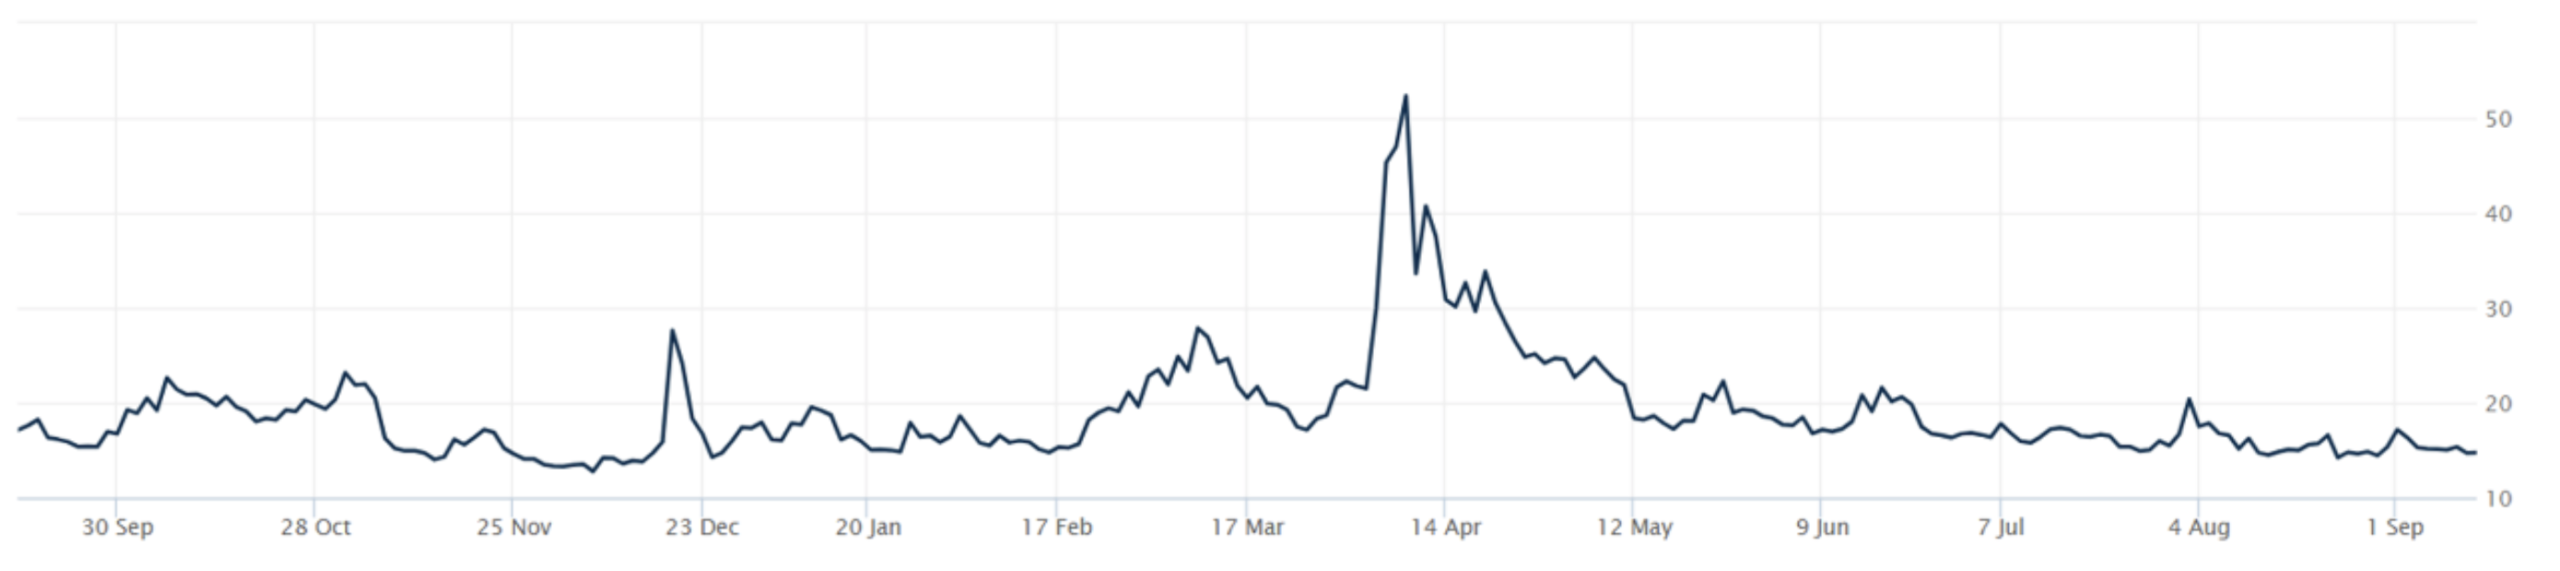
THE VOLATILITY INDEX (VIX) closed at 14.76 this week, a 2.8% decrease vs last week’s close of 15.18.
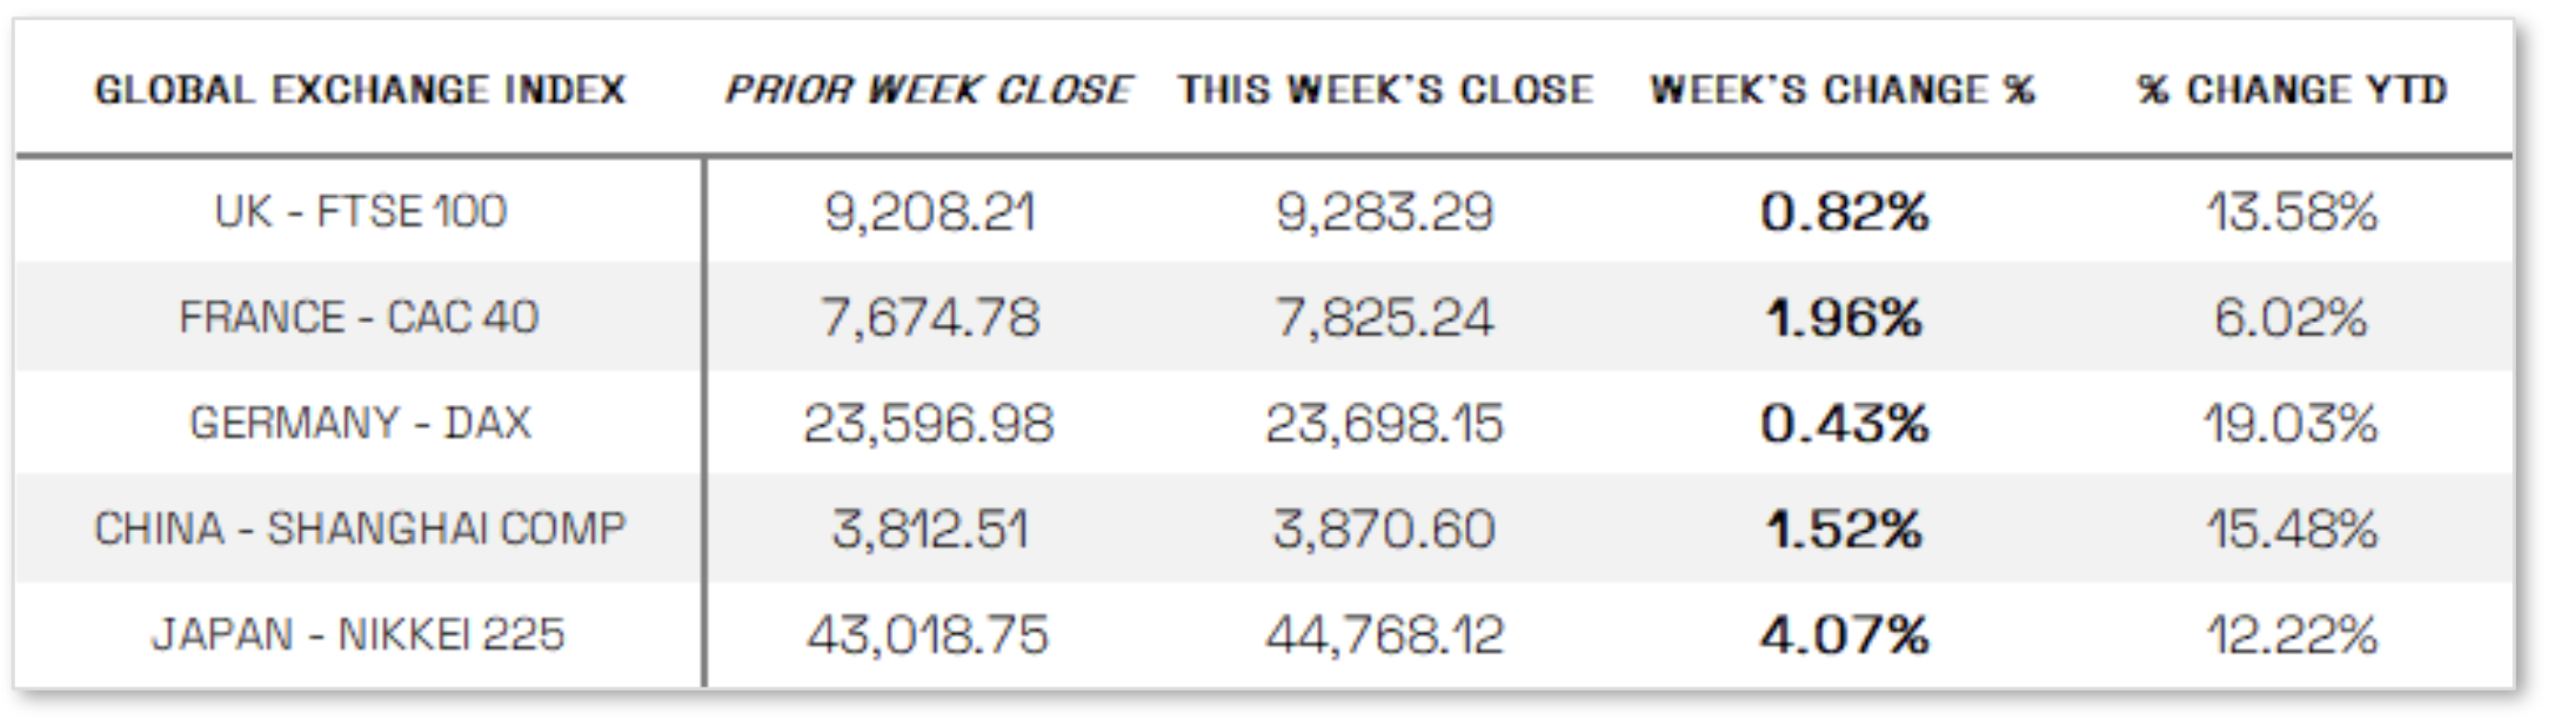
International Markets:
THIS WEEK’S ECONOMIC NEWS
U.S. Economic News:
Inflation and consumer sentiment dampens outlook:
August inflation data showed headline CPI rising 2.9% year over year, up from July’s 2.7%, while core CPI increased 3.1%, but a slowdown in wholesale inflation—with PPI easing to 2.6% from 3.1%—helped temper concerns, leaving investors confident the Federal Reserve will still cut rates at its upcoming meeting despite inflation remaining above the 2% target. Labor market weakness reinforced those expectations, as jobless claims climbed to 263,000—the highest since October 2021—and revised payroll figures revealed 911,000 fewer jobs created over the past year than previously estimated. Consumer sentiment also slipped in September, with the University of Michigan’s index falling to 55.4 from 58.2, as respondents cited risks to business conditions, labor markets, and inflation, while near-term inflation expectations held at 4.8% and long-term expectations edged up to 3.9%.
International Economic News:
EUROPE: The pan-European STOXX Europe 600 Index rose 1.03% in local currency terms, supported by expectations of U.S. rate cuts, with Italy’s FTSE MIB up 2.30%, France’s CAC 40 up 1.96%, Germany’s DAX gaining 0.43%, and the UK’s FTSE 100 adding 0.82%. Meanwhile, the European Central Bank held its key deposit rate at 2% as anticipated, with President Christine Lagarde stating the eurozone was “in a good place” as inflation sits at 2%. The ECB slightly raised its inflation and growth forecasts for this year—now expecting 1.2% GDP growth versus 0.9% previously—while projecting inflation at 2.1% in 2025 and 1.7% in 2026. However, growth expectations for 2026 were trimmed to 1% from 1.1% amid weaker global demand, and economist Tomasz Wieladek suggested one more rate cut could still be possible.
JAPAN: Japan’s stock markets advanced over the week, with the Nikkei 225 climbing 4.07% and the TOPIX rising 1.78%, as investors absorbed Prime Minister Shigeru Ishiba’s announcement that he will resign after two election defeats in 12 months, prompting an emergency Liberal Democratic Party leadership vote on October 4 that could determine whether his successor pursues more expansionary fiscal policies, including possible tax cuts. The 10-year Japanese government bond yield edged up to 1.58% from 1.57%, while the yen held near JPY 147 per U.S. dollar. Although political uncertainty fueled speculation that the Bank of Japan might delay further tightening, many investors still expect the central bank to raise rates later this year, with its next policy decision due September 19, when it is widely anticipated to keep rates steady as it evaluates the effects of U.S. tariffs.
CHINA: Mainland Chinese stocks gained as retail investor optimism persisted, with the CSI 300 Index up 1.38% and the Shanghai Composite rising 1.52% in local currency terms, while Hong Kong’s Hang Seng Index jumped 3.82%. The rally, ongoing since April, has been fueled more by abundant domestic liquidity than by stronger earnings or economic data, as cash-rich households chase higher returns in a low-rate environment with limited investment alternatives. Sentiment has also been supported by advances in artificial intelligence and Beijing’s “anti-involution” campaign aimed at curbing overcapacity and price wars. On Thursday, the CSI 300 logged its biggest one-day gain since March, driven by tech companies seen as key beneficiaries of China’s push for self-sufficiency in technology.
Sources:
>> All index and returns data from Norgate Data and Commodity Systems Incorporated and Wall Street Journal.
>> News from Reuters, Barron’s, Wall St. Journal, Bloomberg.com, ft.com, guggenheimpartners.com, zerohedge.com, ritholtz.com, markit.com, financialpost.com, Eurostat, Statistics Canada, Yahoo! Finance, stocksandnews.com, marketwatch.com, visualcapitalist.com, wantchinatimes.com, BBC, 361capital.com, pensionpartners.com, cnbc.com, FactSet, Morningstar/Ibbotson Associates, Corporate Finance Institute.
>> Commentary from T Rowe Price Global markets weekly update — https://www.troweprice.com/personal-investing/resources/insights/global-markets-weekly-update.html
Disclosures: This material and any mention of specific investments is provided for informational purposes only and is not intended to be investment advice or a recommendation to take any action. The forecasts or forward-looking statements are based on assumptions, may not materialize, and are subject to revision without notice. The market indexes discussed are unmanaged, and generally, considered representative of their respective markets. Index performance is not indicative of the past performance of a particular investment. Indexes do not incur management fees, costs, and expenses. Individuals cannot directly invest in unmanaged indexes. Past performance does not guarantee future results.
