


THE COMPLETE PICTURE
>> Four indicators across three time frames.
>> When all the Sherman Portfolios indicators are positive status, we read the market as being in a Bull Market.
1. DELTA-V — Positive since June 27, 2025
2. GALACTIC SHIELD — Positive since April 1, 2023
3. STARFLUX — Positive since May 12, 2025
4. STARPATH — Positive since August 15, 2025
The shorter term picture:
>> GALACTIC SHIELD — POSITIVE, for Q3 2025. This indicator is based on the combination of U.S. and International Equities trend statuses at the start of each quarter.
>> STARFLUX — POSITIVE, Starflux ended the week at 8.11 (Down 14.18% last week). This short-term indicator measures U.S. Equities.
>> STARPATH — POSITIVE, This indicator measures the interplay on dual timeframes of our Type 1s + the Russell 3000 + our four most ‘pro-cyclical’ Type 3s, vs. Cash.
The big picture:
The ‘big picture’ is the (typically) years-long timeframe, the same timeframe in which Cyclical Bulls and Bears operate.
>> The Sherman Portfolios DELTA-V Indicator measuring the Bull/Bear cycle finished the week in a Bull status at 66.83, up 2.03% from the prior week’s 65.50. It has signaled Bull since June 27, 2025.
>> The Sherman Portfolios DELTA-V Bond Indicator measuring the Bull/Bear cycle finished the week in BULL status at 61.95, up 8.46% from the prior week’s 57.12. It has signaled Bull since December 15, 2023.
The very big picture (a historical perspective): The CAPE is now at 38.96.
The cyclically adjusted price-to-earnings ratio (CAPE) can be used to smooth out the shorter-term earnings swings to get a longer-term assessment of market valuation. An extremely high CAPE ratio means that a company’s stock price is substantially higher than the company’s earnings would indicate and, therefore, overvalued. It is generally expected that the market will eventually correct the company’s stock price by pushing it down to its true value.
In the past, the CAPE ratio has proved its importance in identifying potential bubbles and market crashes. The historical average of the ratio for the S&P 500 Index is between 15-16, while the highest levels of the ratio have exceeded 30. The record-high levels occurred three times in the history of the U.S. financial markets. The first was in 1929 before the Wall Street crash that signaled the start of the Great Depression. The second was in the late 1990s before the Dotcom Crash, and the third came in 2007 before the 2007-2008 Financial Crisis. https://www.multpl.com/shiller-pe
 Note: We do not use CAPE as an official input into our methods. However, we think history serves as a guide and that it’s good to know where we are on the historic continuum.
THIS WEEK IN THE MARKETS
U.S. Markets:
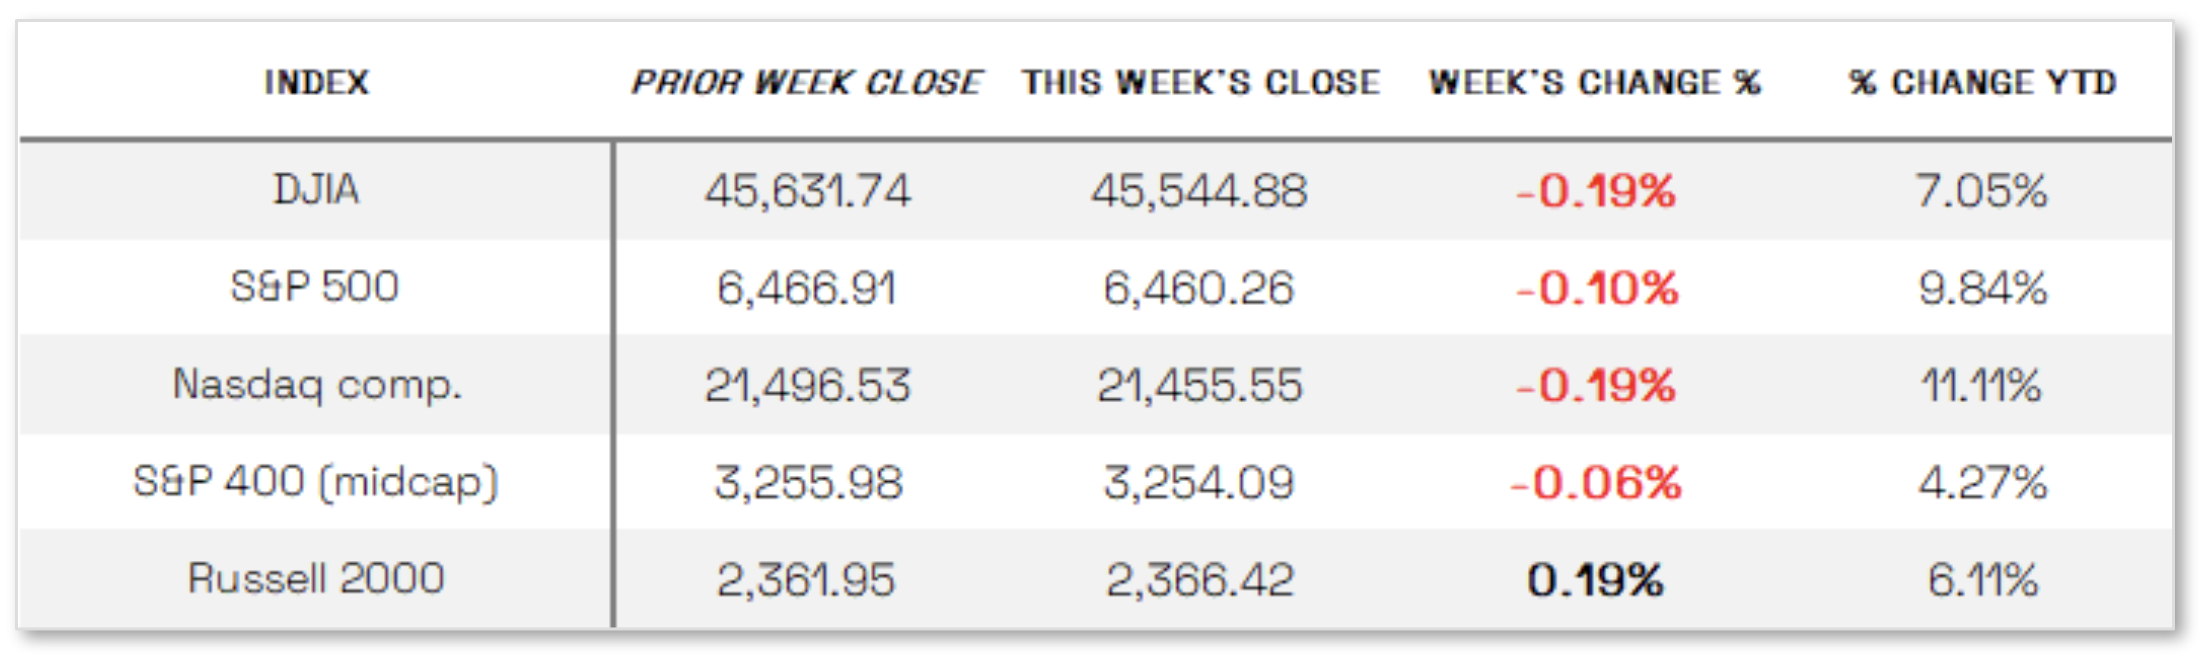
Markets slightly down this week: Most U.S. equity indexes finished the week modestly lower on relatively light trading ahead of the holiday weekend, with markets set to close Monday, September 1, for Labor Day; small-cap stocks led performance as the Russell 2000 Index gained and outpaced the S&P 500 for a third consecutive week, while the Dow briefly reached a record high before retreating to end lower. Economic news was limited, with investor focus centered on NVIDIA’s Wednesday earnings release, which topped FactSet consensus estimates; although the stock slipped Thursday, the strong results helped ease concerns about the sustainability of the artificial intelligence–driven rally that has fueled this year’s market highs.
Looking at the US Indexes:
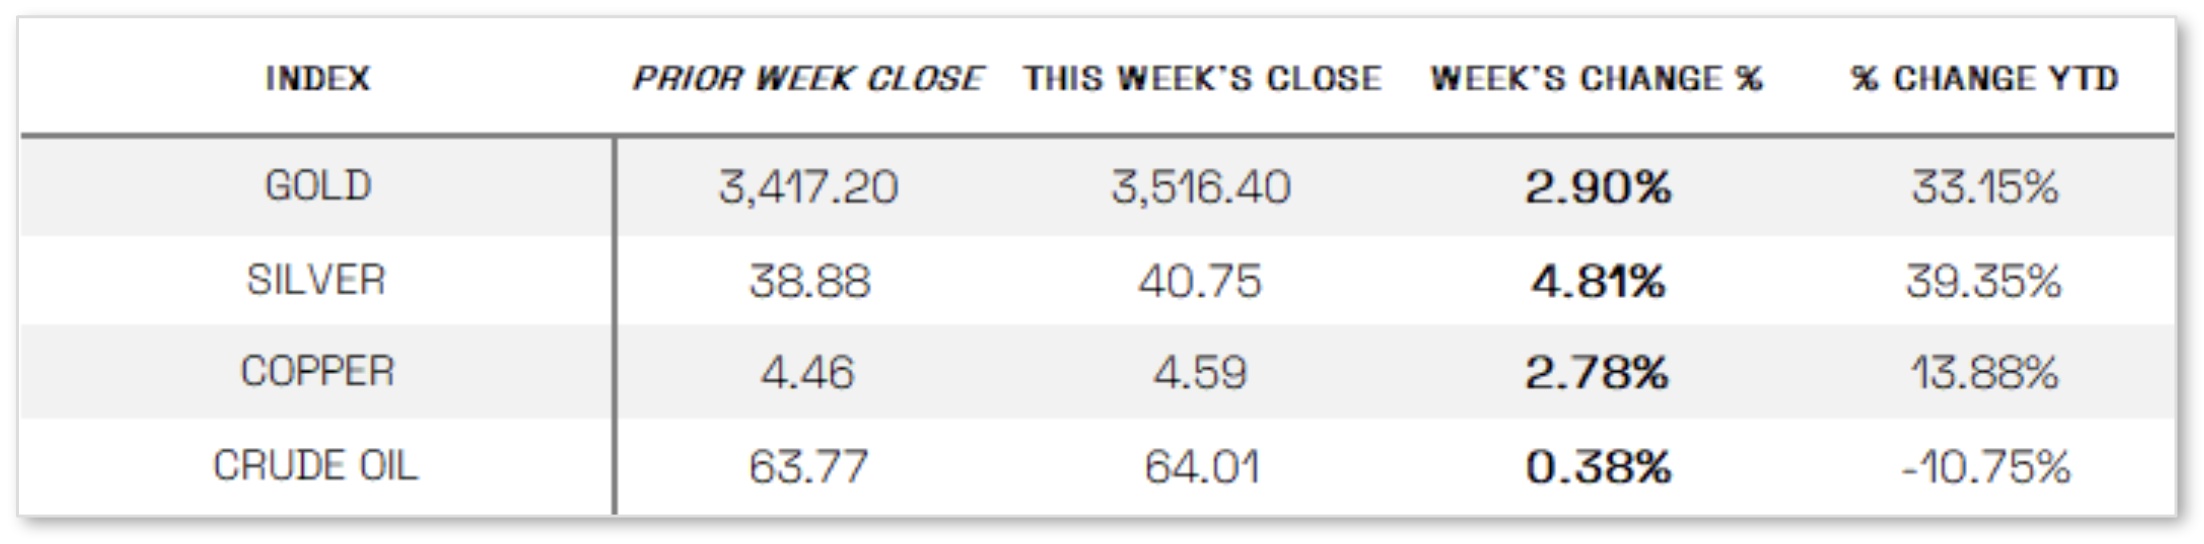
U.S. Commodities/Futures:
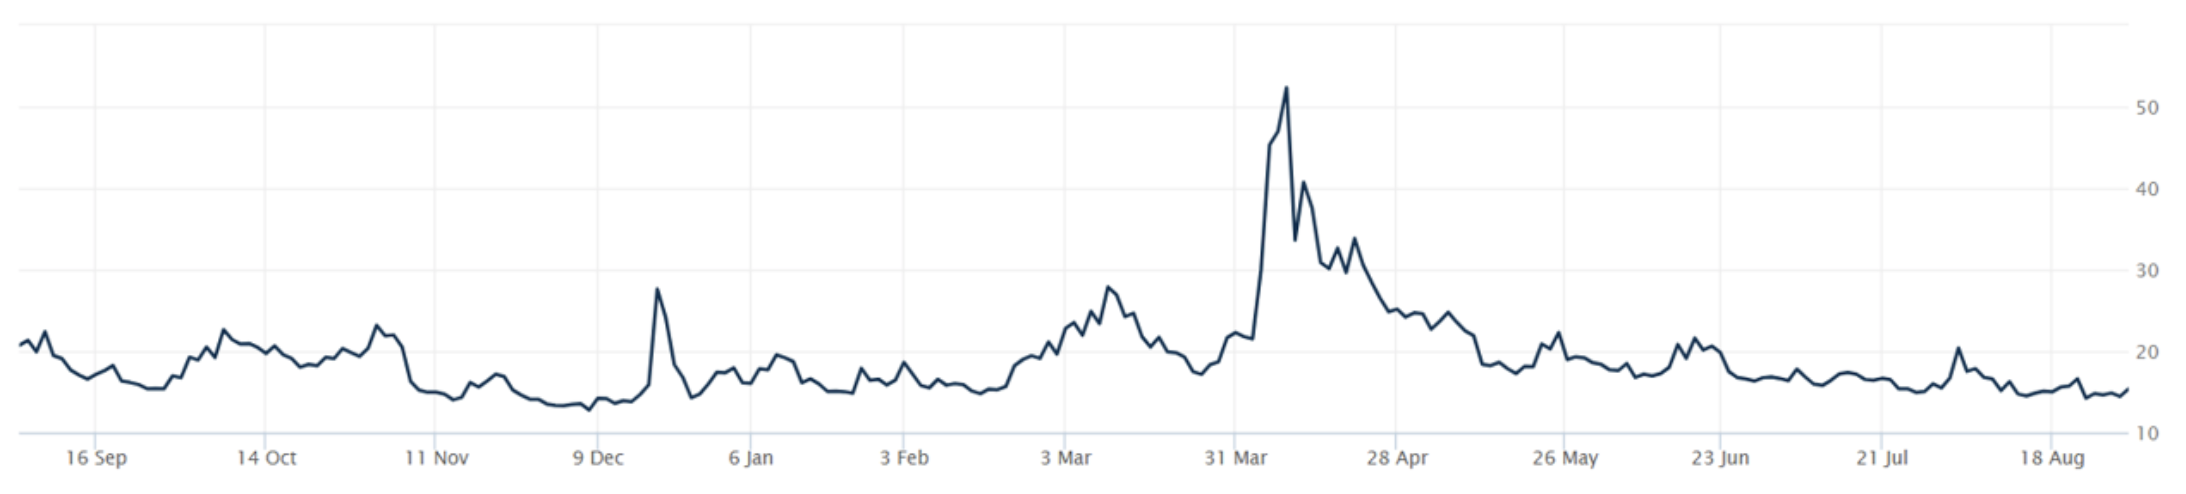
THE VOLATILITY INDEX (VIX) closed at 15.36 this week, an 8.0% increase vs last week’s close of 14.22.
International Markets:
THIS WEEK’S ECONOMIC NEWS
U.S. Economic News:
PCE and Fed Governor news:
Concerns over Federal Reserve independence drew attention after President Donald Trump announced he would remove Fed Governor Lisa Cook, citing mortgage fraud allegations; Cook responded by filing a lawsuit to block the firing, and a Fed spokesperson said the central bank would comply with any court ruling. Meanwhile, Governor Christopher Waller, who had supported a 25-basis-point cut at the Fed’s most recent meeting, reaffirmed Thursday that he will back another cut in September and expects further reductions over the next three to six months, citing rising risks to the labor market and slowing economic activity. On the data front, July’s core personal consumption expenditures (PCE) price index, the Fed’s preferred inflation gauge, rose 0.3% from June—matching expectations—while personal spending and income increased by 0.5% and 0.4%, respectively; separately, the Bureau of Economic Analysis revised second-quarter GDP growth upward to 3.3% from 3%, driven by stronger business investment and consumer spending.
International Economic News:
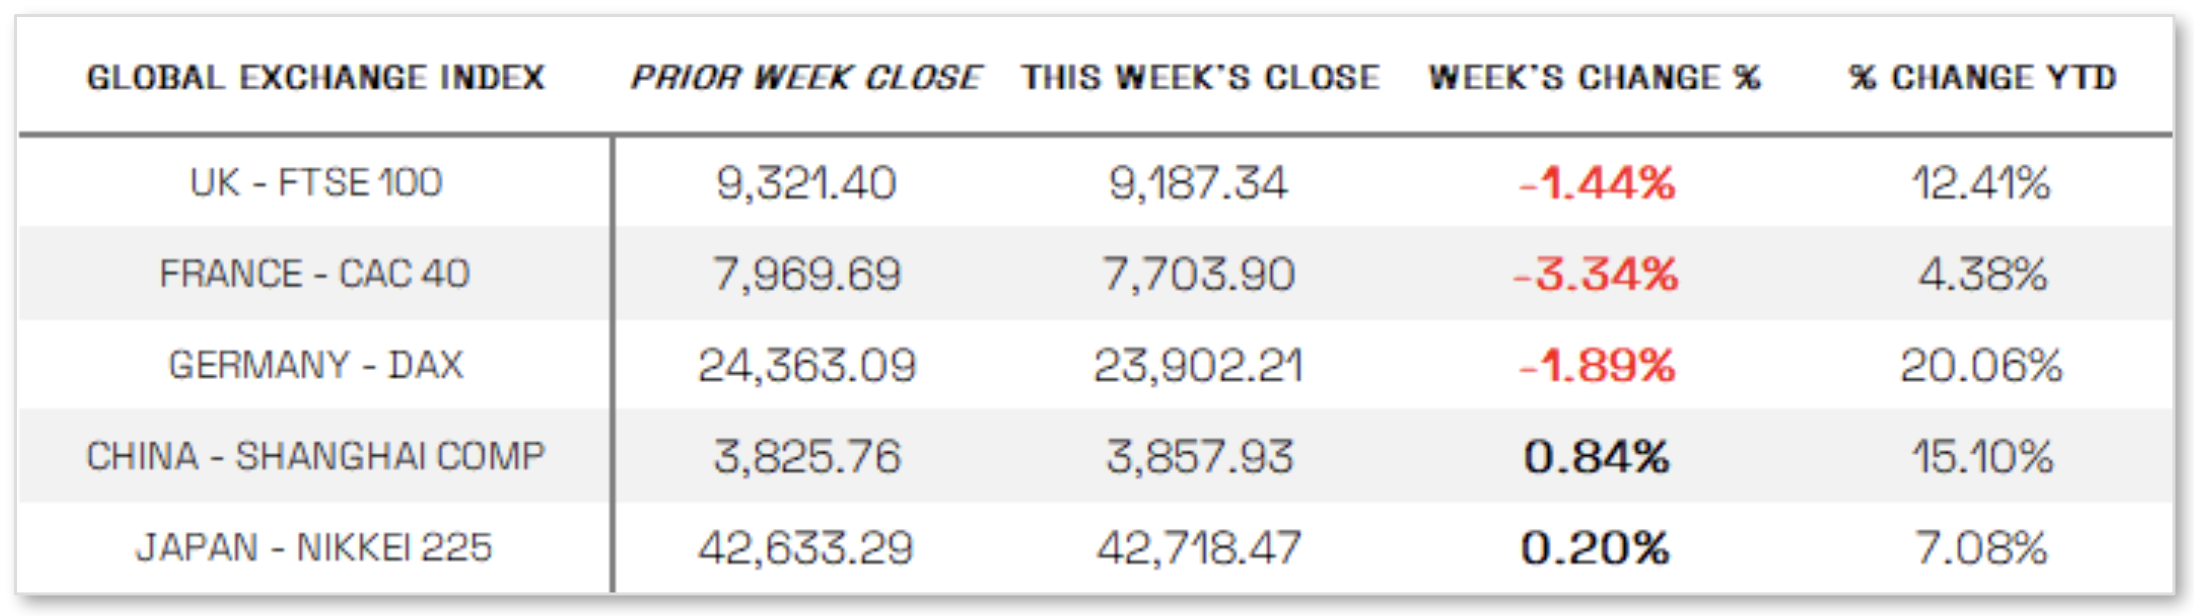
EUROPE: The pan-European STOXX Europe 600 Index fell 1.99% in local currency terms, pressured by concerns over U.S. Federal Reserve independence, renewed tariff uncertainty, political instability in France, and diminished hopes for peace between Russia and Ukraine; major national indexes also declined, with France’s CAC 40 down 3.34%, Italy’s FTSE MIB off 2.57%, Germany’s DAX lower by 1.89%, and the UK’s FTSE 100 down 1.44%. European Central Bank (ECB) minutes from July revealed a split among policymakers, as some highlighted downside inflation risks tied to weak growth, U.S. tariffs, and a strong euro, while others warned of potential upside risks from energy and currency volatility; later remarks at the Federal Reserve’s Jackson Hole symposium suggested a high bar for another rate cut in the near term, though officials indicated discussions could resume in the fall if the economy weakens. Supporting a cautious stance, preliminary inflation data showed Germany’s harmonized rate rising to 2.1% year over year from 1.8% and above expectations, Spain holding steady at 2.7%, and France easing slightly to 0.8% from 0.9%, collectively weakening the case for an immediate policy change.
JAPAN: Japan’s stock markets ended the week mixed, with the Nikkei 225 rising 0.20% while the TOPIX fell 0.83%, as profit taking linked to month-end portfolio rebalancing—favoring bonds over equities—weighed on sentiment, though equities steadied ahead of a U.S. inflation report; trade talks with the U.S. were also delayed after chief negotiator Ryosei Akazawa canceled a last-minute trip to Washington due to unresolved issues. The yen held steady around JPY 146 per U.S. dollar as investors weighed concerns over Federal Reserve independence alongside domestic economic data. Meanwhile, the 10-year Japanese government bond yield hovered near a 17-year high of 1.61%, with expectations for a Bank of Japan rate hike strengthening after Tokyo inflation remained above the 2% target and unemployment unexpectedly declined; reinforcing this outlook, BoJ Governor Kazuo Ueda said at the Fed’s Jackson Hole symposium that a tightening labor market should push wages higher, signaling conditions for another increase are taking shape.
CHINA: Mainland Chinese equities extended their recent rally, with the CSI 300 Index climbing 2.71% and the Shanghai Composite gaining 0.84% in local currency terms, while Hong Kong’s Hang Seng Index fell 1.03%. The CSI 300 has surged about 10% in August, making it one of the best-performing major indexes, with average daily turnover on pace for a record high; analysts attribute the rally more to abundant domestic liquidity than to economic strength, as cash-rich households seek higher returns amid low rates and limited alternatives, with margin debt rising to its highest level since 2015, signaling strong retail participation. On the economic side, July industrial profits declined 1.5%, less than expected, as robust tech earnings helped offset weakness in demand-strained industries, though earlier data showed retail sales, factory activity, and fixed asset investment slowed, fueling expectations that policymakers may introduce additional stimulus as early as September to counter a U.S.-driven trade war and cushion China’s growth slowdown.
Sources:
>> All index and returns data from Norgate Data and Commodity Systems Incorporated and Wall Street Journal.
>> News from Reuters, Barron’s, Wall St. Journal, Bloomberg.com, ft.com, guggenheimpartners.com, zerohedge.com, ritholtz.com, markit.com, financialpost.com, Eurostat, Statistics Canada, Yahoo! Finance, stocksandnews.com, marketwatch.com, visualcapitalist.com, wantchinatimes.com, BBC, 361capital.com, pensionpartners.com, cnbc.com, FactSet, Morningstar/Ibbotson Associates, Corporate Finance Institute.
>> Commentary from T Rowe Price Global markets weekly update — https://www.troweprice.com/personal-investing/resources/insights/global-markets-weekly-update.html
Disclosures: This material and any mention of specific investments is provided for informational purposes only and is not intended to be investment advice or a recommendation to take any action. The forecasts or forward-looking statements are based on assumptions, may not materialize, and are subject to revision without notice. The market indexes discussed are unmanaged, and generally, considered representative of their respective markets. Index performance is not indicative of the past performance of a particular investment. Indexes do not incur management fees, costs, and expenses. Individuals cannot directly invest in unmanaged indexes. Past performance does not guarantee future results.
