


THE COMPLETE PICTURE
>> Four indicators across three time frames.
>> When all the Sherman Portfolios indicators are positive status, we read the market as being in a Bull Market.
1. DELTA-V — Positive since June 27, 2025
2. GALACTIC SHIELD — Positive since April 1, 2023
3. STARFLUX — Positive since May 12, 2025
4. STARPATH — Positive since August 15, 2025
The shorter term picture:
>> GALACTIC SHIELD — POSITIVE, for Q3 2025, This indicator is based on the combination of U.S. and International Equities trend statuses at the start of each quarter.
>> STARFLUX — POSITIVE, Starflux ended the week at 9.45 (Up 5.70% last week). This short-term indicator measures U.S. Equities.
>> STARPATH — POSITIVE, This indicator measures the interplay on dual timeframes of our Type 1s + the Russell 3000 + our four most ‘pro-cyclical’ Type 3s, vs. Cash.
The big picture:
The ‘big picture’ is the (typically) years-long timeframe, the same timeframe in which Cyclical Bulls and Bears operate.
>> The Sherman Portfolios DELTA-V Indicator measuring the Bull/Bear cycle finished the week in a Bull status at 65.50, up 2.20% from the prior week’s 64.09. It has signaled Bull since June 27, 2025.
>> The Sherman Portfolios DELTA-V Bond Indicator measuring the Bull/Bear cycle finished the week in BULL status at 57.12, down 2.36% from the prior week’s 58.51. It has signaled Bull since December 15, 2023.
The very big picture (a historical perspective): The CAPE is now at 38.96.
The cyclically adjusted price-to-earnings ratio (CAPE) can be used to smooth out the shorter-term earnings swings to get a longer-term assessment of market valuation. An extremely high CAPE ratio means that a company’s stock price is substantially higher than the company’s earnings would indicate and, therefore, overvalued. It is generally expected that the market will eventually correct the company’s stock price by pushing it down to its true value.
In the past, the CAPE ratio has proved its importance in identifying potential bubbles and market crashes. The historical average of the ratio for the S&P 500 Index is between 15-16, while the highest levels of the ratio have exceeded 30. The record-high levels occurred three times in the history of the U.S. financial markets. The first was in 1929 before the Wall Street crash that signaled the start of the Great Depression. The second was in the late 1990s before the Dotcom Crash, and the third came in 2007 before the 2007-2008 Financial Crisis. https://www.multpl.com/shiller-pe
 Note: We do not use CAPE as an official input into our methods. However, we think history serves as a guide and that it’s good to know where we are on the historic continuum.
THIS WEEK IN THE MARKETS
U.S. Markets:
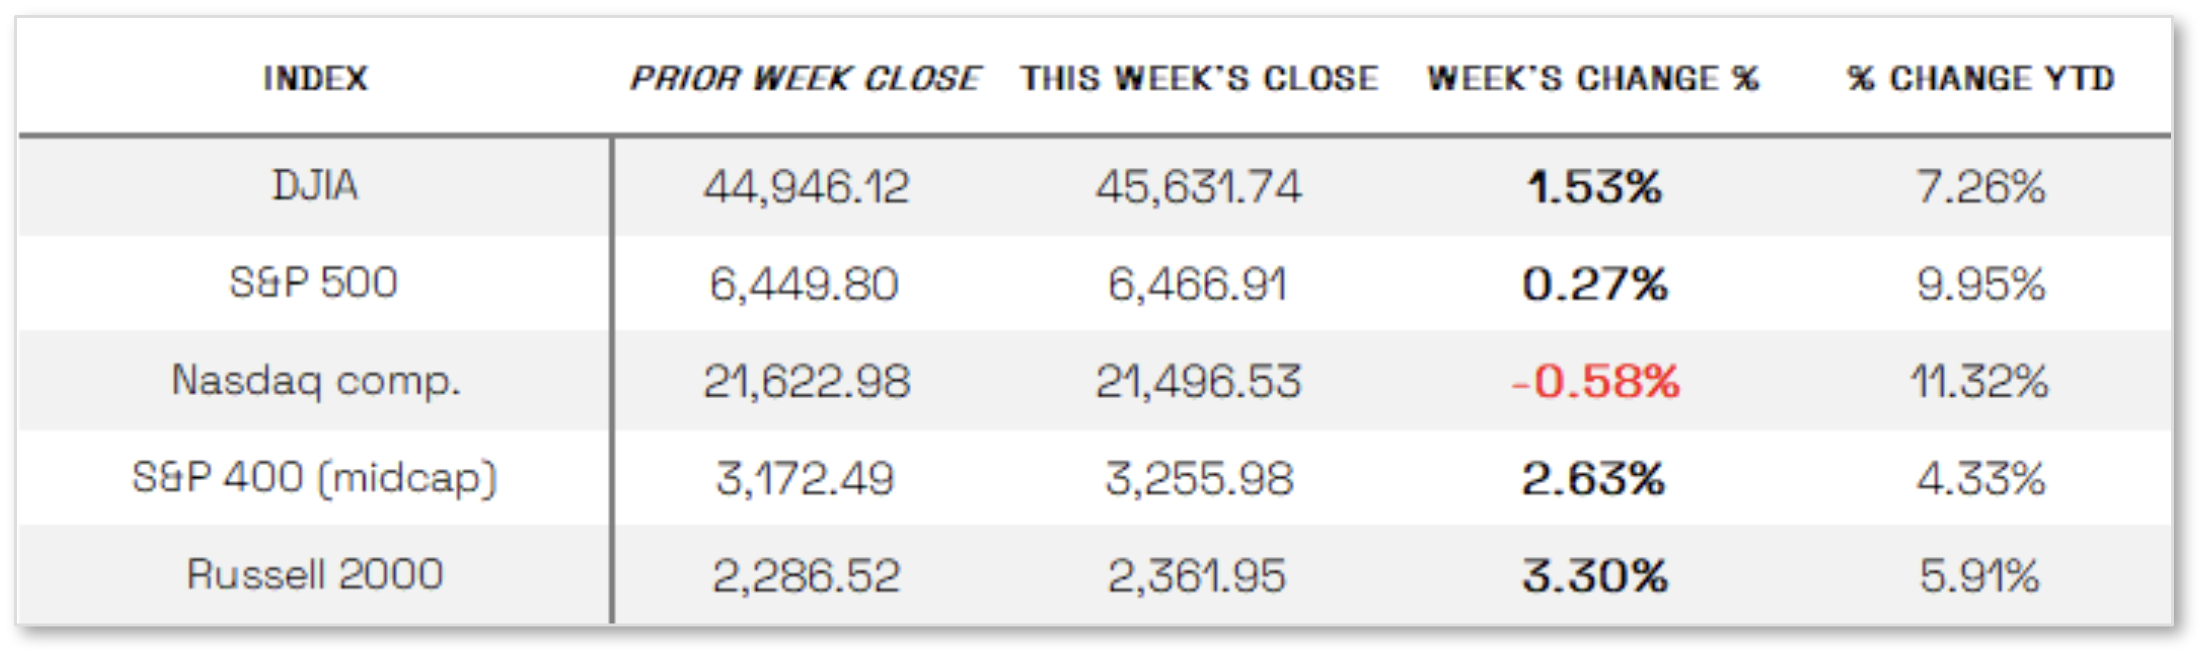
Possible rate cuts boost markets. The S&P 500 Index rallied on Friday to end modestly higher after four straight days of losses, lifted by Federal Reserve Chair Jerome Powell’s Jackson Hole remarks, which signaled potential rate cuts and boosted investor sentiment. Energy, real estate, financials, and materials led sector gains, while large-cap value stocks outperformed growth stocks. The S&P Mid-Cap 400 and Russell 2000 posted strong returns, but the tech-heavy Nasdaq Composite declined, reflecting profit-taking and renewed concerns over the sustainability of heavy AI-related infrastructure spending. Meanwhile, U.S. Treasuries were flat for most of the week before Powell’s comments sparked a bond rally, driving yields lower.
Looking at the US Indexes:
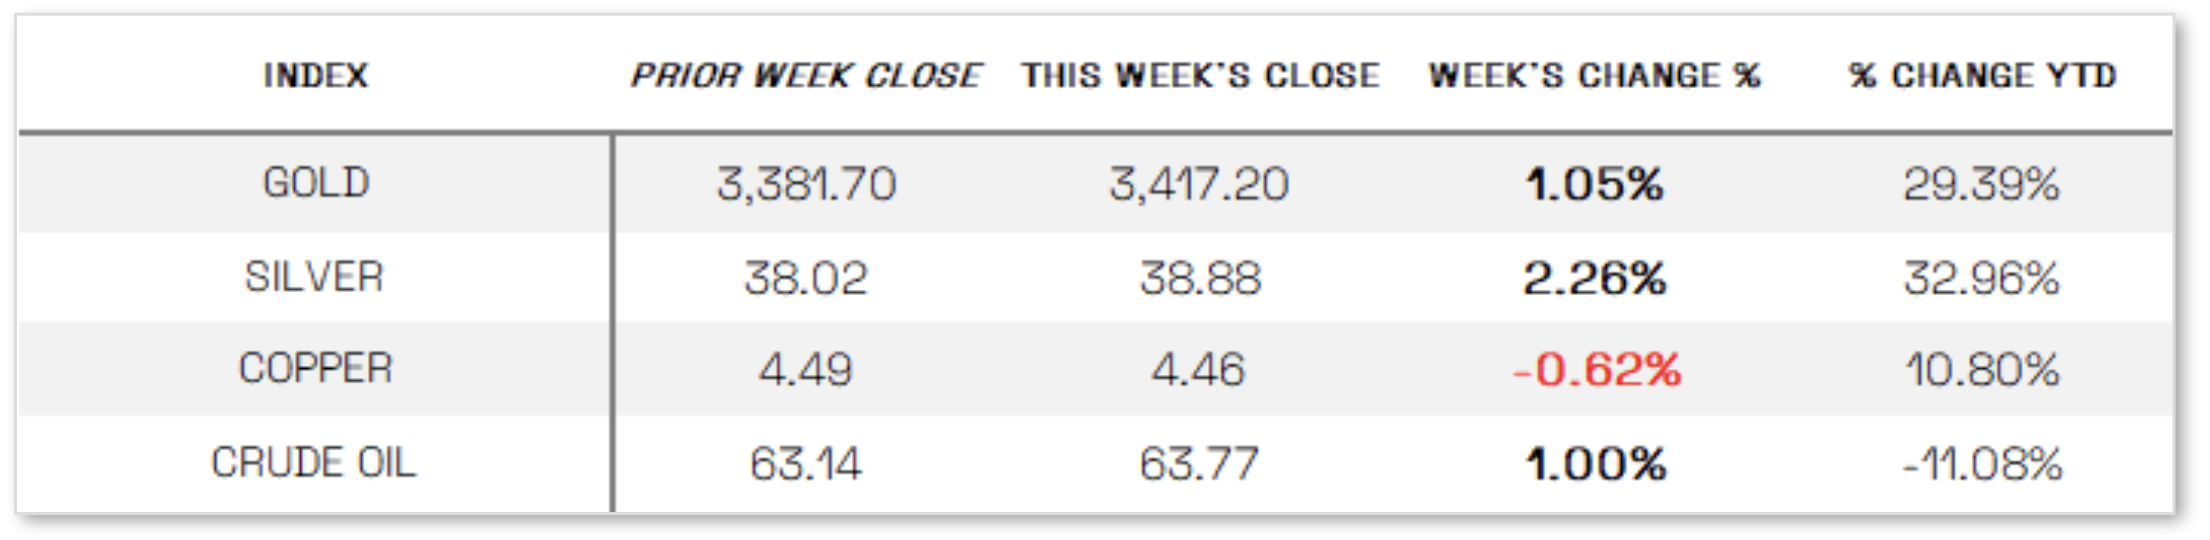
U.S. Commodities/Futures:
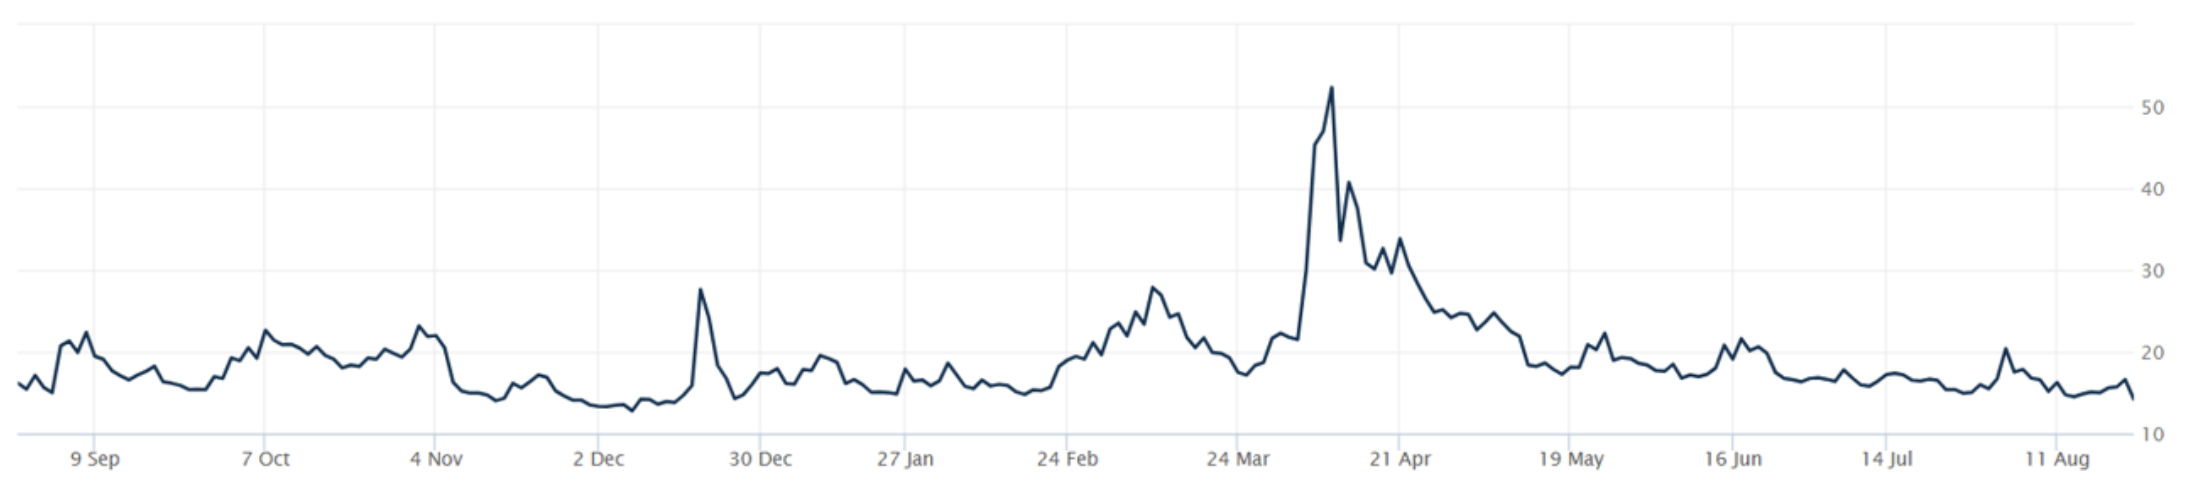
THE VOLATILITY INDEX (VIX) closed at 15.09 this week, a 0.4% decrease vs last week’s close of 15.09.
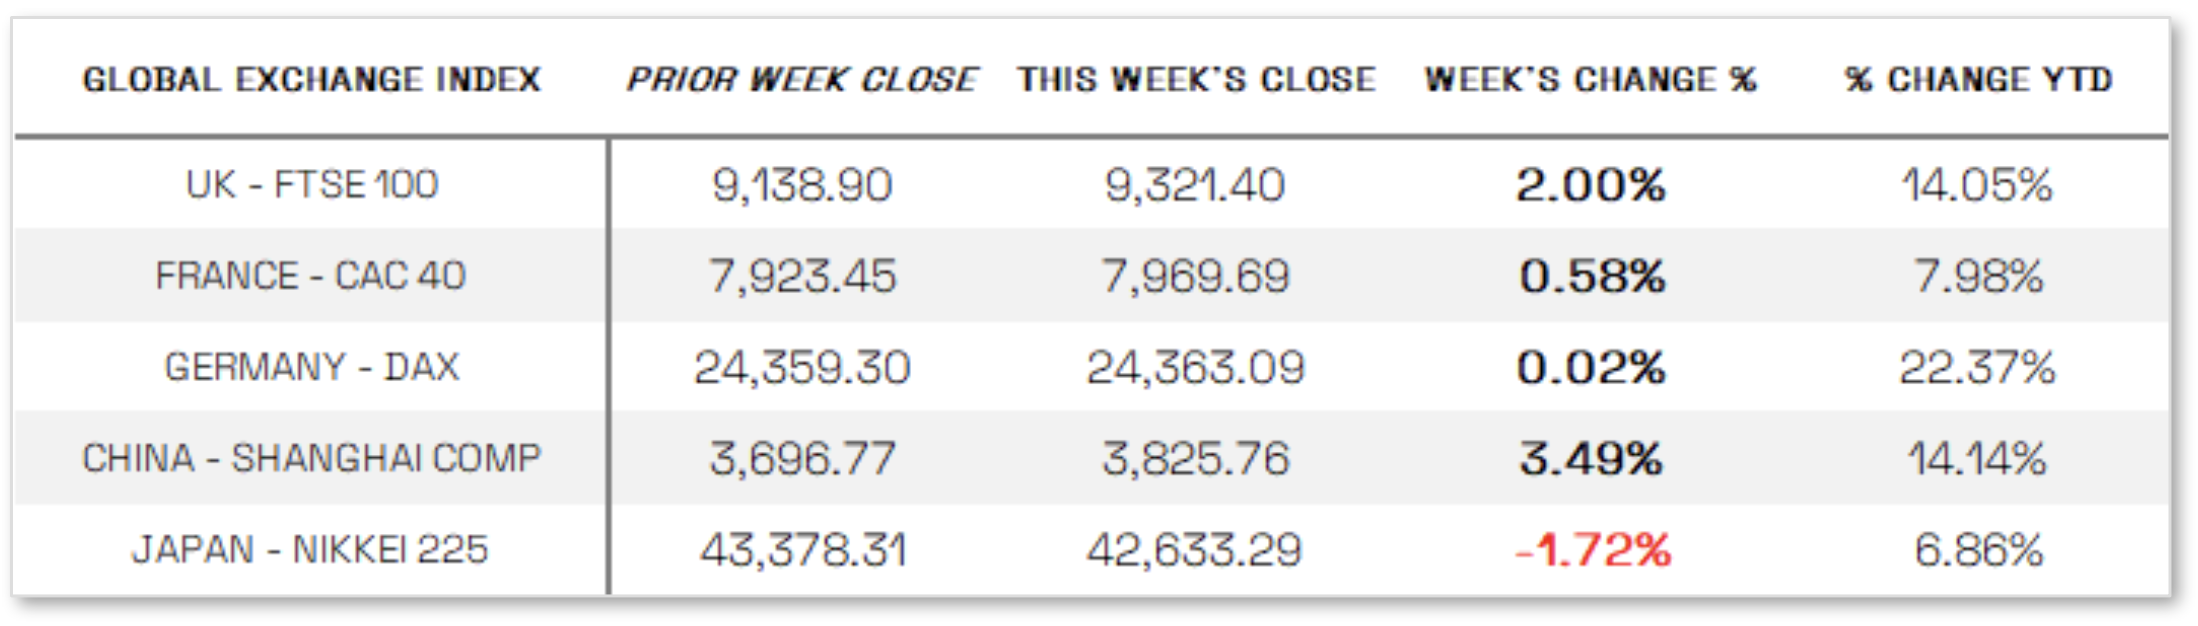
International Markets:
THIS WEEK’S ECONOMIC NEWS
U.S. Economic News:
Fed rate cut possible:
At the Jackson Hole conference, Fed Chair Jerome Powell acknowledged the challenges of balancing inflationary pressures with signs of labor market weakness but suggested that risks are shifting in a way that may justify a policy adjustment, noting that rates remain at restrictive levels and that falling immigration alongside weak labor demand could heighten downside risks to employment. Meanwhile, economic data showed surprising strength, as the S&P Global U.S. Composite PMI rose to 55.4 in August—its fastest pace this year and the 31st straight month above the 50 expansion threshold. While the services PMI eased slightly to 55.4 from July’s 55.7, manufacturing surged to a 39-month high of 53.3, beating expectations of contraction, with rising demand and inventory building in anticipation of supply shortages and higher costs, partly driven by tariffs, fueling the upside.
International Economic News:
EUROPE: The pan-European STOXX Europe 600 Index rose 1.40% in local currency terms on hopes of lower U.S. borrowing costs, with Italy’s FTSE MIB up 1.54%, France’s CAC 40 adding 0.58%, Germany’s DAX little changed, and the UK’s FTSE 100 hitting a record high with a 2.00% gain. Economic data showed eurozone business activity expanding for a third straight month in August, as the HCOB Flash Composite PMI rose to 51.1 from 50.9, driven by the fastest manufacturing growth in nearly three-and-a-half years, with Germany posting its third consecutive increase and France showing signs of stabilizing despite ongoing contraction. However, consumer confidence slipped, with the European Commission’s indicator falling to -15.5 from July’s four-month high of -14.7, remaining well below its long-term average.
JAPAN: Japan’s stock markets declined over the week, with the Nikkei 225 falling 1.72% and the TOPIX slipping 0.22%, as a global pullback in U.S. mega-cap technology stocks weighed on risk sentiment amid concerns over the sustainability of the AI-driven rally. Meanwhile, the 10-year Japanese government bond yield climbed to 1.61% from 1.56%, near its highest level since 2008, as hotter-than-expected inflation fueled expectations of a Bank of Japan rate hike, possibly as early as October. Core CPI rose 3.1% year over year in July, above forecasts of 3.0% but down from June’s 3.3%, and while inflation remains well above the BoJ’s 2% target, the central bank maintained that its accommodative stance is justified given underlying inflation trends.
CHINA: Mainland Chinese equities advanced for the week, with the CSI 300 Index jumping 4.18% to its highest level in a decade and the Shanghai Composite rising 3.49% in local currency terms, while Hong Kong’s Hang Seng Index edged up 0.27%, as signs of stabilizing U.S.-China trade relations bolstered risk appetite. The rally has been fueled largely by retail investors, with cash-rich households channeling funds into equities amid low interest rates and limited investment alternatives. Margin debt used to finance stock purchases climbed to its highest level since 2015 last week, standing only about 10% below its record peak, according to Bloomberg.
Sources:
>> All index and returns data from Norgate Data and Commodity Systems Incorporated and Wall Street Journal.
>> News from Reuters, Barron’s, Wall St. Journal, Bloomberg.com, ft.com, guggenheimpartners.com, zerohedge.com, ritholtz.com, markit.com, financialpost.com, Eurostat, Statistics Canada, Yahoo! Finance, stocksandnews.com, marketwatch.com, visualcapitalist.com, wantchinatimes.com, BBC, 361capital.com, pensionpartners.com, cnbc.com, FactSet, Morningstar/Ibbotson Associates, Corporate Finance Institute.
>> Commentary from T Rowe Price Global markets weekly update — https://www.troweprice.com/personal-investing/resources/insights/global-markets-weekly-update.html
Disclosures: This material and any mention of specific investments is provided for informational purposes only and is not intended to be investment advice or a recommendation to take any action. The forecasts or forward-looking statements are based on assumptions, may not materialize, and are subject to revision without notice. The market indexes discussed are unmanaged, and generally, considered representative of their respective markets. Index performance is not indicative of the past performance of a particular investment. Indexes do not incur management fees, costs, and expenses. Individuals cannot directly invest in unmanaged indexes. Past performance does not guarantee future results.
