


THE COMPLETE PICTURE
>> Four indicators across three time frames.
>> When all the Sherman Portfolios indicators are positive status, we read the market as being in a Positive Market.
1. DELTA-V — Positive since June 27, 2025
2. GALACTIC SHIELD — Positive since April 1, 2023
3. STARFLUX — Positive since May 12, 2025
4. STARPATH — Positive since August 15, 2025
The shorter term picture:
>> GALACTIC SHIELD — POSITIVE, for Q3 2025, This indicator is based on the combination of U.S. and International Equities trend statuses at the start of each quarter.
>> STARFLUX — POSITIVE, Starflux ended the week at 8.94 (down 5.30% last week). This short-term indicator measures U.S. Equities.
>> STARPATH — POSITIVE, This indicator measures the interplay on dual timeframes of our Type 1s + the Russell 3000 + our four most ‘pro-cyclical’ Type 3s, vs. Cash.
The big picture:
The ‘big picture’ is the (typically) years-long timeframe, the same timeframe in which Cyclical Bulls and Bears operate.
>> The Sherman Portfolios DELTA-V Indicator measuring the Bull/Bear cycle finished the week in a Bull status at 64.09, up 1.86% from the prior week’s 62.92. It has signaled Bull since June 27, 2025.
>> The Sherman Portfolios DELTA-V Bond Indicator measuring the Bull/Bear cycle finished the week in BULL status at 58.51, down 2.92% from the prior week’s 60.27. It has signaled Bull since December 15, 2023.
The very big picture (a historical perspective): The CAPE is now at 38.84.
The cyclically adjusted price-to-earnings ratio (CAPE) can be used to smooth out the shorter-term earnings swings to get a longer-term assessment of market valuation. An extremely high CAPE ratio means that a company’s stock price is substantially higher than the company’s earnings would indicate and, therefore, overvalued. It is generally expected that the market will eventually correct the company’s stock price by pushing it down to its true value.
In the past, the CAPE ratio has proved its importance in identifying potential bubbles and market crashes. The historical average of the ratio for the S&P 500 Index is between 15-16, while the highest levels of the ratio have exceeded 30. The record-high levels occurred three times in the history of the U.S. financial markets. The first was in 1929 before the Wall Street crash that signaled the start of the Great Depression. The second was in the late 1990s before the Dotcom Crash, and the third came in 2007 before the 2007-2008 Financial Crisis. https://www.multpl.com/shiller-pe
 Note: We do not use CAPE as an official input into our methods. However, we think history serves as a guide and that it’s good to know where we are on the historic continuum.
THIS WEEK IN THE MARKETS
U.S. Markets:
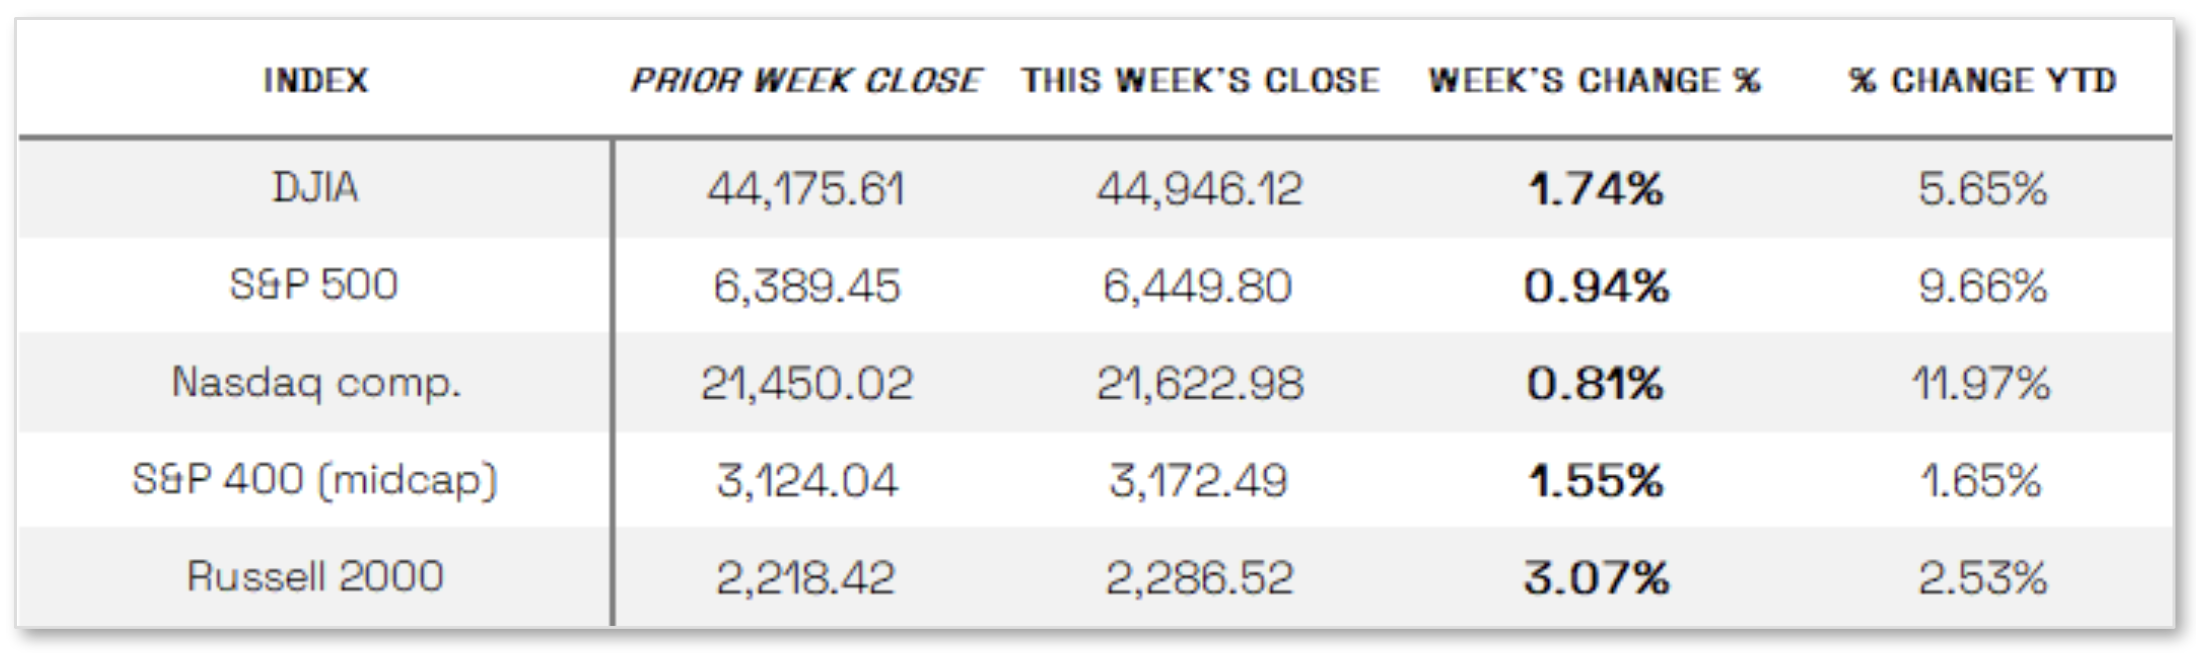
Stocks continue to new highs: U.S. stocks climbed to fresh all-time highs last week, fueled by encouraging economic data that strengthened expectations the Federal Reserve may cut short-term interest rates at its September meeting. Small-cap shares outperformed, with the Russell 2000 posting its widest margin over the S&P 500 since April, while the Dow Jones Industrial Average, S&P 500, and Nasdaq Composite also gained, the latter two reaching record levels midweek before easing slightly by Friday. Trade developments played a smaller role, though Monday’s announcement that the U.S. and China had extended the tariff deadline by 90 days provided additional support as broader negotiations continue.
Looking at the US Indexes:
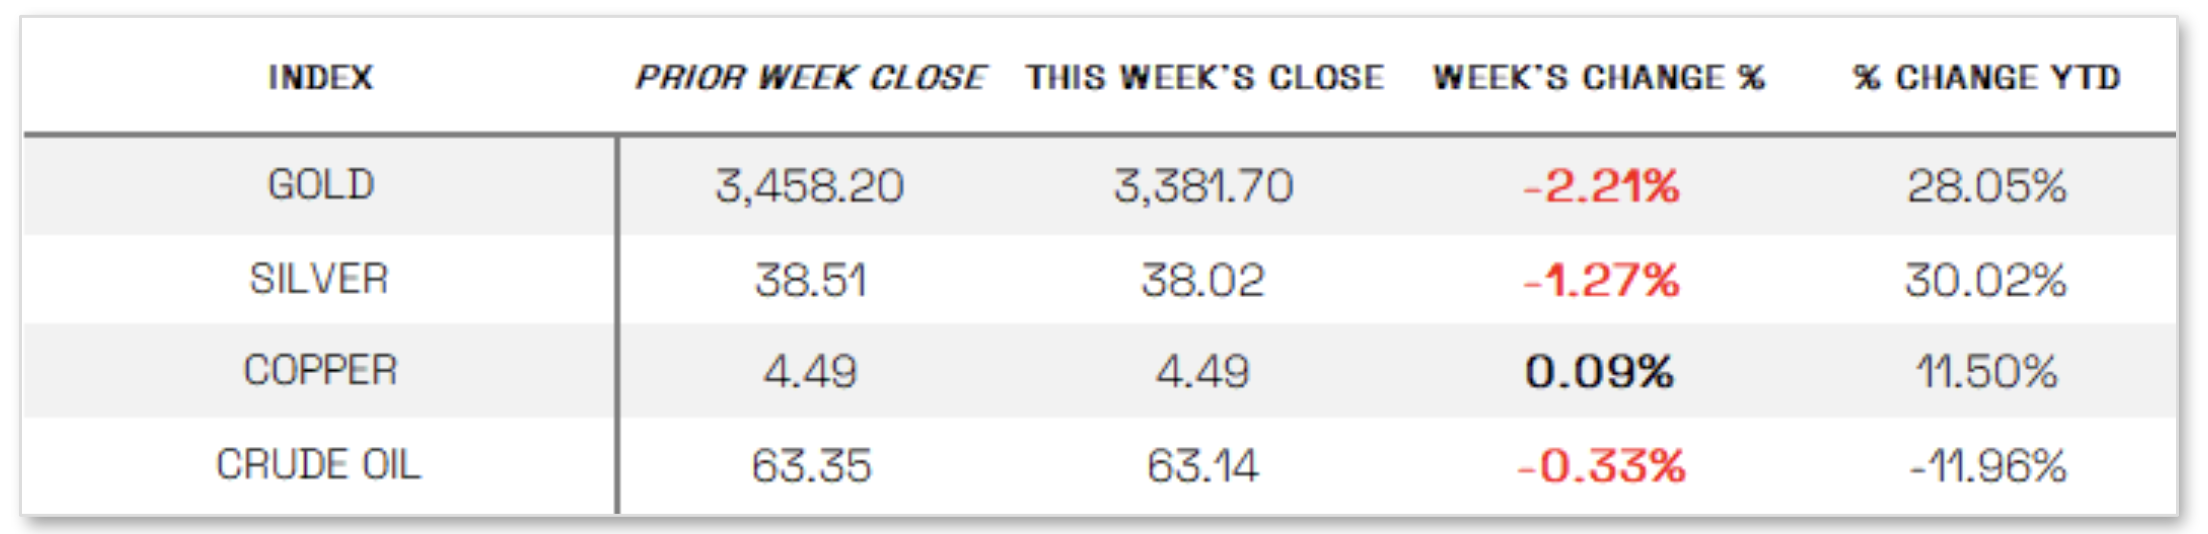
U.S. Commodities/Futures:
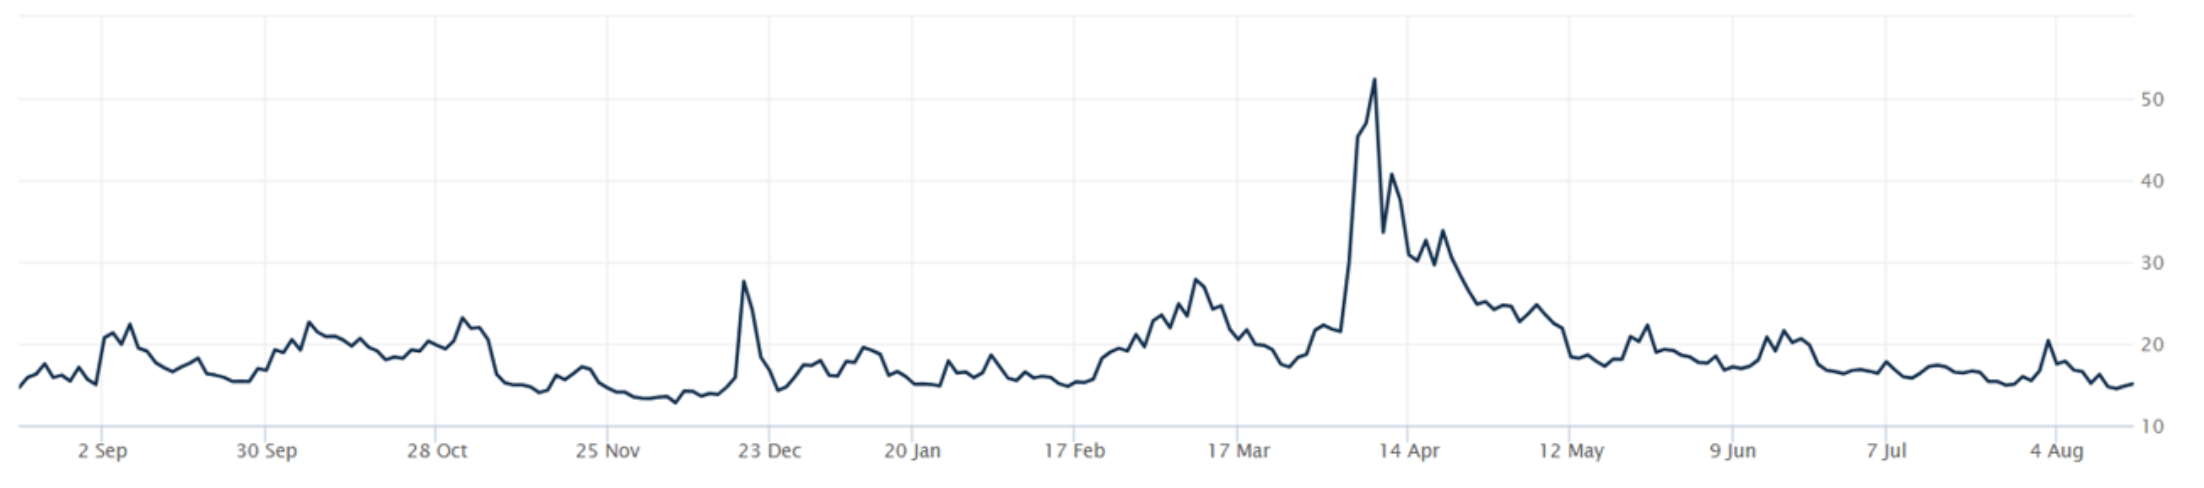
THE VOLATILITY INDEX (VIX) closed at 15.15 this week, a 25.7% decrease vs last week’s close of 20.38.
International Markets:
THIS WEEK’S ECONOMIC NEWS
U.S. Economic News:
Mixed Economic Data:
On Tuesday, the Bureau of Labor Statistics reported that July’s consumer price index showed headline inflation easing to 0.2% month over month, down from June’s 0.3%, thanks to declines in grocery and energy costs, while core inflation rose to 0.3%, lifting the annual rate to 3.1%, its highest since February, largely due to higher services costs. The data, which aligned with expectations, boosted stocks and strengthened bets on a September rate cut as investors welcomed the absence of a sharp, tariff-driven surge in prices. However, optimism faded later in the week when the producer price index reaccelerated in July, jumping 0.9% versus expectations of 0.2%, again led by services, which pressured markets early Thursday before indexes stabilized; the hotter wholesale inflation also tempered rate cut expectations, as reflected in the CME FedWatch tool.
International Economic News:
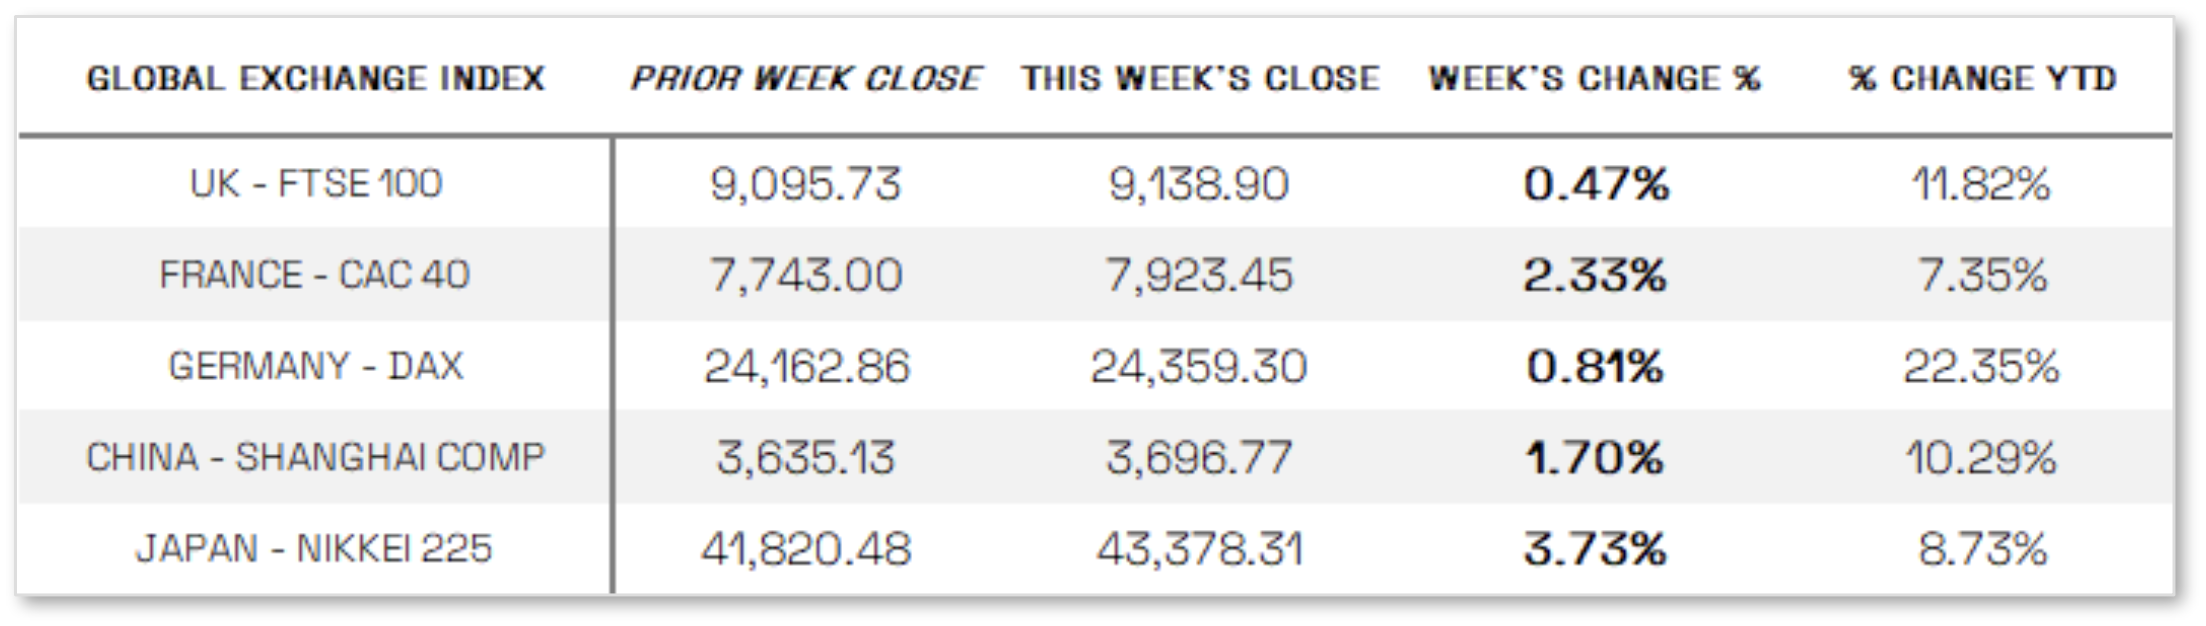
EUROPE: The pan-European STOXX Europe 600 Index gained 1.18% in local currency terms as easing trade tensions, optimism over a potential resolution to the Russia-Ukraine conflict, and hopes for U.S. interest rate cuts lifted sentiment, with France’s CAC 40 up 2.33%, Germany’s DAX up 0.81%, Italy’s FTSE MIB rising 2.47% despite a Friday closure, and the UK’s FTSE 100 advancing 0.47%. In the UK, GDP rebounded 0.4% in June after a 0.1% decline in May, driven by strong gains in services, industrial output, and construction, though second-quarter growth slowed to 0.3% from 0.7% in Q1 as businesses had front-loaded exports to the U.S. ahead of higher tariffs; even so, growth outpaced the Bank of England’s 0.1% forecast. Meanwhile, the labor market showed signs of softening at a slower pace, with payrolled employees falling by 8,000 in July after a smaller-than-expected 26,000 decline in June, unemployment steady at 4.7%—the highest since mid-2021—and wage growth easing to 4.6% year over year in the three months through June.
JAPAN: Japan’s stock markets posted strong gains during a holiday-shortened week, with the Nikkei 225 rising 3.73% and the TOPIX up 2.76%, both reaching record highs as better-than-expected second-quarter GDP growth, robust corporate earnings, and signs of easing U.S.-China trade tensions lifted sentiment. The yen strengthened to around JPY 146.9 per dollar from 147.7 the prior week, supported by comments from U.S. Treasury Secretary Scott Bessent suggesting the Bank of Japan is lagging in tightening policy, fueling speculation of a rate hike sooner than expected. While Governor Kazuo Ueda maintained a cautious stance, investors priced in the likelihood of higher rates late this year or early 2026, pushing the 10-year government bond yield up to 1.57% from 1.49%. Economic data reinforced this view, as GDP grew 1.0% quarter over quarter on an annualized basis—well above expectations of 0.4% and outpacing the prior quarter’s 0.6% growth—driven by a rebound in exports ahead of tariffs, resilient capital spending, and stronger-than-expected private consumption.
CHINA: Mainland Chinese equities advanced after the U.S. and China agreed to extend a tariff pause until November, with the CSI 300 up 2.37% and the Shanghai Composite rising 1.70% in local currency terms, while Hong Kong’s Hang Seng Index gained 1.65%, according to FactSet. Markets rallied early in the week as the 90-day extension delayed steep tariff hikes set for Tuesday and reinforced hopes that trade talks could stabilize relations and pave the way toward a broader deal. On the economic front, July consumer prices were flat year over year after June’s modest uptick ended a four-month decline, while producer prices fell 3.6% for a second month in a row, marking the 34th straight month of factory deflation and the lowest level since July 2023.
Sources:
>> All index and returns data from Norgate Data and Commodity Systems Incorporated and Wall Street Journal.
>> News from Reuters, Barron’s, Wall St. Journal, Bloomberg.com, ft.com, guggenheimpartners.com, zerohedge.com, ritholtz.com, markit.com, financialpost.com, Eurostat, Statistics Canada, Yahoo! Finance, stocksandnews.com, marketwatch.com, visualcapitalist.com, wantchinatimes.com, BBC, 361capital.com, pensionpartners.com, cnbc.com, FactSet, Morningstar/Ibbotson Associates, Corporate Finance Institute.
>> Commentary from T Rowe Price Global markets weekly update — https://www.troweprice.com/personal-investing/resources/insights/global-markets-weekly-update.html
Disclosures: This material and any mention of specific investments is provided for informational purposes only and is not intended to be investment advice or a recommendation to take any action. The forecasts or forward-looking statements are based on assumptions, may not materialize, and are subject to revision without notice. The market indexes discussed are unmanaged, and generally, considered representative of their respective markets. Index performance is not indicative of the past performance of a particular investment. Indexes do not incur management fees, costs, and expenses. Individuals cannot directly invest in unmanaged indexes. Past performance does not guarantee future results.
