


THE COMPLETE PICTURE
>> Four indicators across three time frames.
>> When the Sherman Portfolios indicators are mixed status, we read the market as being in a Mixed Market.
1. DELTA-V — Positive since June 27, 2025
2. GALACTIC SHIELD — Positive since April 1, 2023
3. STARFLUX — Positive since May 12, 2025
4. STARPATH — Negative since August 1, 2025
The shorter term picture:
>> GALACTIC SHIELD — POSITIVE, for Q3 2025, This indicator is based on the combination of U.S. and International Equities trend statuses at the start of each quarter.
>> STARFLUX — POSITIVE, Starflux ended the week at 9.44 (up 37.41% last week) This short-term indicator measures U.S. Equities.
>> STARPATH — NEGATIVE, This indicator measures the interplay on dual timeframes of our Type 1s + the Russell 3000 + our four most ‘pro-cyclical’ Type 3s, vs. Cash.
The big picture:
The ‘big picture’ is the (typically) years-long timeframe, the same timeframe in which Cyclical Bulls and Bears operate.
>> The Sherman Portfolios DELTA-V Indicator measuring the Bull/Bear cycle finished the week in a Bull status at 62.92, up 0.80% from the prior week’s 62.42. It has signaled Bull since June 27, 2025.
>> The Sherman Portfolios DELTA-V Bond Indicator measuring the Bull/Bear cycle finished the week in BULL status at 60.27, up 5.07% from the prior week’s 57.79. It has signaled Bull since December 15, 2023.
The very big picture (a historical perspective): The CAPE is now at 38.45.
The cyclically adjusted price-to-earnings ratio (CAPE) can be used to smooth out the shorter-term earnings swings to get a longer-term assessment of market valuation. An extremely high CAPE ratio means that a company’s stock price is substantially higher than the company’s earnings would indicate and, therefore, overvalued. It is generally expected that the market will eventually correct the company’s stock price by pushing it down to its true value.
In the past, the CAPE ratio has proved its importance in identifying potential bubbles and market crashes. The historical average of the ratio for the S&P 500 Index is between 15-16, while the highest levels of the ratio have exceeded 30. The record-high levels occurred three times in the history of the U.S. financial markets. The first was in 1929 before the Wall Street crash that signaled the start of the Great Depression. The second was in the late 1990s before the Dotcom Crash, and the third came in 2007 before the 2007-2008 Financial Crisis. https://www.multpl.com/shiller-pe
 Note: We do not use CAPE as an official input into our methods. However, we think history serves as a guide and that it’s good to know where we are on the historic continuum.
THIS WEEK IN THE MARKETS
U.S. Markets:
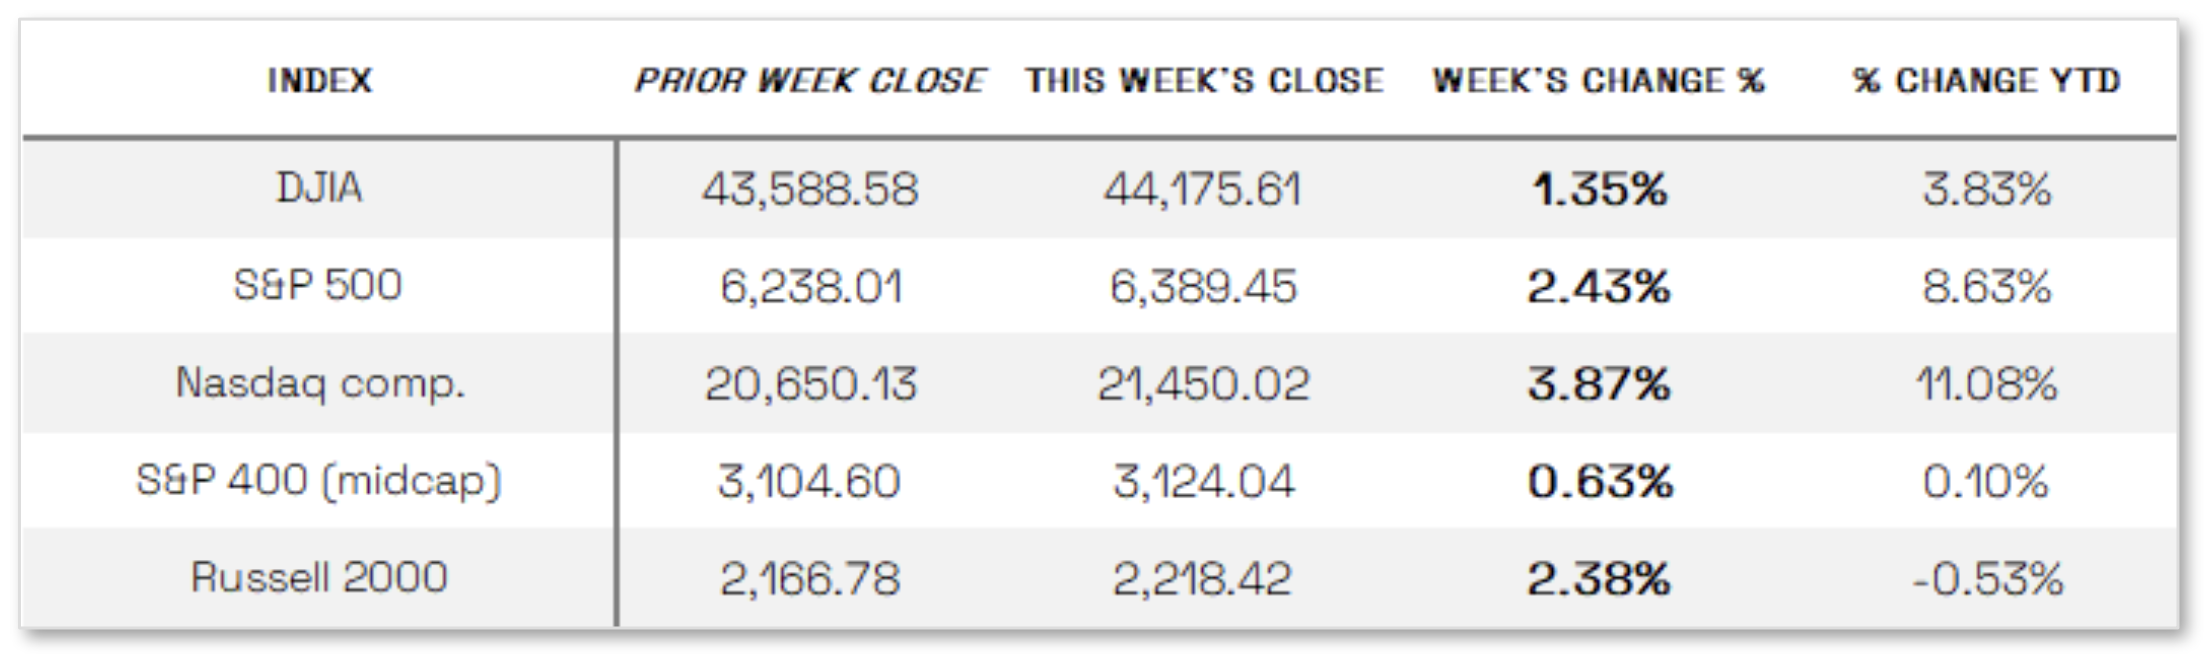
Nasdaq continues to new highs: U.S. equity indexes rose for the week, recovering from the prior week’s sell-off, with the technology-heavy Nasdaq Composite leading the gains and closing at a fresh all-time high, followed by the S&P 500 and Russell 2000, while the S&P MidCap 400 lagged but still advanced 0.63%. Market sentiment was buoyed by several company-specific developments, most notably Apple’s announcement of a USD 100 billion investment—on top of a previously pledged USD 500 billion—into U.S.-based manufacturing over the next four years, a move expected to exempt it from steep semiconductor tariffs imposed by the Trump administration; Apple’s shares surged 13.33% for the week, lifting broader indexes. On the trade front, a new round of global tariffs from the Trump administration took effect Thursday, though market reaction was more subdued as several major U.S. trading partners had already struck agreements ahead of the deadline, while other tariff headlines included Trump’s decision to double tariffs on Indian goods to 50% in response to India’s purchase of Russian oil, and the breakdown of U.S. negotiations with Switzerland, leaving tariffs on Swiss imports at 39%.
Looking at the US Indexes:
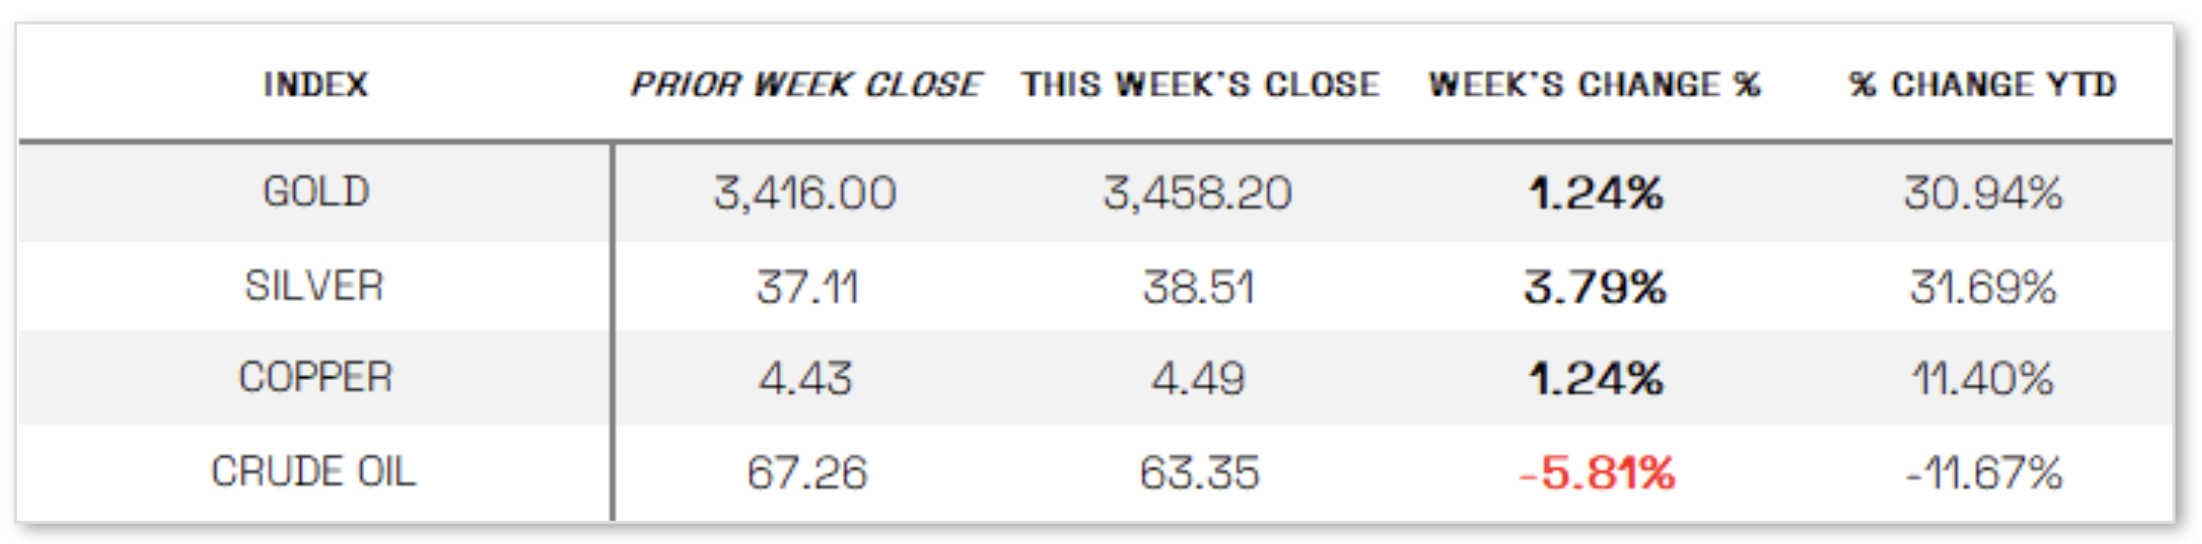
U.S. Commodities/Futures:
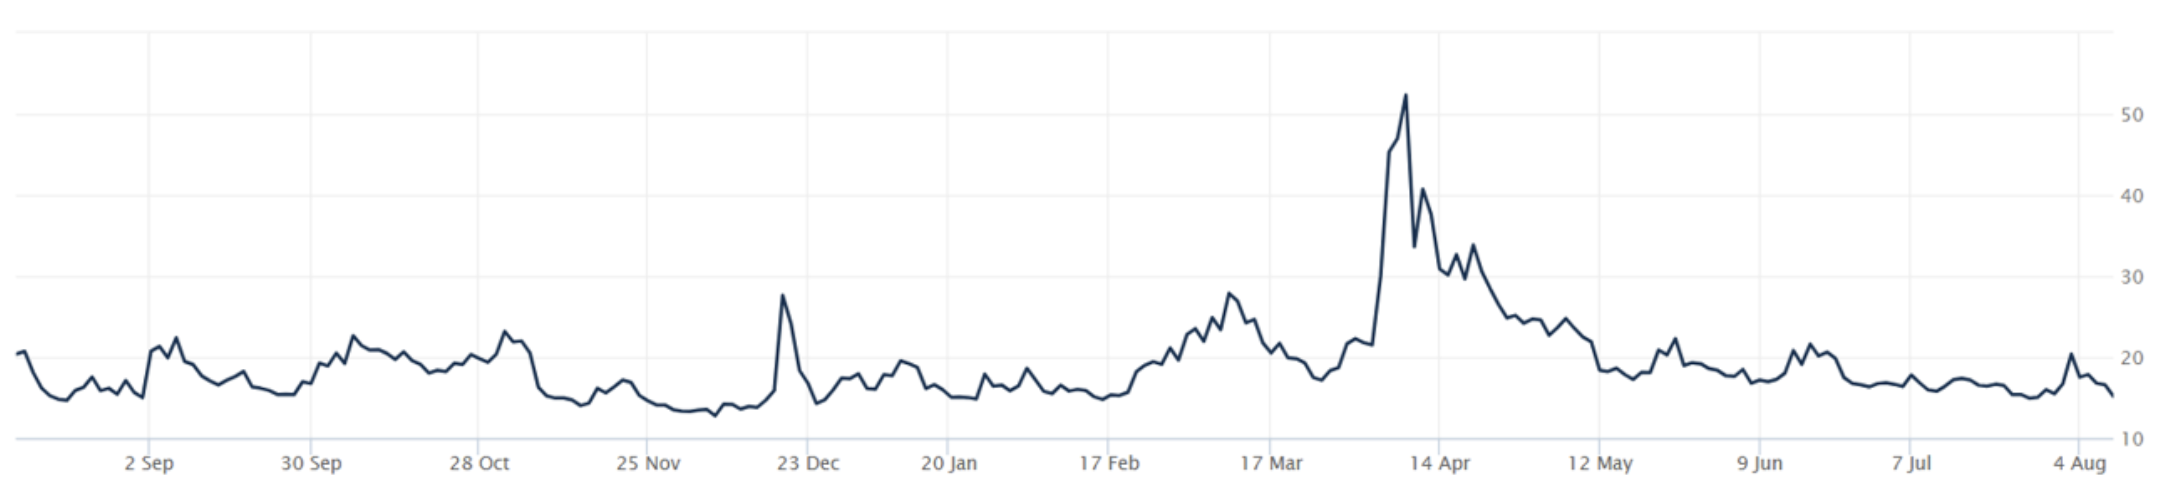
THE VOLATILITY INDEX (VIX) closed at 15.15 this week, a 25.7% decrease vs last week’s close of 20.38.
International Markets:
THIS WEEK’S ECONOMIC NEWS
U.S. Economic News:
Increasing probability of September rate cut:
Markets focused on the growing likelihood of a Federal Reserve interest rate cut in September, as several Fed officials signaled potential easing, including San Francisco Fed President Mary Daly, who noted that policy adjustments may be needed in the coming months if the labor market weakens further and inflation stays subdued. The odds of a cut rose to about 90% by Friday, according to the CME FedWatch tool, following President Trump’s nomination of White House Council of Economic Advisors Chair Stephen Miran to temporarily fill a vacancy on the Fed’s Board of Governors—a move some viewed as favoring looser policy. Economic data painted a mixed picture: the Institute for Supply Management’s services PMI fell 0.7 points to 50.1% in July, below expectations and barely above the growth threshold, with new orders and employment both declining and employment contracting for the second straight month, while the prices index surged to 69.9%, its highest since October 2022. Meanwhile, initial jobless claims rose to 226,000 for the week ended August 2, and continuing claims climbed 38,000 to 1.97 million, marking their highest level since November 2021.
International Economic News:
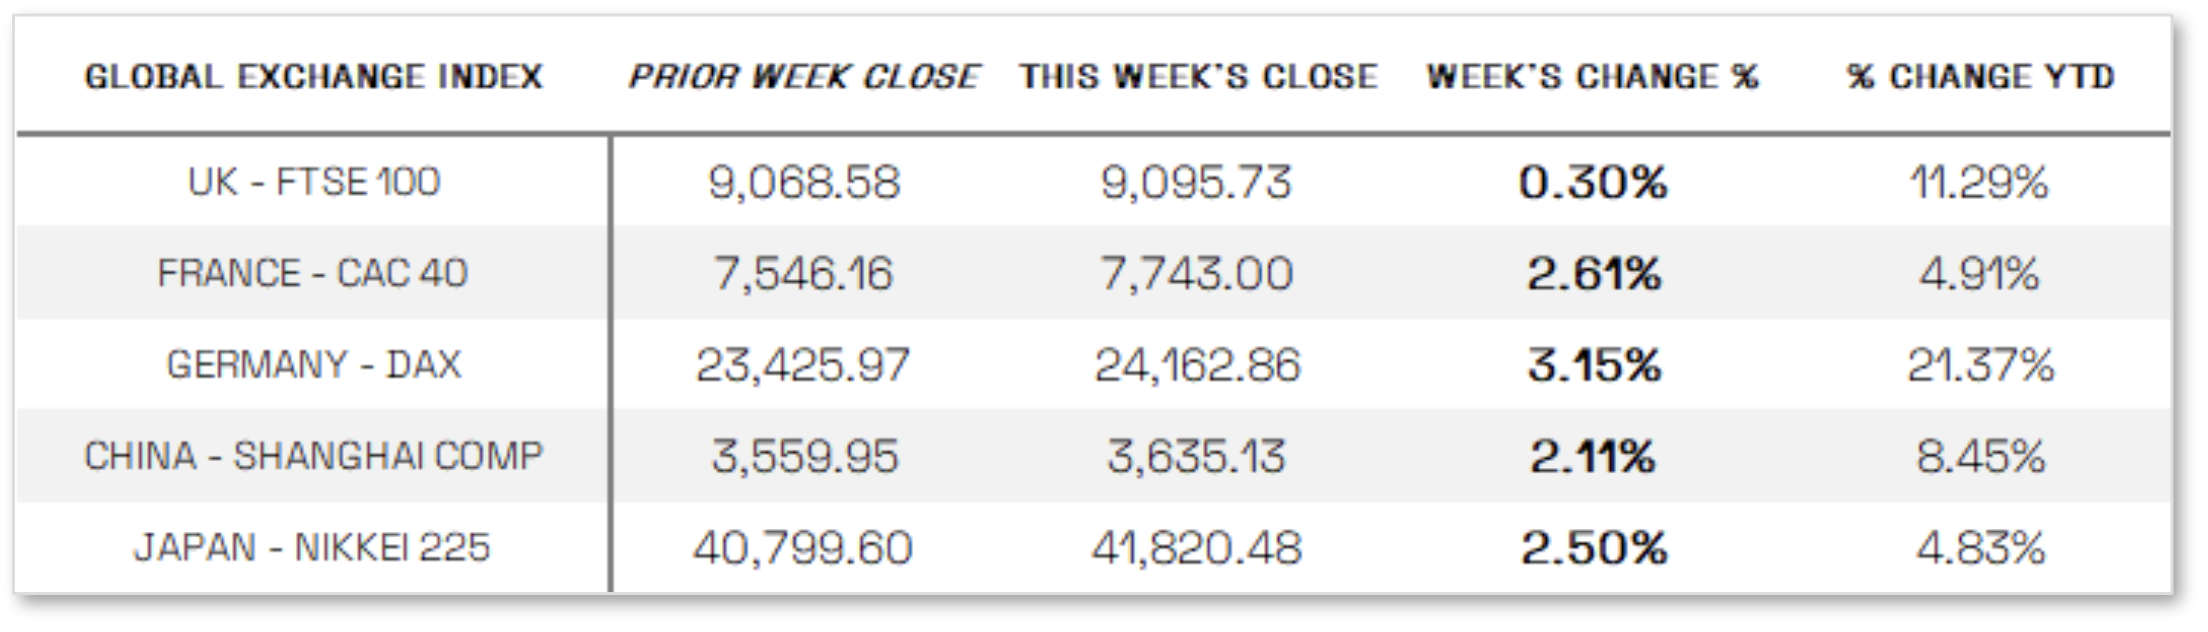
EUROPE: In local currency terms, the pan-European STOXX Europe 600 Index rose 2.11% on the back of strong corporate earnings and optimism over a potential resolution to the Ukraine-Russia conflict, with major indexes also advancing: Italy’s FTSE MIB surged 4.21%, Germany’s DAX gained 3.15%, France’s CAC 40 added 2.61%, and the UK’s FTSE 100 edged up 0.30%. The Bank of England, citing concerns about a weakening labor market, cut its key interest rate by a quarter point to 4% in a rare two-round vote, with the Monetary Policy Committee narrowly approving the move 5–4; Governor Andrew Bailey described the decision as “finely balanced” and stressed that further cuts would be gradual and cautious. The BoE projected inflation to rise to a two-year high of 4% in September from 3.6% in August, warning of heightened price pressures in the years ahead, and acknowledged it has missed its 2% target since last summer.
JAPAN: Japan’s stock markets advanced over the week, with the Nikkei 225 Index rising 2.50% and the broader TOPIX Index up 2.56%, driven by investor optimism over strong corporate earnings, while the yen traded in the JPY 147 range against the U.S. dollar. Trade sentiment improved after early concerns about differing interpretations of the July U.S.-Japan trade agreement were eased when the U.S. clarified that its new 15% tariff on Japanese exports would not be added to existing levies and that auto tariffs would be reduced to 15% from 27.5%. The yield on the 10-year Japanese government bond fell to 1.49% from 1.55% as the Bank of Japan’s July policy meeting summary revealed differing views among board members on the timing of future rate hikes: one suggested waiting two to three months to gauge tariff impacts before potentially shifting policy as early as year-end if conditions proved favorable, while another urged caution, citing expectations of moderating growth and sluggish inflation that support maintaining accommodative policy.
CHINA: Mainland Chinese stocks gained for the week, supported by trade data highlighting resilient global demand for Chinese goods despite the U.S.-driven trade war, with the onshore CSI 300 Index up 1.23% and the Shanghai Composite Index rising 2.11% in local currency terms, according to FactSet, while Hong Kong’s Hang Seng Index advanced 1.43%. July exports jumped 7.2% year over year to USD 322 billion—well above expectations—driven by stronger shipments to Europe, Southeast Asia, Australia, and other markets, which offset a steep 22% drop in U.S.-bound exports following a 16.1% decline in June. Analysts noted that Chinese companies have been able to replace lost U.S. business with sales to other regions, while a weaker yuan in July, which fell against the U.S. dollar and other major currencies, further supported export growth.
Sources:
>> All index and returns data from Norgate Data and Commodity Systems Incorporated and Wall Street Journal.
>> News from Reuters, Barron’s, Wall St. Journal, Bloomberg.com, ft.com, guggenheimpartners.com, zerohedge.com, ritholtz.com, markit.com, financialpost.com, Eurostat, Statistics Canada, Yahoo! Finance, stocksandnews.com, marketwatch.com, visualcapitalist.com, wantchinatimes.com, BBC, 361capital.com, pensionpartners.com, cnbc.com, FactSet, Morningstar/Ibbotson Associates, Corporate Finance Institute.
>> Commentary from T Rowe Price Global markets weekly update — https://www.troweprice.com/personal-investing/resources/insights/global-markets-weekly-update.html
Disclosures: This material and any mention of specific investments is provided for informational purposes only and is not intended to be investment advice or a recommendation to take any action. The forecasts or forward-looking statements are based on assumptions, may not materialize, and are subject to revision without notice. The market indexes discussed are unmanaged, and generally, considered representative of their respective markets. Index performance is not indicative of the past performance of a particular investment. Indexes do not incur management fees, costs, and expenses. Individuals cannot directly invest in unmanaged indexes. Past performance does not guarantee future results.
