


THE COMPLETE PICTURE
>> Four indicators across three time frames.
>> When the Sherman Portfolios indicators are positive status, we read the market as being in a Bull Market.
1. DELTA-V — Positive since June 27, 2025
2. GALACTIC SHIELD — Positive since April 1, 2023
3. STARFLUX — Positive since May 12, 2025
4. STARPATH — Positive since May 14, 2025
The shorter term picture:
>> GALACTIC SHIELD — POSITIVE, for Q3 2025, This indicator is based on the combination of U.S. and International Equities trend statuses at the start of each quarter.
>> STARFLUX — POSITIVE, Starflux ended the week at 9.84 (Down 3.72% last week). This short-term indicator measures U.S. Equities.
>> STARPATH — POSITIVE, This indicator measures the interplay on dual timeframes of our Type 1s + the Russell 3000 + our four most ‘pro-cyclical’ Type 3s, vs. Cash.
The big picture:
The ‘big picture’ is the (typically) years-long timeframe, the same timeframe in which Cyclical Bulls and Bears operate.
>> The Sherman Portfolios DELTA-V Indicator measuring the Bull/Bear cycle finished the week in a Bull status at 64.59, up 3.48% from the prior week’s 62.42. It has signaled Bull since June 27, 2025.
>> The Sherman Portfolios DELTA-V Bond Indicator measuring the Bull/Bear cycle finished the week in BULL status at 55.43, up 1.45% from the prior week’s 54.64. It has signaled Bull since December 15, 2023.
The very big picture (a historical perspective): The CAPE is now at 38.97.
The cyclically adjusted price-to-earnings ratio (CAPE) can be used to smooth out the shorter-term earnings swings to get a longer-term assessment of market valuation. An extremely high CAPE ratio means that a company’s stock price is substantially higher than the company’s earnings would indicate and, therefore, overvalued. It is generally expected that the market will eventually correct the company’s stock price by pushing it down to its true value.
In the past, the CAPE ratio has proved its importance in identifying potential bubbles and market crashes. The historical average of the ratio for the S&P 500 Index is between 15-16, while the highest levels of the ratio have exceeded 30. The record-high levels occurred three times in the history of the U.S. financial markets. The first was in 1929 before the Wall Street crash that signaled the start of the Great Depression. The second was in the late 1990s before the Dotcom Crash, and the third came in 2007 before the 2007-2008 Financial Crisis. https://www.multpl.com/shiller-pe
 Note: We do not use CAPE as an official input into our methods. However, we think history serves as a guide and that it’s good to know where we are on the historic continuum.
THIS WEEK IN THE MARKETS
U.S. Markets:
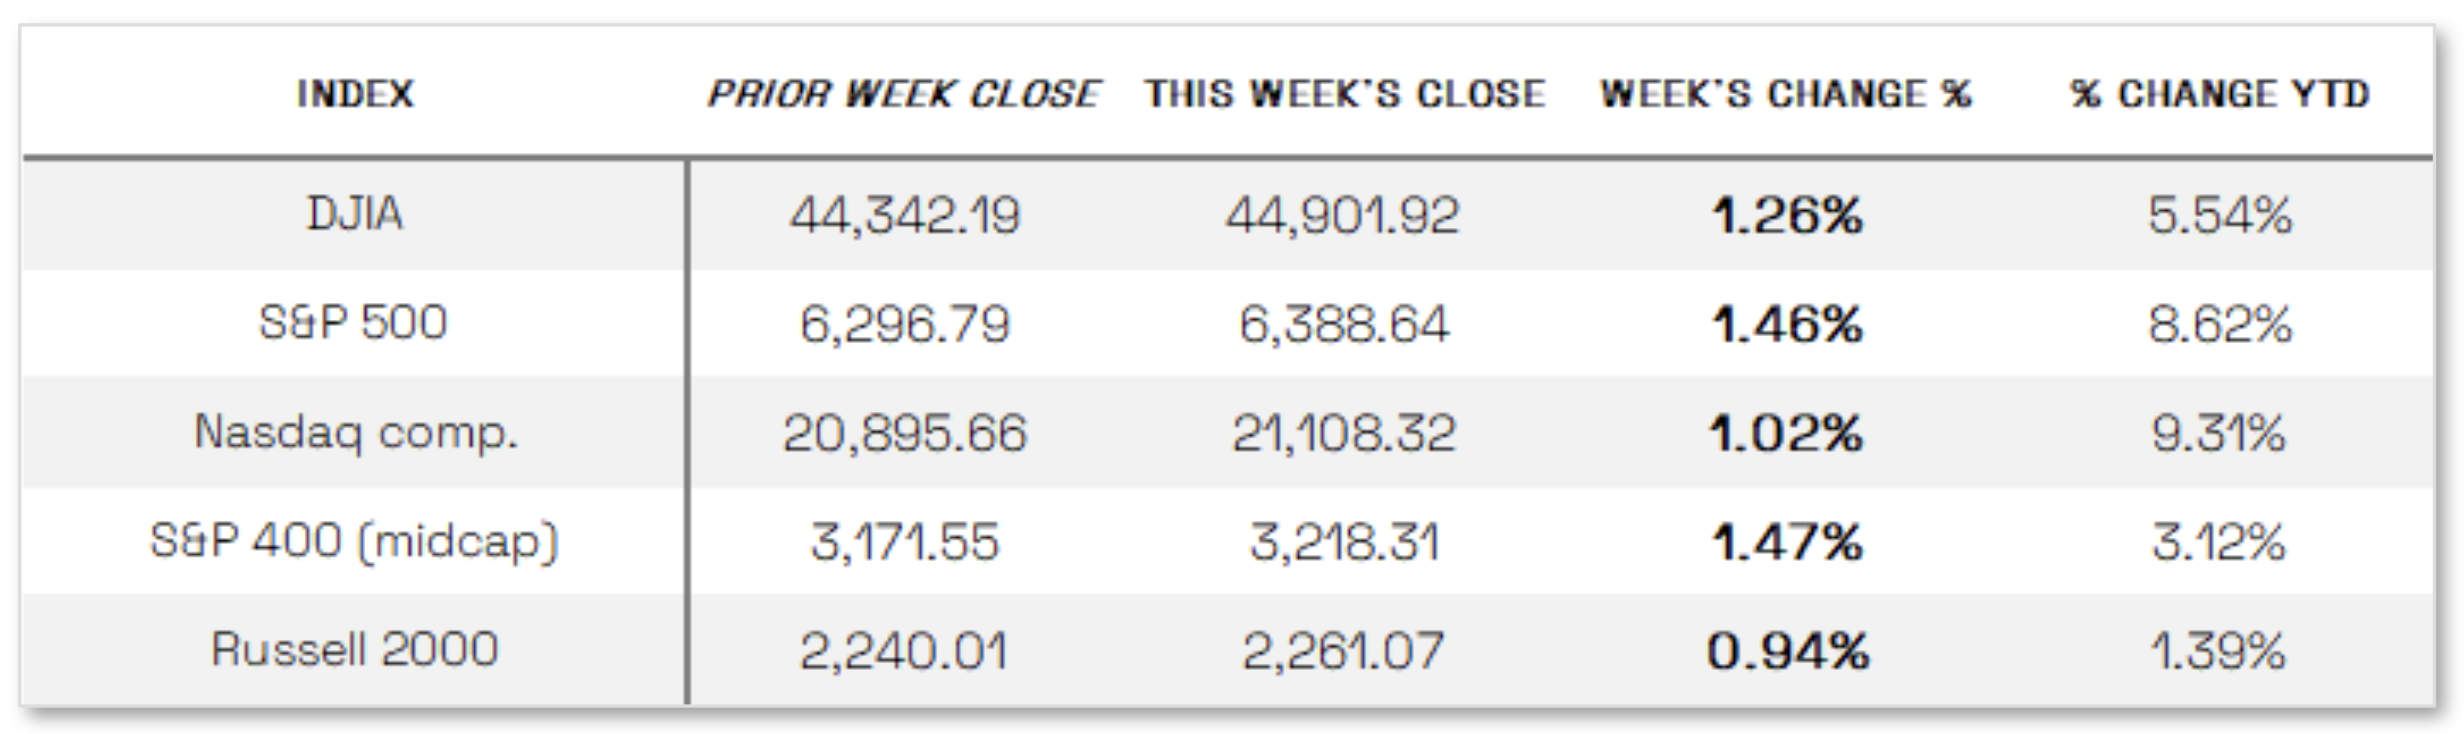
Stocks up over trade deals: Favorable news on trade deals propelled stocks to record highs for the second consecutive week, with the S&P 500 Index and Nasdaq Composite setting new records and the Dow Jones Industrial Average rising 1.26%, while the S&P MidCap 400 and Russell 2000 each gained over 0.9%. Value stocks generally outperformed growth stocks, though the gap narrowed by Friday. Investor sentiment was bolstered by announcements of new U.S. trade agreements with Japan, Indonesia, and the Philippines, as well as reports of progress toward a U.S.-EU trade deal ahead of the August 1 deadline for potential 30% tariffs on European goods. Corporate earnings also influenced markets, with Alphabet surging 4.38% after beating estimates and offering positive commentary on artificial intelligence, which lifted other AI-linked stocks, while Tesla fell 4.12% for the week after its results disappointed relative to expectations.
Looking at the US Indexes:
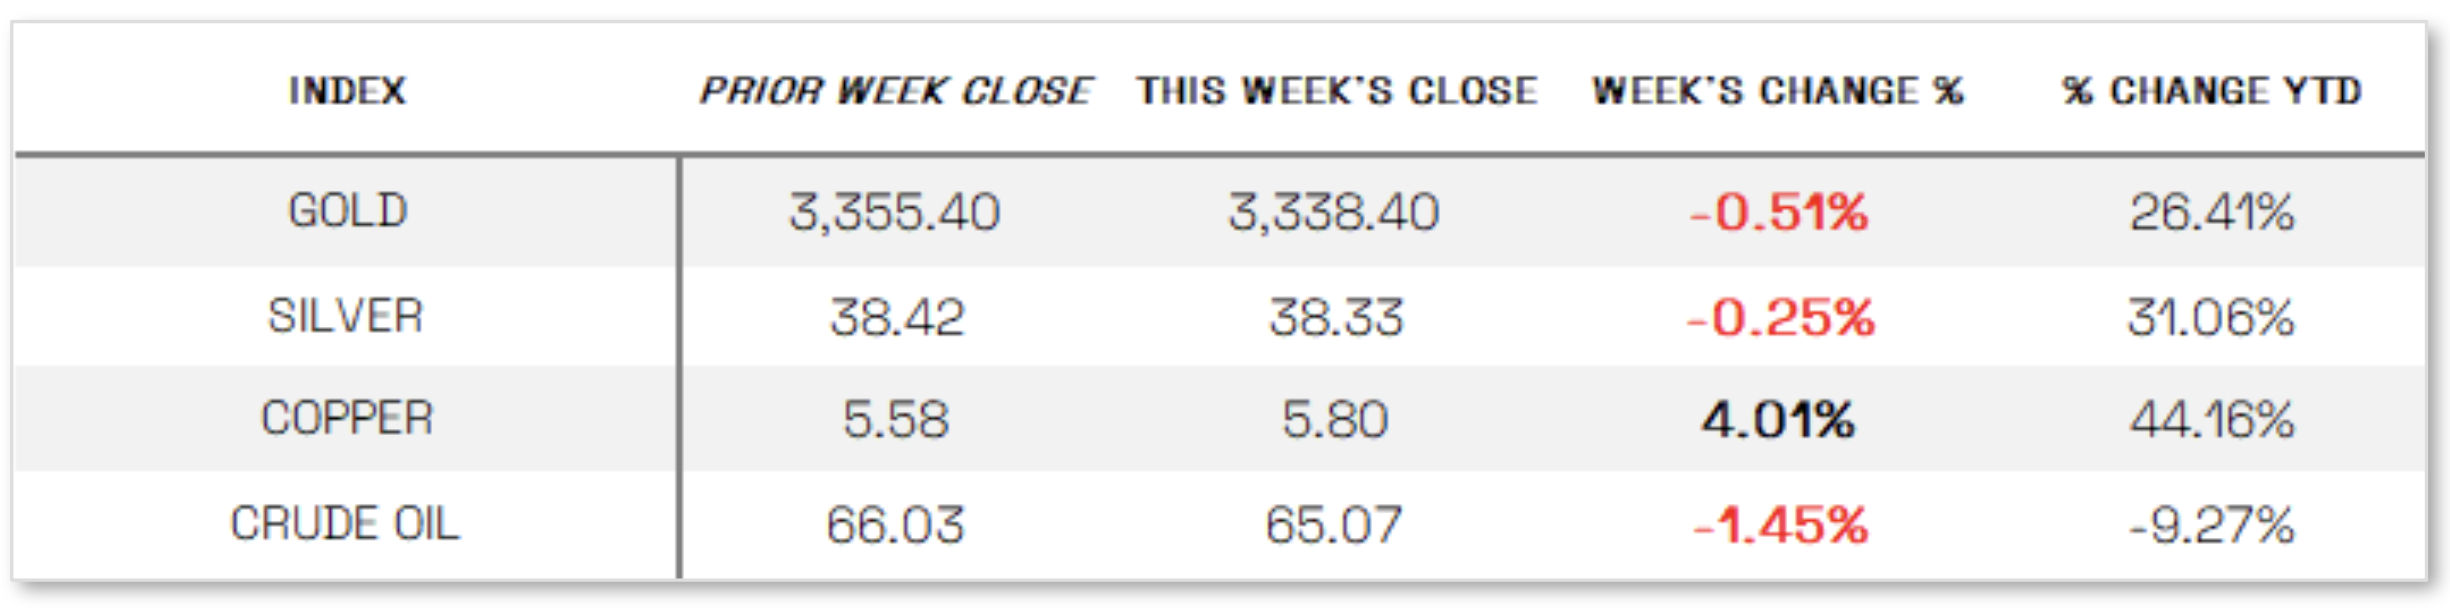
U.S. Commodities/Futures:
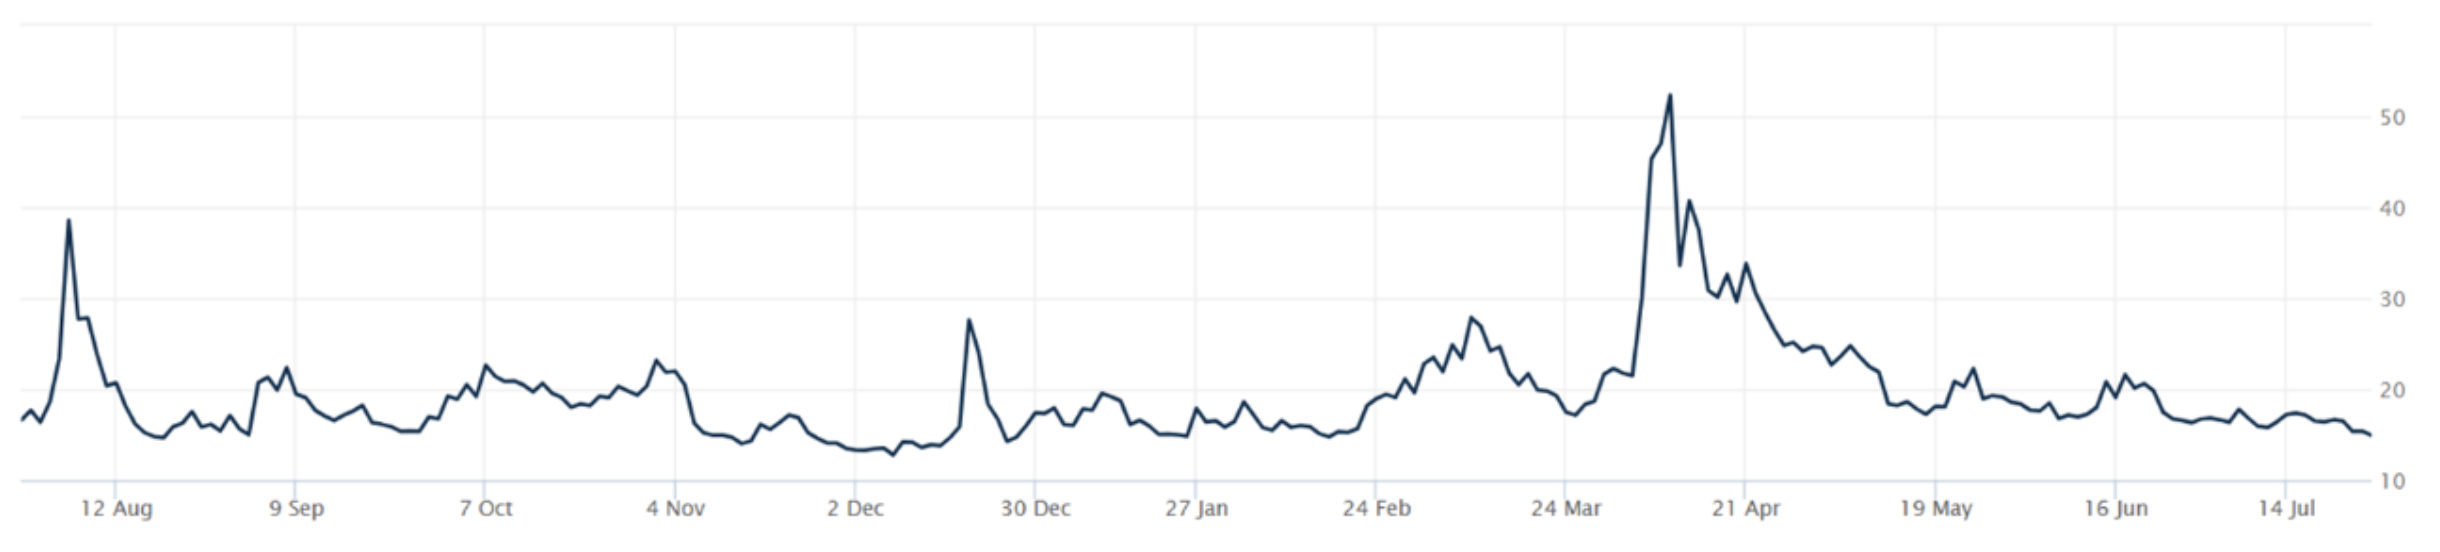
THE VOLATILITY INDEX (VIX) closed at 14.93 this week, a 9.0% decrease vs last week’s close of 16.41.
International Markets:
THIS WEEK’S ECONOMIC NEWS
U.S. Economic News:
PMI up, home sales down:
In a light week for economic data, S&P Global’s flash Purchasing Managers’ Index (PMI) report for July highlighted accelerating U.S. business activity, with the composite PMI rising 1.7 points to a seven-month high of 54.6, signaling expansion. Growth was driven entirely by the services sector, as the services PMI climbed to 55.2 from 52.9 in June, while the manufacturing PMI fell to 49.5—its lowest since December—indicating contraction. Chris Williamson, chief business economist at S&P Global Market Intelligence, cautioned that the strong start to the third quarter may not be sustainable given the uneven growth and declining manufacturing activity. Meanwhile, the housing market remained sluggish as elevated mortgage rates continued to weigh on sales; existing home sales fell 2.7% in June to an annual rate of 3.93 million, while the median sales price of existing homes hit a record USD 435,300, driven by years of limited supply.
International Economic News:
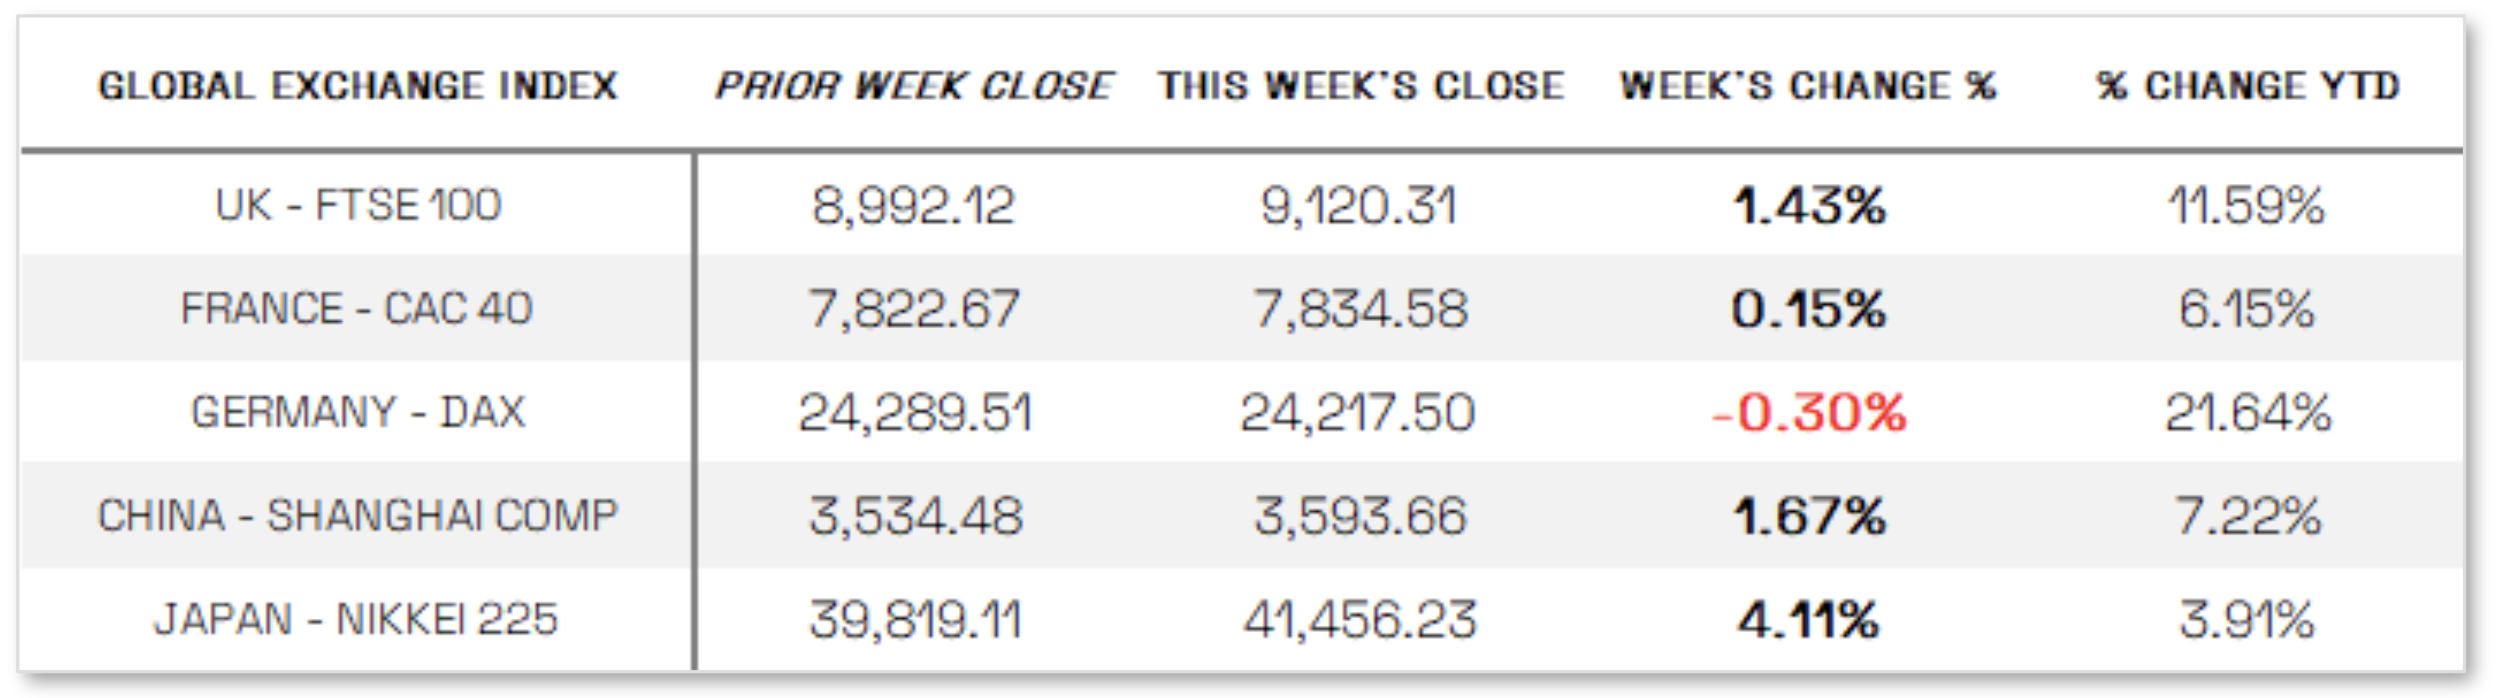
EUROPE: The pan-European STOXX Europe 600 Index rose 0.54% in local currency terms, supported by tentative optimism over a potential EU-U.S. trade deal, though the EU warned it could impose counter-tariffs if no agreement is reached. The European Central Bank (ECB) kept its deposit facility rate unchanged at 2% during its July 24 meeting, a widely expected decision following eight cuts since June 2024, as eurozone inflation remains at the 2% target and economic performance meets or exceeds expectations despite global trade uncertainties. ECB President Christine Lagarde emphasized a “wait-and-watch” stance, reaffirming the bank’s commitment to maintaining inflation at its target and data-driven policymaking, with her remarks viewed as slightly hawkish, boosting the euro against the U.S. dollar. Among major European markets, Italy’s FTSE MIB gained 1.03%, France’s CAC 40 saw a modest rise, Germany’s DAX slipped 0.30%, and the UK’s FTSE 100 advanced 1.43%. Economic data showed eurozone business activity improving in July, with the HCOB Flash Composite PMI Output Index climbing to 51.0 from 50.6 in June, driven by modest gains in both services and manufacturing, while business confidence strengthened in Germany but weakened in France.
JAPAN: Japan’s stock markets posted strong gains for the week, with the Nikkei 225 and TOPIX Index each climbing 4.11%, driven by surging auto original equipment manufacturers following news of a trade deal between Japan and the U.S. The agreement set a 15% tariff on most Japanese exports, including autos—significantly lower than the previously threatened 25%—and was widely seen as favorable. Additionally, Japan announced plans to invest approximately USD 550 billion in U.S. industries while opening its markets to key American goods. However, political uncertainty weighed on sentiment, with the 10-year Japanese government bond yield rising to 1.59% from 1.53% the previous week, amid speculation about Prime Minister Shigeru Ishiba’s potential resignation after the Liberal Democratic Party-Komeito coalition lost its majority in the July 20 Upper House election, though Ishiba denied any plans to step down.
CHINA: Mainland Chinese stock markets rose on optimism that the U.S. and China might extend their tariff truce ahead of another round of trade talks, with the CSI 300 Index climbing 1.69% and the Shanghai Composite Index up 1.67% in local currency terms, according to FactSet, while Hong Kong’s Hang Seng Index advanced 2.27%. U.S. Treasury Secretary Scott Bessent is scheduled to meet Chinese officials in Stockholm this week for a third round of negotiations to extend the current trade deal set to expire in August. The Stockholm meeting follows earlier talks in Geneva in May, which resulted in a 90-day tariff pause, and a second round in London in June, where both nations agreed to lift export controls. The renewed dialogue has fueled hopes of stabilizing U.S.-China relations after tensions escalated when the Trump administration imposed 145% tariffs on China in April.
Sources:
>> All index and returns data from Norgate Data and Commodity Systems Incorporated and Wall Street Journal.
>> News from Reuters, Barron’s, Wall St. Journal, Bloomberg.com, ft.com, guggenheimpartners.com, zerohedge.com, ritholtz.com, markit.com, financialpost.com, Eurostat, Statistics Canada, Yahoo! Finance, stocksandnews.com, marketwatch.com, visualcapitalist.com, wantchinatimes.com, BBC, 361capital.com, pensionpartners.com, cnbc.com, FactSet, Morningstar/Ibbotson Associates, Corporate Finance Institute.
>> Commentary from T Rowe Price Global markets weekly update — https://www.troweprice.com/personal-investing/resources/insights/global-markets-weekly-update.html
Disclosures: This material and any mention of specific investments is provided for informational purposes only and is not intended to be investment advice or a recommendation to take any action. The forecasts or forward-looking statements are based on assumptions, may not materialize, and are subject to revision without notice. The market indexes discussed are unmanaged, and generally, considered representative of their respective markets. Index performance is not indicative of the past performance of a particular investment. Indexes do not incur management fees, costs, and expenses. Individuals cannot directly invest in unmanaged indexes. Past performance does not guarantee future results.
