


THE COMPLETE PICTURE
>> Four indicators across three time frames.
>> When the Sherman Portfolios indicators are positive status, we read the market as being in a Bull Market.
1. DELTA-V — Positive since June 27, 2025
2. GALACTIC SHIELD — Positive since April 1, 2023
3. STARFLUX — Positive since May 12, 2025
4. STARPATH — Positive since May 14, 2025
The shorter term picture:
>> GALACTIC SHIELD — POSITIVE, for Q3 2025, This indicator is based on the combination of U.S. and International Equities trend statuses at the start of each quarter.
>> STARFLUX — POSITIVE, Starflux ended the week at 10.22 (Down 3.04% last week) This short-term indicator measures U.S. Equities.
>> STARPATH — POSITIVE, This indicator measures the interplay on dual timeframes of our Type 1s + the Russell 3000 + our four most ‘pro-cyclical’ Type 3s, vs. Cash.
The big picture:
The ‘big picture’ is the (typically) years-long timeframe, the same timeframe in which Cyclical Bulls and Bears operate.
>> The Sherman Portfolios DELTA-V Indicator measuring the Bull/Bear cycle finished the week in a Bull status at 62.42, up 2.95% from the prior week’s 60.63. It has signaled Bull since June 27, 2025.
>> The Sherman Portfolios DELTA-V Bond Indicator measuring the Bull/Bear cycle finished the week in BULL status at 54.64, down 8.93% from the prior week’s 60.00. It has signaled Bull since December 15, 2023.
The very big picture (a historical perspective): The CAPE is now at 38.37.
The cyclically adjusted price-to-earnings ratio (CAPE) can be used to smooth out the shorter-term earnings swings to get a longer-term assessment of market valuation. An extremely high CAPE ratio means that a company’s stock price is substantially higher than the company’s earnings would indicate and, therefore, overvalued. It is generally expected that the market will eventually correct the company’s stock price by pushing it down to its true value.
In the past, the CAPE ratio has proved its importance in identifying potential bubbles and market crashes. The historical average of the ratio for the S&P 500 Index is between 15-16, while the highest levels of the ratio have exceeded 30. The record-high levels occurred three times in the history of the U.S. financial markets. The first was in 1929 before the Wall Street crash that signaled the start of the Great Depression. The second was in the late 1990s before the Dotcom Crash, and the third came in 2007 before the 2007-2008 Financial Crisis. https://www.multpl.com/shiller-pe
 Note: We do not use CAPE as an official input into our methods. However, we think history serves as a guide and that it’s good to know where we are on the historic continuum.
THIS WEEK IN THE MARKETS
U.S. Markets:
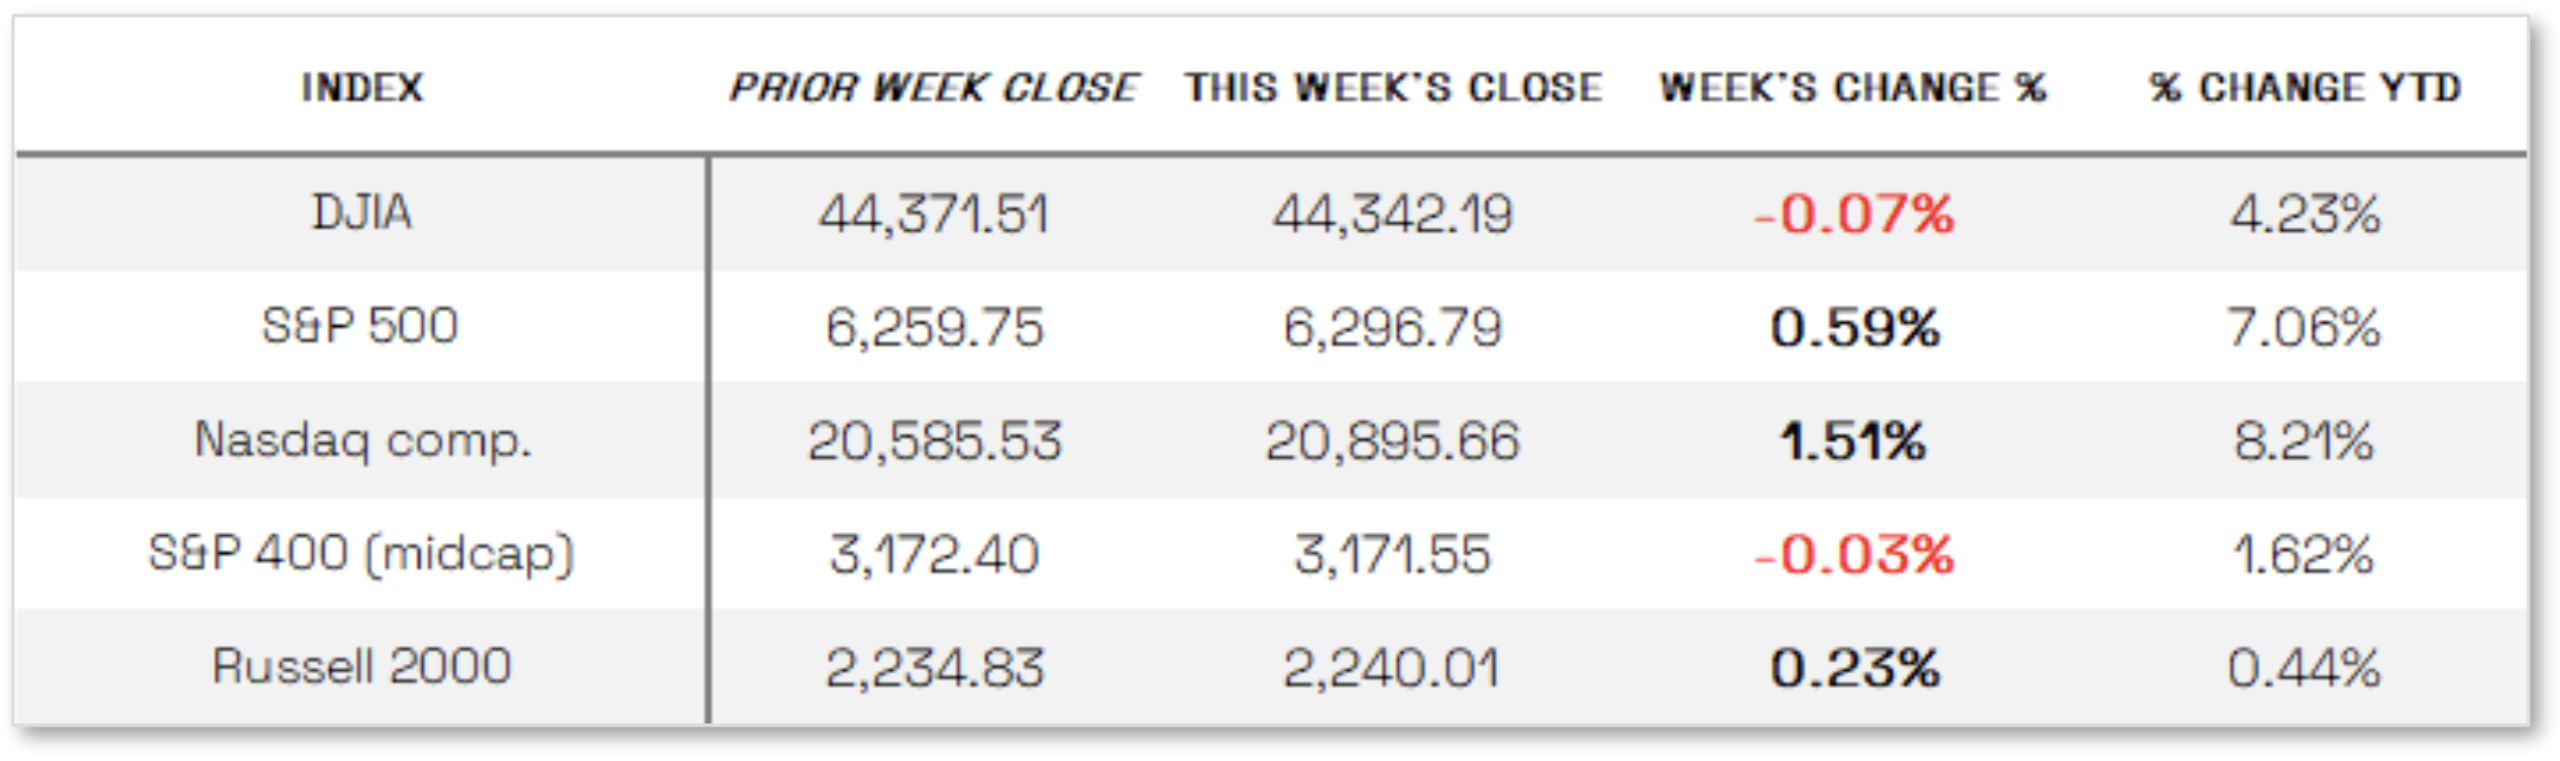
Nasdaq hit new highs this week:
Stocks advanced during the week, with the Nasdaq Composite Index reaching new record highs, buoyed by strong corporate earnings and generally positive economic data. The small-cap Russell 2000 also posted gains, while the Dow Jones Industrial Average and S&P Midcap 400 Index declined. Earnings season kicked off on Tuesday with major banks like Chase and Citigroup reporting better-than-expected second-quarter results, followed by upbeat reports from consumer-focused companies including PepsiCo, United Airlines, and Netflix on Thursday. In other corporate news, NVIDIA shares rose after the company announced it had received U.S. government approval to sell its H2O AI chips to China, following its milestone of reaching a USD 4 trillion market cap earlier in July.
Looking at the US Indexes:
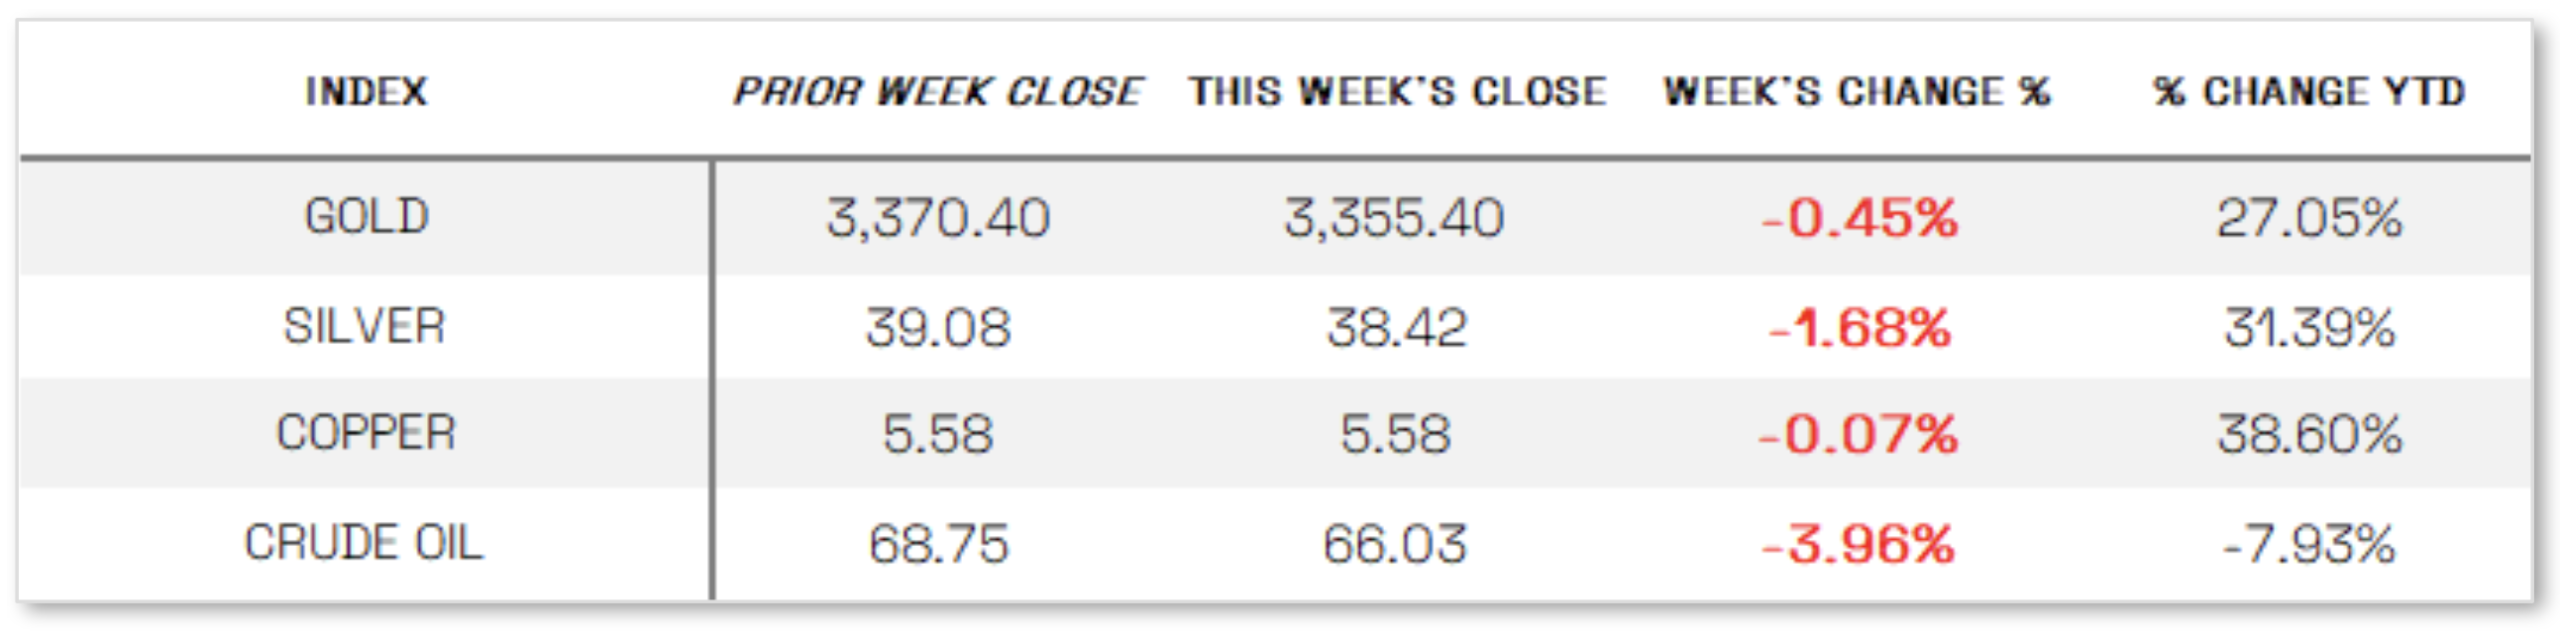
U.S. Commodities/Futures:
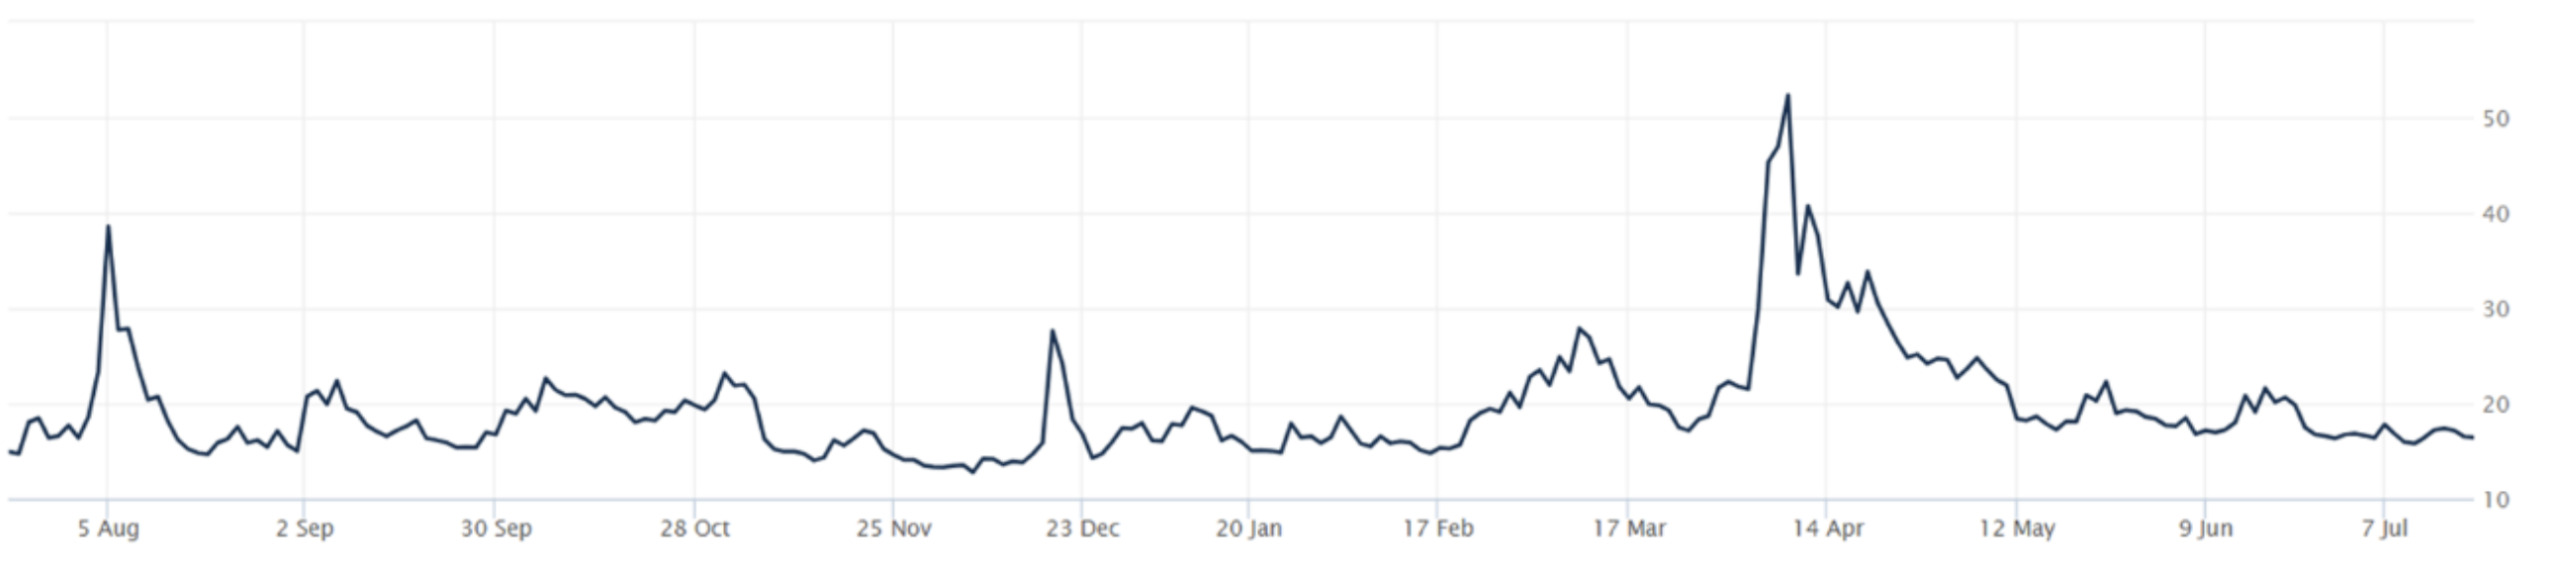
THE VOLATILITY INDEX (VIX) closed at 16.41 this week, a 0.1% increase vs last week’s close of 16.40.
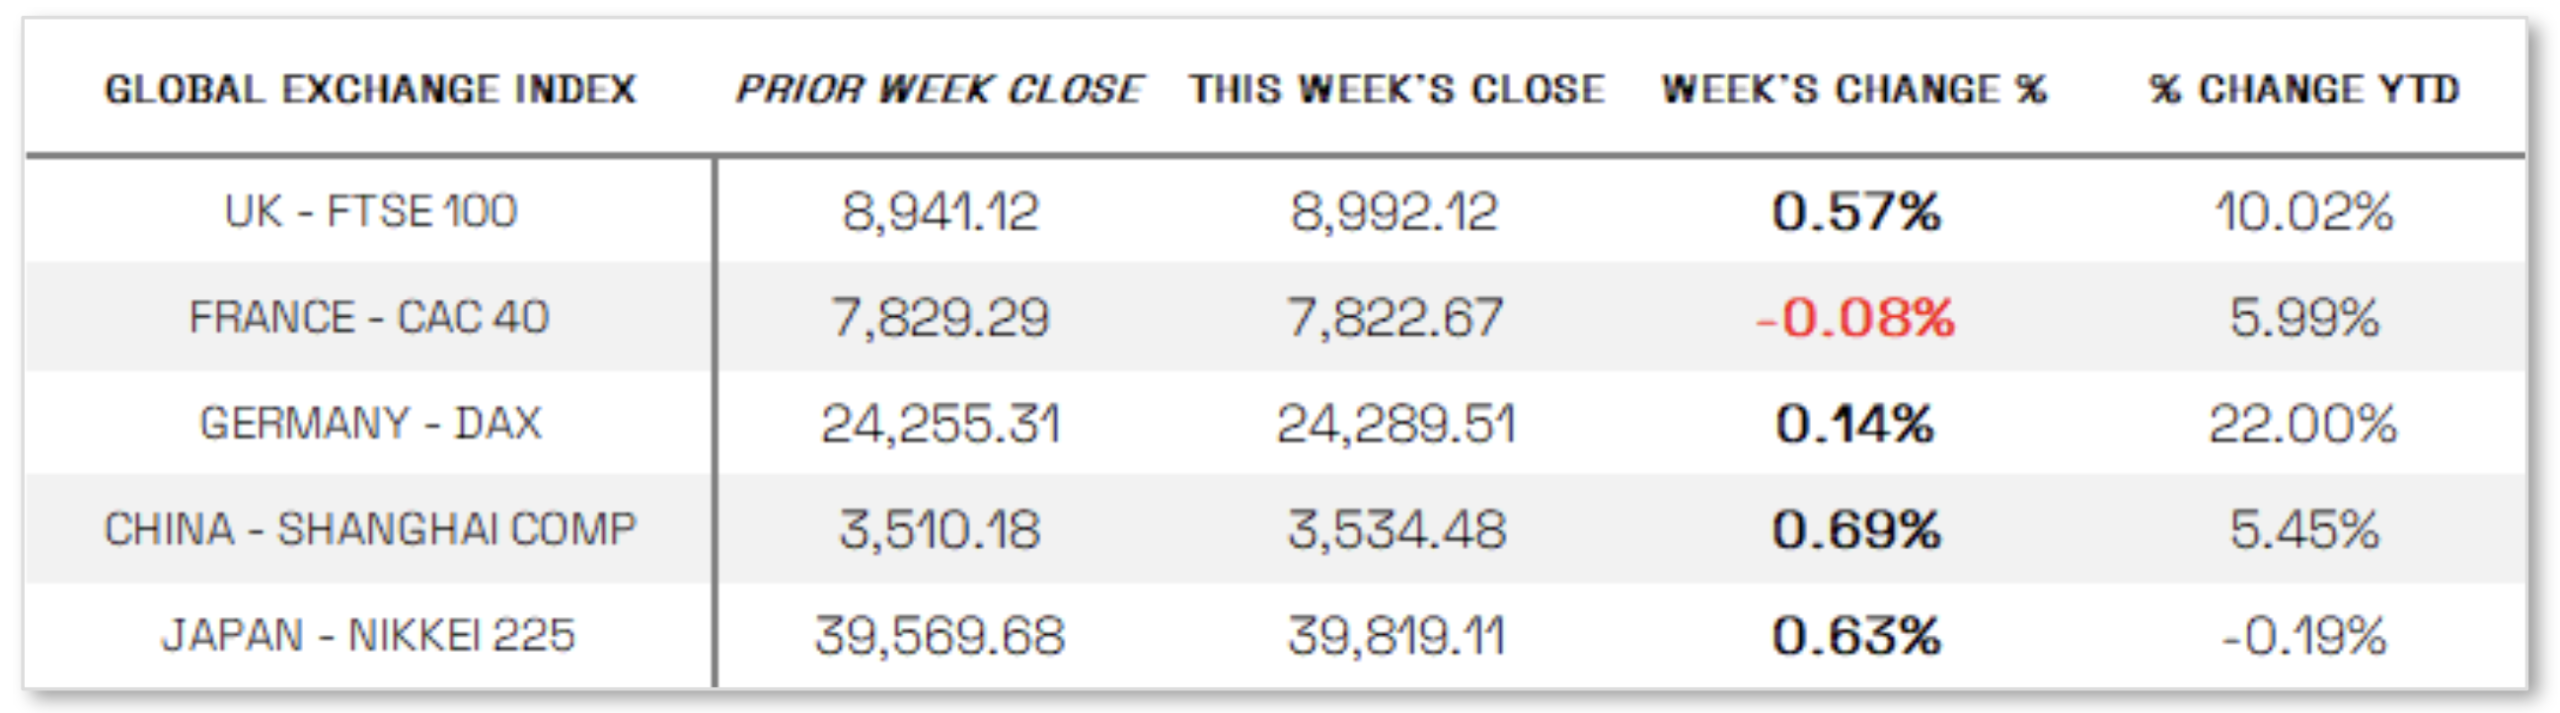
International Markets:
THIS WEEK’S ECONOMIC NEWS
U.S. Economic News:
Inflation and sales up: Stocks found support from economic data indicating resilient consumer spending and manageable inflation, despite signs of rising prices. The consumer price index (CPI) rose 0.3% in June—its largest monthly gain in five months—driven partly by higher tariffs, though the increase was in line with expectations. On a year-over-year basis, CPI climbed to 2.7% from 2.4% in May, while core CPI, which excludes food and energy, ticked up to 2.9% from 2.8%. Price gains in household goods, recreation items, and footwear were partially offset by declines in car prices. Meanwhile, retail sales rebounded with a stronger-than-expected 0.6% increase in June after a 0.9% drop in May, reinforcing consumer strength. Stocks briefly dipped midweek on reports that President Donald Trump planned to fire Federal Reserve Chair Jerome Powell but recovered after Trump denied the reports, despite his ongoing criticism of the Fed’s decision to hold off on further rate cuts this year.
International Economic News:
EUROPE: In local currency terms, the pan-European STOXX Europe 600 Index finished roughly flat as investors awaited developments in U.S.–European trade talks, with major indexes showing mixed performance. Italy’s FTSE MIB rose 0.58%, while Germany’s DAX and France’s CAC 40 were little changed. The UK’s FTSE 100 gained 0.57%, aided in part by a weaker pound, which benefits the index’s multinational constituents that earn significant revenue abroad. In the UK, inflation came in hotter than expected, with the annual CPI rising to 3.6% in June from 3.4% in May—the fastest pace since January 2024—driven largely by higher transport costs, especially motor fuels. Services inflation remained elevated at 4.7%, defying expectations of a decline and signaling persistent cost pressures. Meanwhile, signs of labor market weakness emerged, as the unemployment rate rose to 4.7%—a four-year high—and payrolled employment declined for the second consecutive month. Wage growth excluding bonuses slowed to 5.0%, down from a revised 5.3% in May, although still slightly above forecasts.
JAPAN: Japan’s stock markets posted modest gains for the week, with the Nikkei 225 rising 0.63% and the broader TOPIX Index up 0.40%, though upside was limited by political uncertainty ahead of the Upper House election on July 20, where Prime Minister Shigeru Ishiba’s ruling coalition risks losing its majority. Investor attention has turned to the potential makeup and policy direction of the next cabinet, particularly whether it will support pro-growth reforms and adopt a more fiscally dovish stance. These expectations pushed the 10-year Japanese government bond yield up to 1.53% from 1.49% the previous week, while the yen weakened to the mid-JPY 148 range against the U.S. dollar, down from JPY 147.4. Meanwhile, inflation showed signs of cooling, with core CPI rising 3.3% year over year in June—below the 3.4% consensus and down from 3.7% in May—largely due to declining energy costs helped by government subsidies.
CHINA: Mainland Chinese stock markets posted weekly gains, with the CSI 300 Index rising 1.09% and the Shanghai Composite Index up 0.69% in local currency terms, while Hong Kong’s Hang Seng Index advanced 2.84%, according to FactSet. China’s GDP grew 5.2% year over year in the second quarter, slightly below the first quarter’s 5.4% pace but exceeding expectations, easing near-term pressure on Beijing to introduce additional stimulus. However, analysts warned that growth may slow in the second half of the year due to mounting deflationary pressures, tepid retail sales, and the risk of renewed U.S. trade tensions when a temporary agreement expires in mid-August. Producer prices fell in June for the 33rd consecutive month, marking the steepest drop in nearly two years. Meanwhile, ongoing weakness in the housing market has revived calls for government support, as new home prices in 70 cities declined 0.27% month over month in June and existing home prices dropped 0.61%, with residential sales plunging 12.6% from a year earlier—the largest decline this year—highlighting the continued drag of the property slump on consumer demand.
Sources:
>> All index and returns data from Norgate Data and Commodity Systems Incorporated and Wall Street Journal.
>> News from Reuters, Barron’s, Wall St. Journal, Bloomberg.com, ft.com, guggenheimpartners.com, zerohedge.com, ritholtz.com, markit.com, financialpost.com, Eurostat, Statistics Canada, Yahoo! Finance, stocksandnews.com, marketwatch.com, visualcapitalist.com, wantchinatimes.com, BBC, 361capital.com, pensionpartners.com, cnbc.com, FactSet, Morningstar/Ibbotson Associates, Corporate Finance Institute.
>> Commentary from T Rowe Price Global markets weekly update — https://www.troweprice.com/personal-investing/resources/insights/global-markets-weekly-update.html
Disclosures: This material and any mention of specific investments is provided for informational purposes only and is not intended to be investment advice or a recommendation to take any action. The forecasts or forward-looking statements are based on assumptions, may not materialize, and are subject to revision without notice. The market indexes discussed are unmanaged, and generally, considered representative of their respective markets. Index performance is not indicative of the past performance of a particular investment. Indexes do not incur management fees, costs, and expenses. Individuals cannot directly invest in unmanaged indexes. Past performance does not guarantee future results.
