


THE COMPLETE PICTURE
>> Four indicators across three time frames.
>> When the Sherman Portfolios indicators are positive status, we read the market as being in a Bull Market.
1. DELTA-V — Positive since June 27, 2025
2. GALACTIC SHIELD — Positive since April 1, 2023
3. STARFLUX — Positive since May 12, 2025
4. STARPATH — Positive since May 14, 2025
The shorter term picture:
>> GALACTIC SHIELD — POSITIVE for Q2 2025, This indicator is based on the combination of U.S. and International Equities trend statuses at the start of each quarter.
>> STARFLUX — POSITIVE, Starflux ended the week at 11.52 (Down 4.24% last week) This short-term indicator measures U.S. Equities.
>> STARPATH — POSITIVE, This indicator measures the interplay on dual timeframes of our Type 1s + the Russell 3000 + our four most ‘pro-cyclical’ Type 3s, vs. Cash.
The big picture:
The ‘big picture’ is the (typically) years-long timeframe, the same timeframe in which Cyclical Bulls and Bears operate.
>> The Sherman Portfolios DELTA-V Indicator measuring the Bull/Bear cycle finished the week in a Bull status at 59.27, up 4.45% from the prior week’s 56.74. It has signaled Bull since June 27, 2025.
>> The Sherman Portfolios DELTA-V Bond Indicator measuring the Bull/Bear cycle finished the week in BULL status at 58.91, up 1.73% from the prior week’s 57.91. It has signaled Bull since December 15, 2023.
The very big picture (a historical perspective): The CAPE is now at 38.31.
The cyclically adjusted price-to-earnings ratio (CAPE) can be used to smooth out the shorter-term earnings swings to get a longer-term assessment of market valuation. An extremely high CAPE ratio means that a company’s stock price is substantially higher than the company’s earnings would indicate and, therefore, overvalued. It is generally expected that the market will eventually correct the company’s stock price by pushing it down to its true value.
In the past, the CAPE ratio has proved its importance in identifying potential bubbles and market crashes. The historical average of the ratio for the S&P 500 Index is between 15-16, while the highest levels of the ratio have exceeded 30. The record-high levels occurred three times in the history of the U.S. financial markets. The first was in 1929 before the Wall Street crash that signaled the start of the Great Depression. The second was in the late 1990s before the Dotcom Crash, and the third came in 2007 before the 2007-2008 Financial Crisis. https://www.multpl.com/shiller-pe
 Note: We do not use CAPE as an official input into our methods. However, we think history serves as a guide and that it’s good to know where we are on the historic continuum.
THIS WEEK IN THE MARKETS
U.S. Markets:
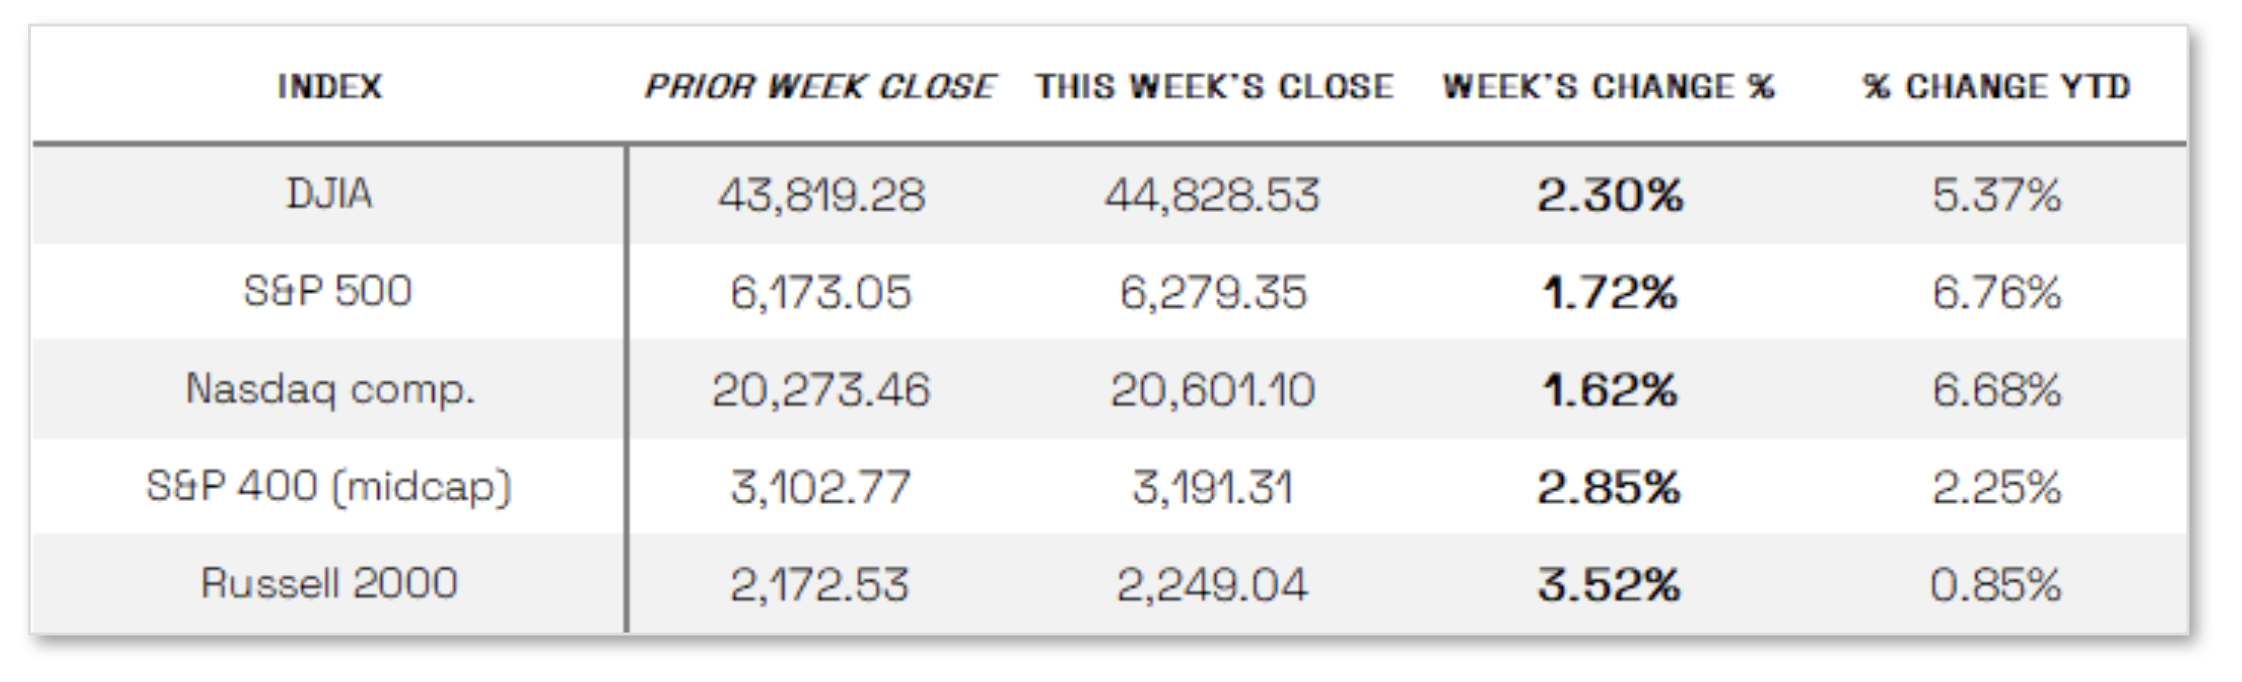
Stocks remain at all-time highs:
Major U.S. stock indexes ended the holiday-shortened week higher, with the S&P 500 Index and Nasdaq Composite closing at record highs for the second consecutive week. Smaller-cap indexes led the gains, as the S&P MidCap 400 rose 2.85% and the Russell 2000 climbed 3.52%, followed by a 2.30% advance in the Dow Jones Industrial Average. U.S. markets closed early Thursday and remained shut on Friday for the Independence Day holiday, resulting in several quiet trading sessions. The week’s focus was largely on the Trump administration’s reconciliation bill, which narrowly passed the Senate on Tuesday and the House on Thursday, while trade developments also captured attention, including President Trump’s announcement of a trade deal with Vietnam on Wednesday and remarks about negotiations with other trade partners ahead of the July 9 tariff deadline, when the 90-day suspension of reciprocal tariffs is set to expire.
Looking at the US Indexes:
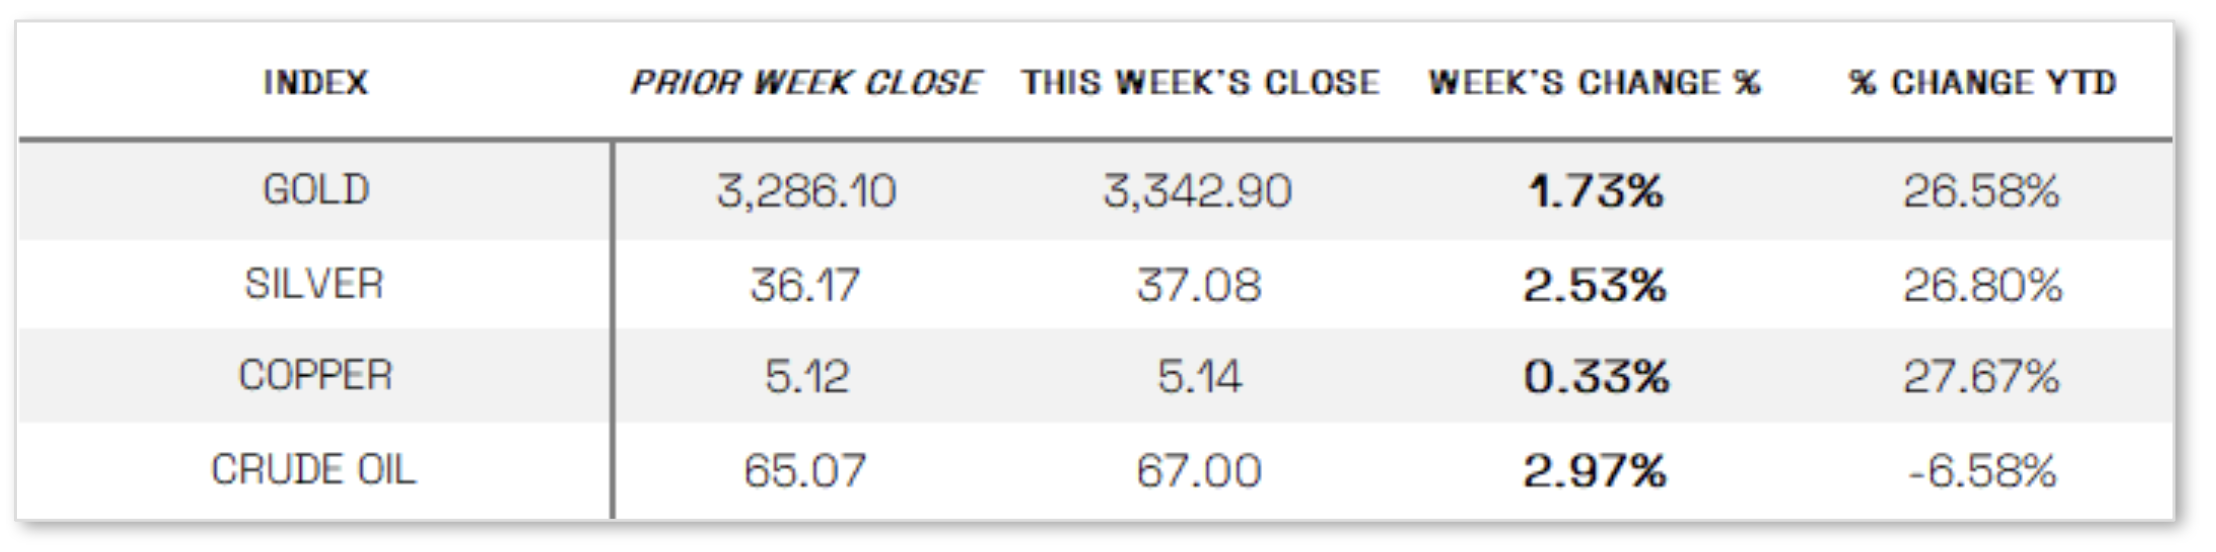
U.S. Commodities/Futures:
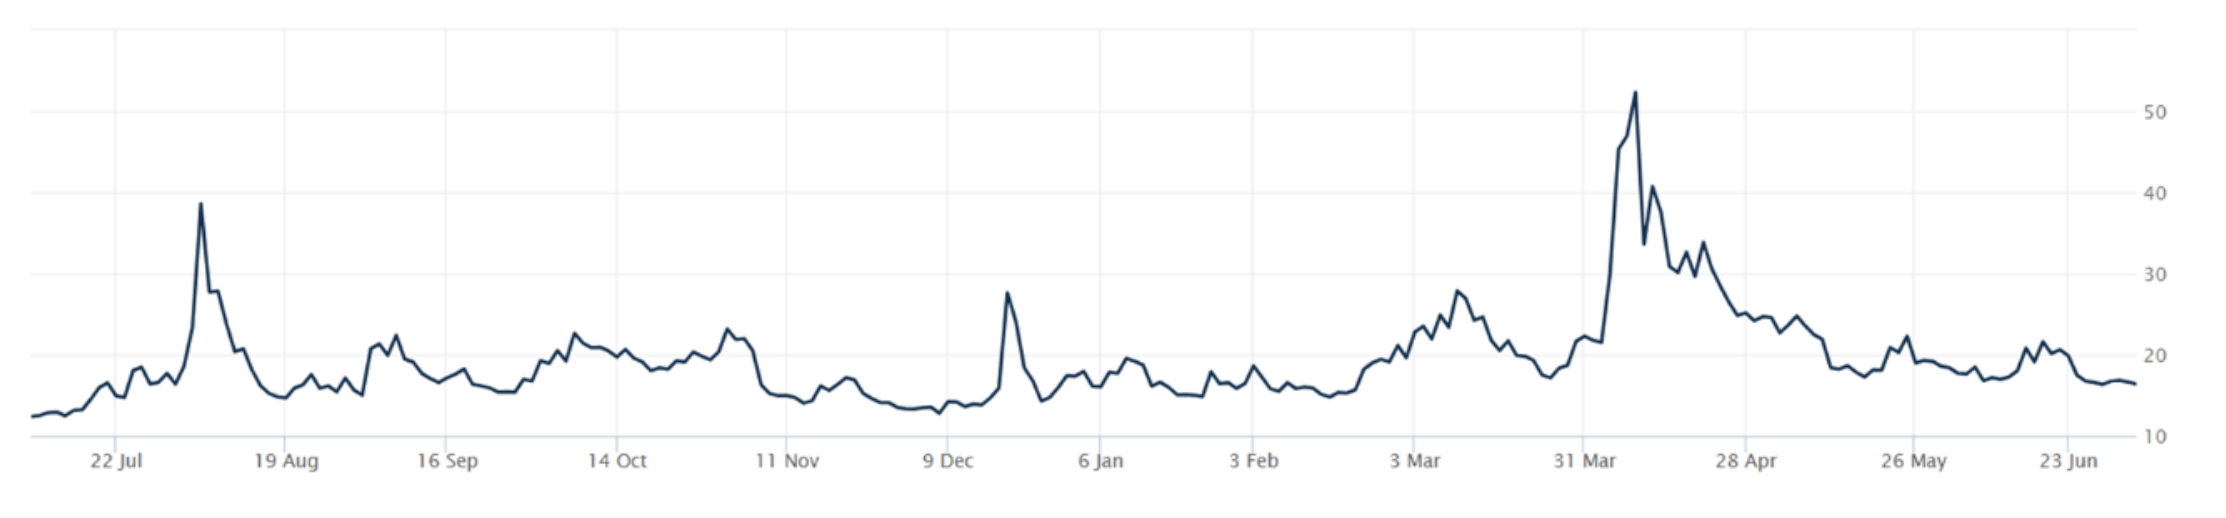
THE VOLATILITY INDEX (VIX) closed at 16.38 this week, a 0.4% increase vs last week’s close of 16.32.
International Markets:
THIS WEEK’S ECONOMIC NEWS
U.S. Economic News:
Unemployment continues to fall: U.S. job growth remained resilient in June, with the Labor Department reporting 147,000 jobs added—beating economists’ expectations and surpassing May’s upwardly revised 144,000—while the unemployment rate edged down to 4.1% and average hourly earnings rose 0.2% month over month. The stronger-than-expected jobs report contrasted with Wednesday’s disappointing data from ADP, which showed a surprise 33,000 decline in private payrolls, the first negative reading since March 2023, attributed to employers’ hesitancy to hire or replace workers. Separately, job openings climbed to 7.8 million in May, the highest since November, led by gains in accommodation, food services, and finance, while initial jobless claims for the week ended June 28 fell to 233,000. In other economic data, the ISM’s manufacturing PMI indicated contraction for a fourth month in June at 49%, though the pace of decline slowed thanks to improvements in inventories and production, while the services sector rebounded to expansion with a PMI of 50.8% driven by stronger business activity and new orders; meanwhile, the Prices Index eased slightly but stayed elevated at 67.5%, marking the seventh consecutive month above 60% and signaling persistent price pressures.
International Economic News:
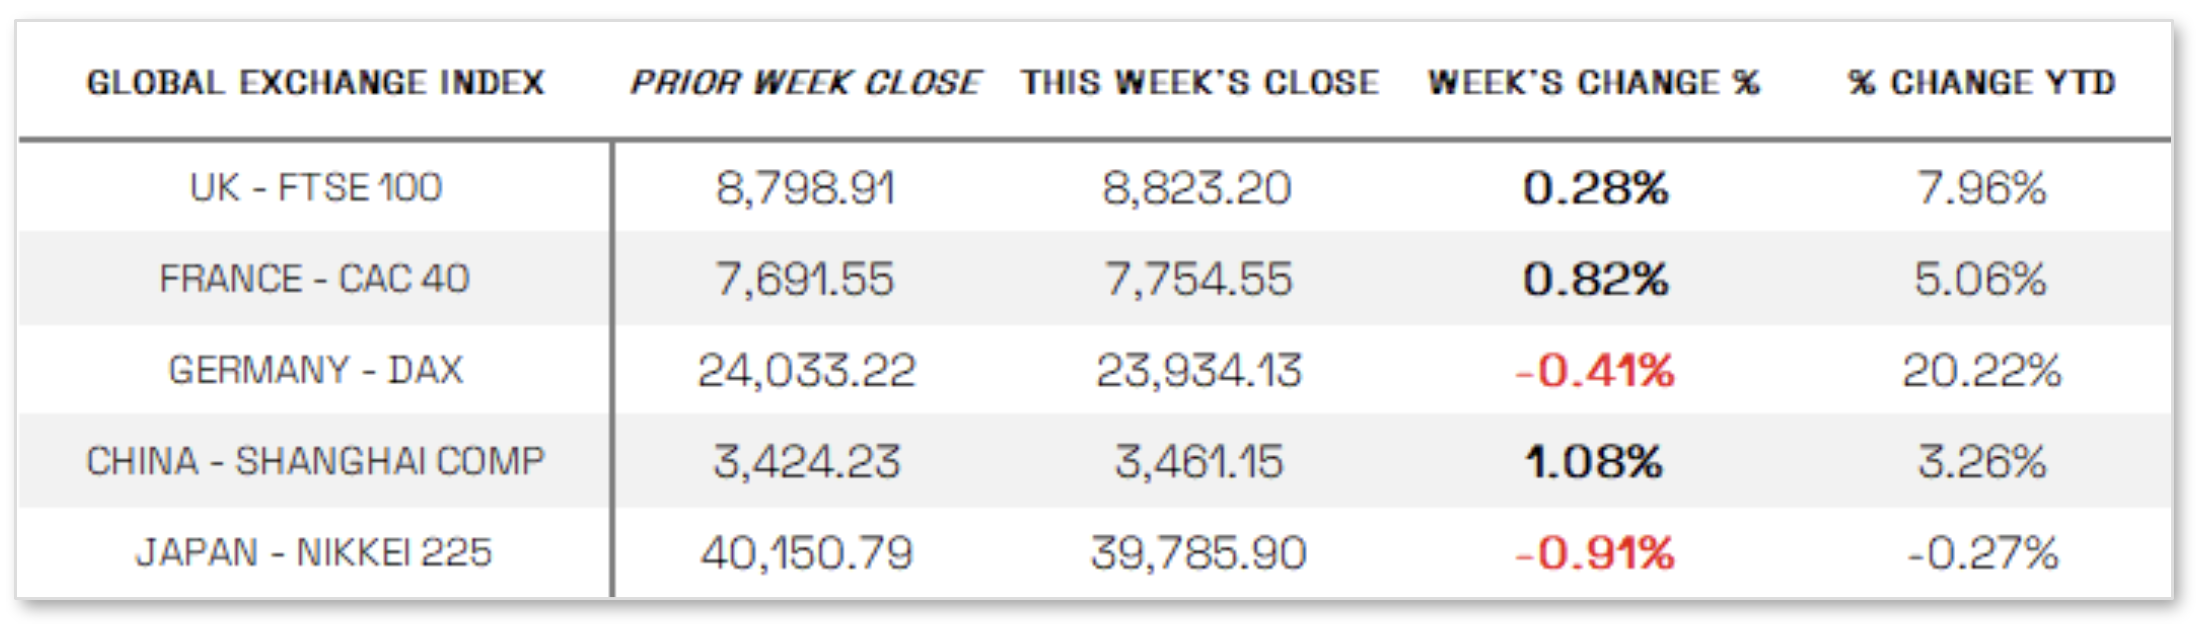
EUROPE: Over the four days ended Thursday, the pan-European STOXX Europe 600 Index was roughly flat in local currency terms, with major European stock indexes delivering mixed returns: France’s CAC 40 rose 0.82%, Italy’s FTSE MIB advanced 0.51%, Germany’s DAX slipped 0.41%, and the UK’s FTSE 100 gained 0.28%. On the economic front, eurozone headline inflation in June ticked up to the European Central Bank’s (ECB’s) 2.0% target from May’s eight-month low of 1.9%, while core inflation held steady at 2.3% and services inflation, closely watched by policymakers, edged up to 3.3% from 3.2%. Meanwhile, the euro area’s labor market remained robust, with the seasonally adjusted unemployment rate rising slightly to 6.3% in May from April’s record low of 6.2%, but still below 6.4% a year earlier. Speaking at the ECB’s annual forum in Sintra, Portugal, ECB President Christine Lagarde acknowledged reaching the 2% inflation target but cautioned that more time and data were needed before confirming that inflation risks had fully subsided, warning: “Our work is not done, and we need to remain vigilant,” which dampened hopes for imminent further rate cuts.
JAPAN: Japan’s stock markets declined over the week through Thursday, with the Nikkei 225 falling 0.91% and the TOPIX down 0.41%, as investor sentiment was weighed down by signs of stalled progress in U.S.-Japan trade negotiations; in currency markets, the yen strengthened to around JPY 143.8 per U.S. dollar from JPY 144.6 the previous week amid broad dollar weakness, while the yield on the 10-year Japanese government bond edged up to 1.45% from 1.43%. Investors focused on the bilateral trade talks, with a 24% reciprocal tariff on Japanese imports set to resume on July 9 unless a deal is reached, and U.S. President Trump warning of potential tariffs of 30% to 35% if no agreement is finalized, as Japan insists on removing all tariffs, especially on autos, while the U.S. pushes for increased Japanese imports of American agricultural products. Meanwhile, the Bank of Japan’s quarterly “tankan” survey showed an unexpected improvement in business sentiment among large manufacturers, with the index rising to +13 in June from +12 in March, beating expectations of +10, although these firms anticipate a decline in confidence over the next three months.
CHINA: Mainland Chinese stock markets advanced for the week ended Thursday, with the CSI 300 Index rising 1.18% and the Shanghai Composite Index gaining 1.08% in local currency terms, while Hong Kong’s Hang Seng Index fell 0.88%, according to FactSet. Economic data painted a mixed picture: China’s official manufacturing purchasing managers’ index (PMI) edged up to 49.7 in June from May’s 49.5, the first full month after the U.S. and China agreed to a 90-day pause in their tariff dispute, which temporarily boosted trade. Although the PMI remained below the 50.0 threshold signaling contraction, it beat economists’ expectations and sparked doubts about whether Beijing would introduce additional stimulus measures in the near future.
Sources:
>> All index and returns data from Norgate Data and Commodity Systems Incorporated and Wall Street Journal.
>> News from Reuters, Barron’s, Wall St. Journal, Bloomberg.com, ft.com, guggenheimpartners.com, zerohedge.com, ritholtz.com, markit.com, financialpost.com, Eurostat, Statistics Canada, Yahoo! Finance, stocksandnews.com, marketwatch.com, visualcapitalist.com, wantchinatimes.com, BBC, 361capital.com, pensionpartners.com, cnbc.com, FactSet, Morningstar/Ibbotson Associates, Corporate Finance Institute.
>> Commentary from T Rowe Price Global markets weekly update — https://www.troweprice.com/personal-investing/resources/insights/global-markets-weekly-update.html
Disclosures: This material and any mention of specific investments is provided for informational purposes only and is not intended to be investment advice or a recommendation to take any action. The forecasts or forward-looking statements are based on assumptions, may not materialize, and are subject to revision without notice. The market indexes discussed are unmanaged, and generally, considered representative of their respective markets. Index performance is not indicative of the past performance of a particular investment. Indexes do not incur management fees, costs, and expenses. Individuals cannot directly invest in unmanaged indexes. Past performance does not guarantee future results.
