


THE COMPLETE PICTURE
>> Four indicators across three time frames.
>> When the Sherman Portfolios indicators are not all the same status, we read the market as being in a Mixed Market.
1. DELTA-V — Negative since April 4, 2025
2. GALACTIC SHIELD — Positive since April 1, 2023
3. STARFLUX— Positive since May 12, 2025
4. STARPATH — Positive since May 14, 2025
The shorter term picture:
>> GALACTIC SHIELD — POSITIVE, for Q2 2025, This indicator is based on the combination of U.S. and International Equities trend statuses at the start of each quarter.
>> STARFLUX — POSITIVE, STARFLUX— Positive, Starflux ended the week at 13.65 (Down 0.58% last week), This short-term indicator measures U.S. Equities.
>> STARPATH — POSITIVE, This indicator measures the interplay on dual timeframes of our Type 1s + the Russell 3000 + our four most ‘pro-cyclical’ Type 3s, vs. Cash.
The big picture:
The ‘big picture’ is the (typically) years-long timeframe, the same timeframe in which Cyclical Bulls and Bears operate.
>> The Sherman Portfolios DELTA-V Indicator measuring the Bull/Bear cycle finished the week in BEAR status at 53.22, up 3.64% from the prior week’s 51.35. It has signaled Bear since April 4, 2025.
>> The Sherman Portfolios DELTA-V Bond Indicator measuring the Bull/Bear cycle finished the week in BULL status at 54.74, up 3.15% from the prior week’s 53.07. It has signaled Bull since December 15, 2023.
The very big picture (a historical perspective): The CAPE is now at 36.91.
The cyclically adjusted price-to-earnings ratio (CAPE) can be used to smooth out the shorter-term earnings swings to get a longer-term assessment of market valuation. An extremely high CAPE ratio means that a company’s stock price is substantially higher than the company’s earnings would indicate and, therefore, overvalued. It is generally expected that the market will eventually correct the company’s stock price by pushing it down to its true value.
In the past, the CAPE ratio has proved its importance in identifying potential bubbles and market crashes. The historical average of the ratio for the S&P 500 Index is between 15-16, while the highest levels of the ratio have exceeded 30. The record-high levels occurred three times in the history of the U.S. financial markets. The first was in 1929 before the Wall Street crash that signaled the start of the Great Depression. The second was in the late 1990s before the Dotcom Crash, and the third came in 2007 before the 2007-2008 Financial Crisis. https://www.multpl.com/shiller-pe
 Note: We do not use CAPE as an official input into our methods. However, we think history serves as a guide and that it’s good to know where we are on the historic continuum.
THIS WEEK IN THE MARKETS
U.S. Markets:
Stocks continue up this week:
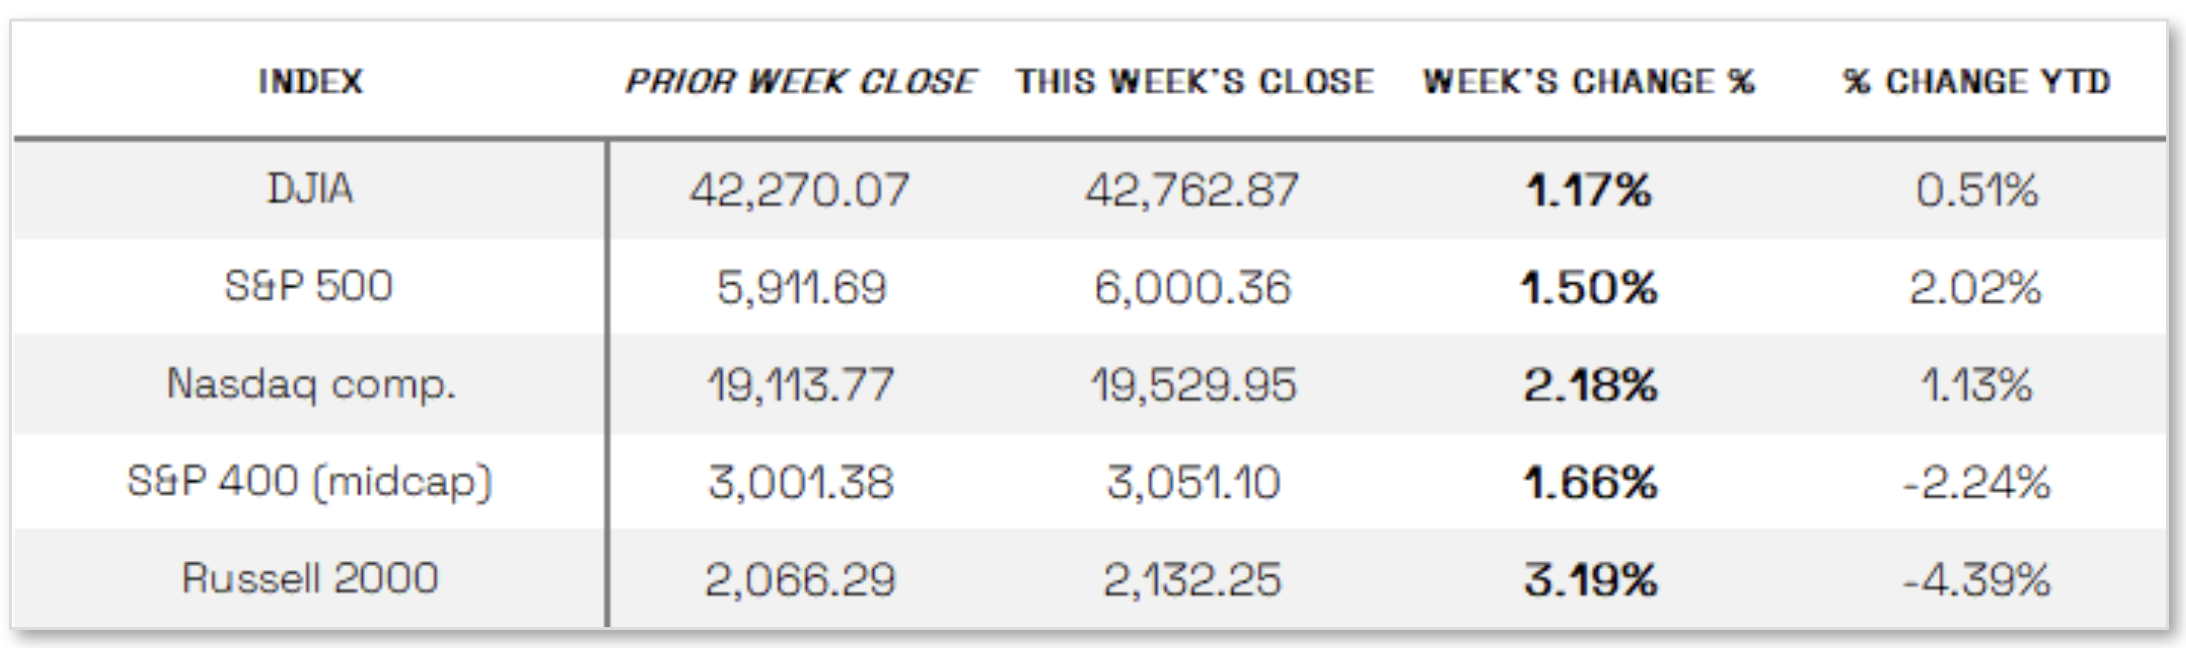
U.S. stocks climbed for the second consecutive week, with small-cap stocks leading the gains as the Russell 2000 Index rose 3.19%, followed by the Nasdaq Composite up 2.18% and the Dow Jones Industrial Average up 1.17%, all joining the S&P 500 in positive territory for the year. Information technology stocks outperformed, buoyed by optimism around artificial intelligence (AI) following strong corporate earnings and news that Meta Platforms signed a 20-year deal with Constellation Energy to support its AI operations. Meanwhile, trade tensions between the U.S. and China resurfaced after social media comments from President Donald Trump, though a phone call between Trump and President Xi Jinping later in the week offered a more hopeful tone, with Trump describing the discussion as reaching “a very positive conclusion for both countries.”
Looking at the US Indexes:
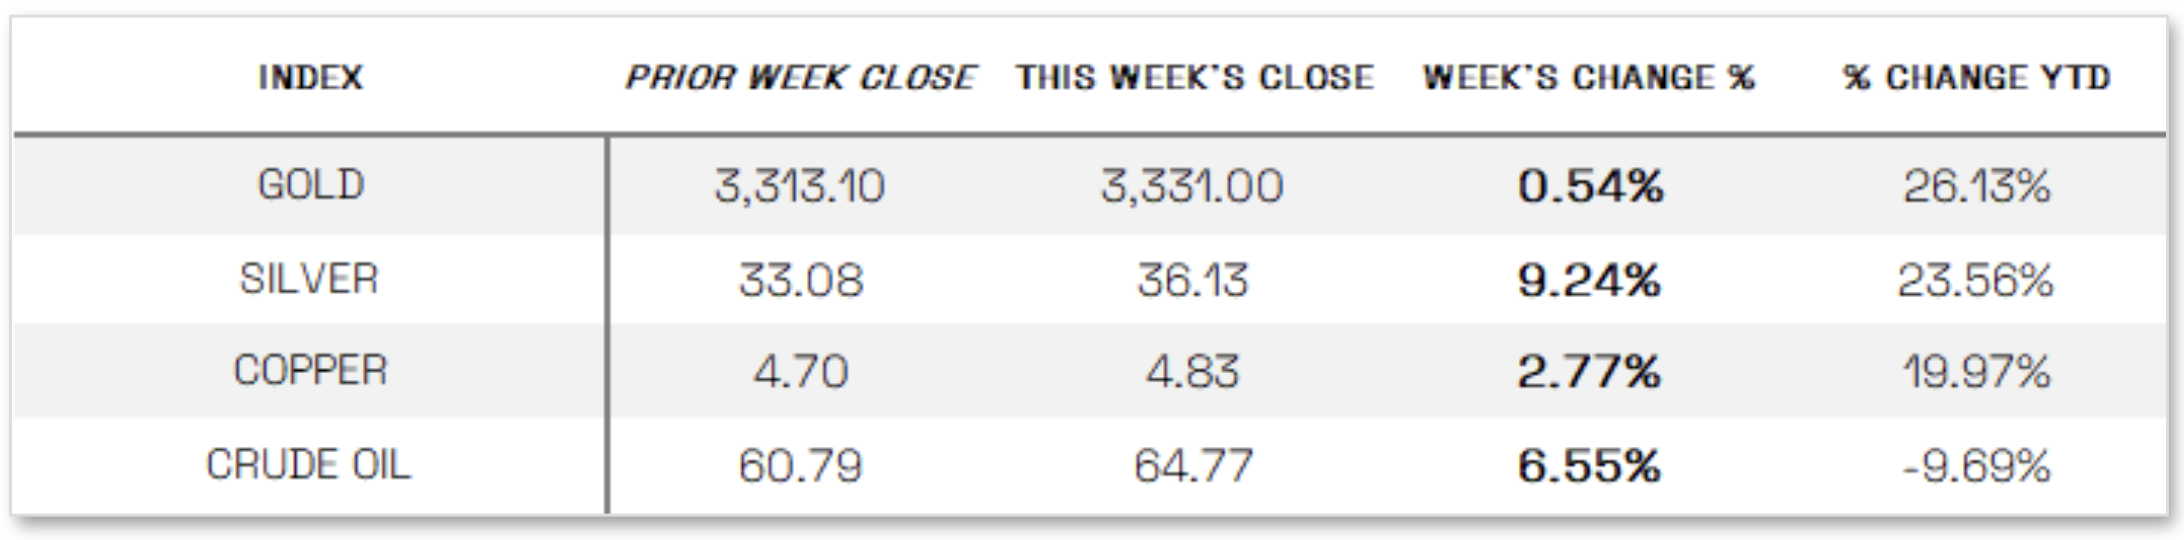
U.S. Commodities/Futures:
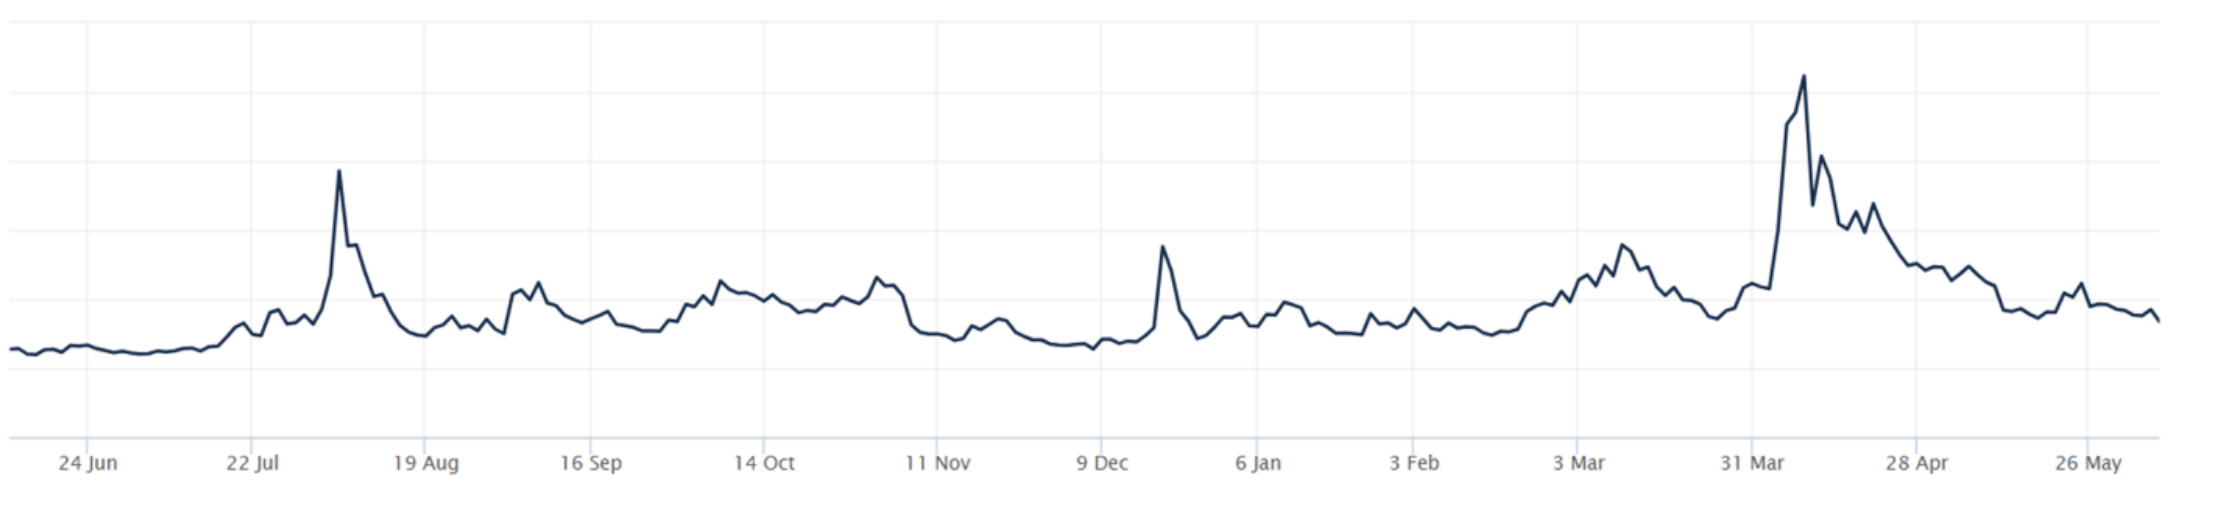
THE VOLATILITY INDEX (VIX) closed at 16.77 this week, a 9.7% decrease vs last week’s close of 18.57.
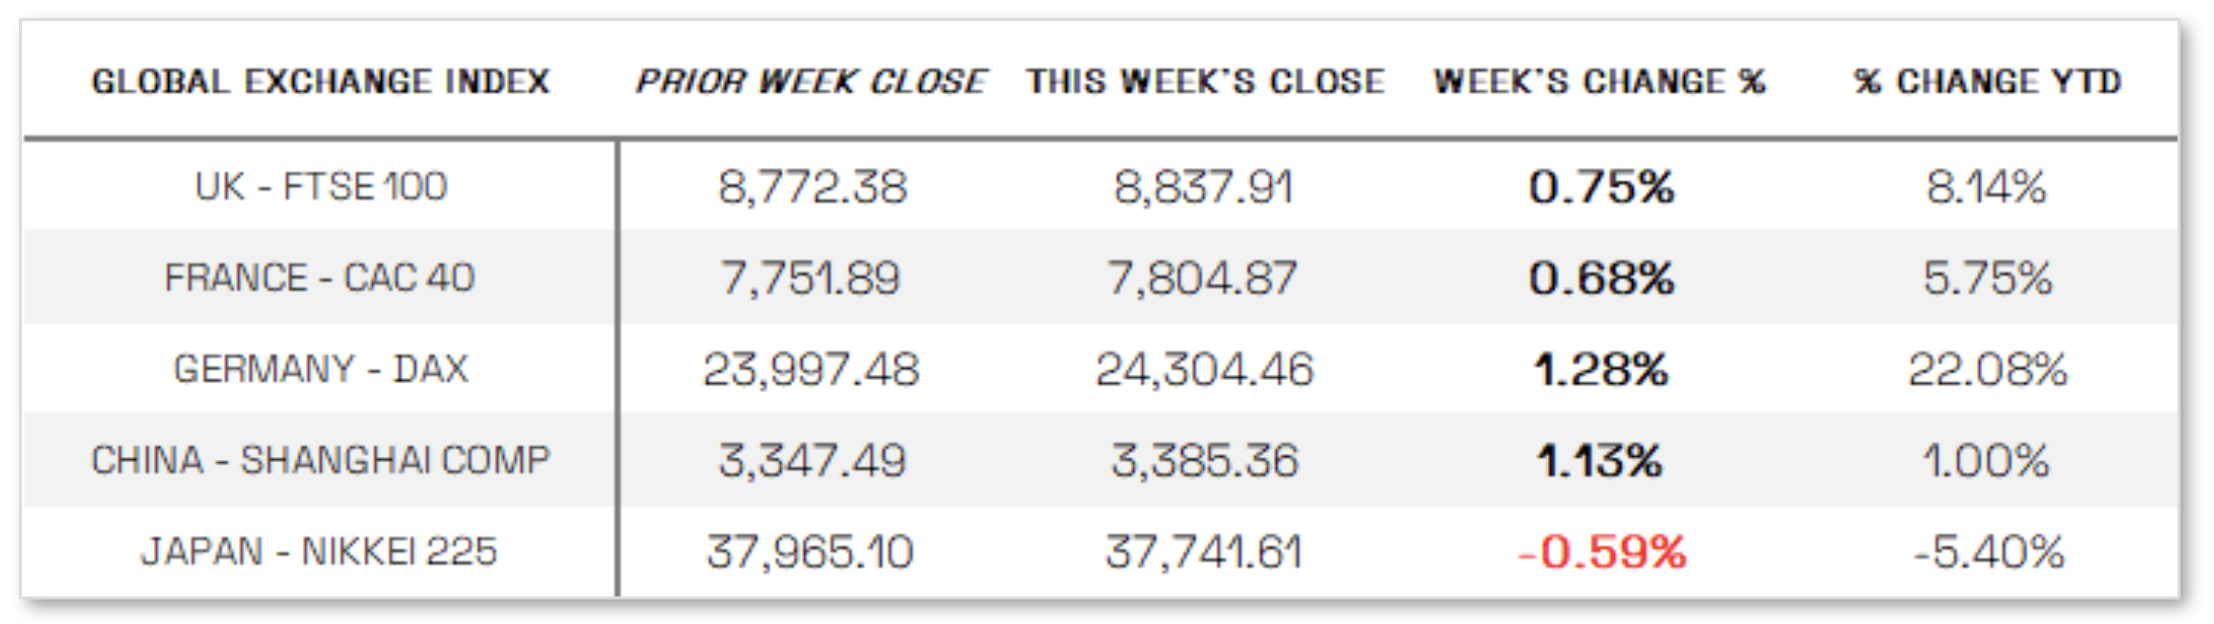
International Markets:
THIS WEEK’S ECONOMIC NEWS
U.S. Economic News:
Mixed economic Data: May’s economic data offered a mixed but slightly more positive picture of the U.S. economy, with job growth slowing yet outperforming expectations and other indicators showing signs of strain. The Labor Department reported 139,000 new nonfarm payrolls in May—down from April’s revised 147,000 but above the forecasted 130,000—while the unemployment rate held steady at 4.2%. The upbeat jobs report, which followed weaker data from ADP and rising initial jobless claims, helped lift both stocks and Treasury yields. Meanwhile, job openings and hiring picked up in April, suggesting continued labor demand despite the start of broad tariffs under the Trump administration. However, manufacturing activity shrank for the third straight month, with the ISM PMI dropping to 48.5%—its lowest level since November—while services activity also unexpectedly contracted for the first time in nearly a year, registering a PMI of 49.9%. Despite falling demand, prices remained high in both sectors, and while new orders dropped sharply, service sector employment rebounded into expansion territory.
International Economic News:
EUROPE: The pan-European STOXX Europe 600 Index rose 0.90% in local currency terms, buoyed by slowing inflation, an interest rate cut from the European Central Bank (ECB), and strong U.S. jobs data that eased recession fears. Major European indexes also gained, with Germany’s DAX and Italy’s FTSE MIB both climbing 1.28%, France’s CAC 40 up 0.68%, and the UK’s FTSE 100 advancing 0.75%. The ECB cut its deposit rate by 25 basis points to 2%, marking the lowest level since 2022, and President Christine Lagarde signaled the rate-cutting cycle may be nearing its end, though future moves will depend on data. Meanwhile, eurozone GDP was revised sharply higher for Q1, growing 0.6%—its fastest pace since Q3 2022—driven by strong performances in Ireland and Germany. Inflation slowed to 1.9% in May, dipping below the ECB’s 2% target, while core inflation also declined. Despite these positive trends, Germany and France reported weaker-than-expected industrial output in April, each contracting by 1.4%, although German manufacturing orders beat expectations with a surprise increase.
JAPAN: Japan’s stock markets declined over the week, with the Nikkei 225 slipping 0.59% and the TOPIX Index falling 1.15%, as bilateral trade talks with the U.S. yielded no agreement but hinted at a potential deal announcement during the June G7 summit. The yen remained stable around JPY 144 per U.S. dollar, while the 10-year Japanese government bond yield dipped to 1.46% from 1.50%, following a recent spike driven by concerns over Japan’s fiscal health and speculation that the Bank of Japan (BoJ) may be tapering bond purchases too quickly. BoJ Governor Kazuo Ueda acknowledged general market support for tapering, though reports hinted that the central bank may consider slowing the pace next year. Economically, household spending disappointed with a 0.1% year-over-year decline in April, while real wages fell 1.8% as inflation outpaced wage growth. Despite these weak spots, the BoJ maintained that Japan’s economy is in a moderate recovery and reaffirmed its readiness to raise interest rates again if inflation and growth continue to meet projections, reinforcing expectations for a gradual policy tightening path.
CHINA: Mainland Chinese stock markets rose over the week as a series of weaker-than-expected economic indicators fueled hopes for additional government stimulus, with the CSI 300 Index gaining 0.88% and the Shanghai Composite Index climbing 1.13% in local currency terms, while Hong Kong’s Hang Seng Index advanced 2.16%. A private survey revealed that China’s manufacturing sector experienced its steepest contraction since September 2022, with the Caixin manufacturing PMI falling to 48.3 in May from 50.4 in April—well below forecasts—largely due to the impact of U.S. tariffs on smaller exporters. However, the Caixin services PMI edged up to 51.1, signaling modest growth. These figures stood in contrast to slightly more positive official data released earlier, with the official manufacturing PMI improving to 49.5 in May from 49.0 in April, likely buoyed by a temporary 90-day tariff reduction agreement between China and the U.S. The official nonmanufacturing PMI dipped marginally to 50.3 from 50.4, reflecting continued softness in services and construction activity.
Sources:
>> All index and returns data from Norgate Data and Commodity Systems Incorporated and Wall Street Journal.
>> News from Reuters, Barron’s, Wall St. Journal, Bloomberg.com, ft.com, guggenheimpartners.com, zerohedge.com, ritholtz.com, markit.com, financialpost.com, Eurostat, Statistics Canada, Yahoo! Finance, stocksandnews.com, marketwatch.com, visualcapitalist.com, wantchinatimes.com, BBC, 361capital.com, pensionpartners.com, cnbc.com, FactSet, Morningstar/Ibbotson Associates, Corporate Finance Institute.
>> Commentary from T Rowe Price Global markets weekly update — https://www.troweprice.com/personal-investing/resources/insights/global-markets-weekly-update.html
Disclosures: This material and any mention of specific investments is provided for informational purposes only and is not intended to be investment advice or a recommendation to take any action. The forecasts or forward-looking statements are based on assumptions, may not materialize, and are subject to revision without notice. The market indexes discussed are unmanaged, and generally, considered representative of their respective markets. Index performance is not indicative of the past performance of a particular investment. Indexes do not incur management fees, costs, and expenses. Individuals cannot directly invest in unmanaged indexes. Past performance does not guarantee future results.
