


THE COMPLETE PICTURE
>> Four indicators across three time frames.
>> When the Sherman Portfolios indicators are not all the same status, we read the market as being in a Mixed Market.
1. DELTA-V — Negative since April 4, 2025
2. GALACTIC SHIELD — Positive since April 1, 2023
3. STARFLUX— Positive since May 12, 2025
4. STARPATH — Positive since May 14, 2025
The shorter term picture:
>> GALACTIC SHIELD — POSITIVE, for Q2 2025, This indicator is based on the combination of U.S. and International Equities trend statuses at the start of each quarter.
>> STARFLUX — POSITIVE, Starflux ended the week at 12.38 (down 32.75% last week) This short-term indicator measures U.S. Equities.
>> STARPATH — POSITIVE, This indicator measures the interplay on dual timeframes of our Type 1s + the Russell 3000 + our four most ‘pro-cyclical’ Type 3s, vs. Cash.
The big picture:
The ‘big picture’ is the (typically) years-long timeframe, the same timeframe in which Cyclical Bulls and Bears operate.
>> The Sherman Portfolios DELTA-V Indicator measuring the Bull/Bear cycle finished the week in BEAR status at 50.35, down 0.20% from the prior week’s 50.45. It has signaled Bear since April 4, 2025.
>> The Sherman Portfolios DELTA-V Bond Indicator measuring the Bull/Bear cycle finished the week in BULL status at 52.59, down 5.14% from the prior week’s 55.44. It has signaled Bull since December 15, 2023.
THIS WEEK IN THE MARKETS
U.S. Markets:
Stocks down over renewed tariffs:
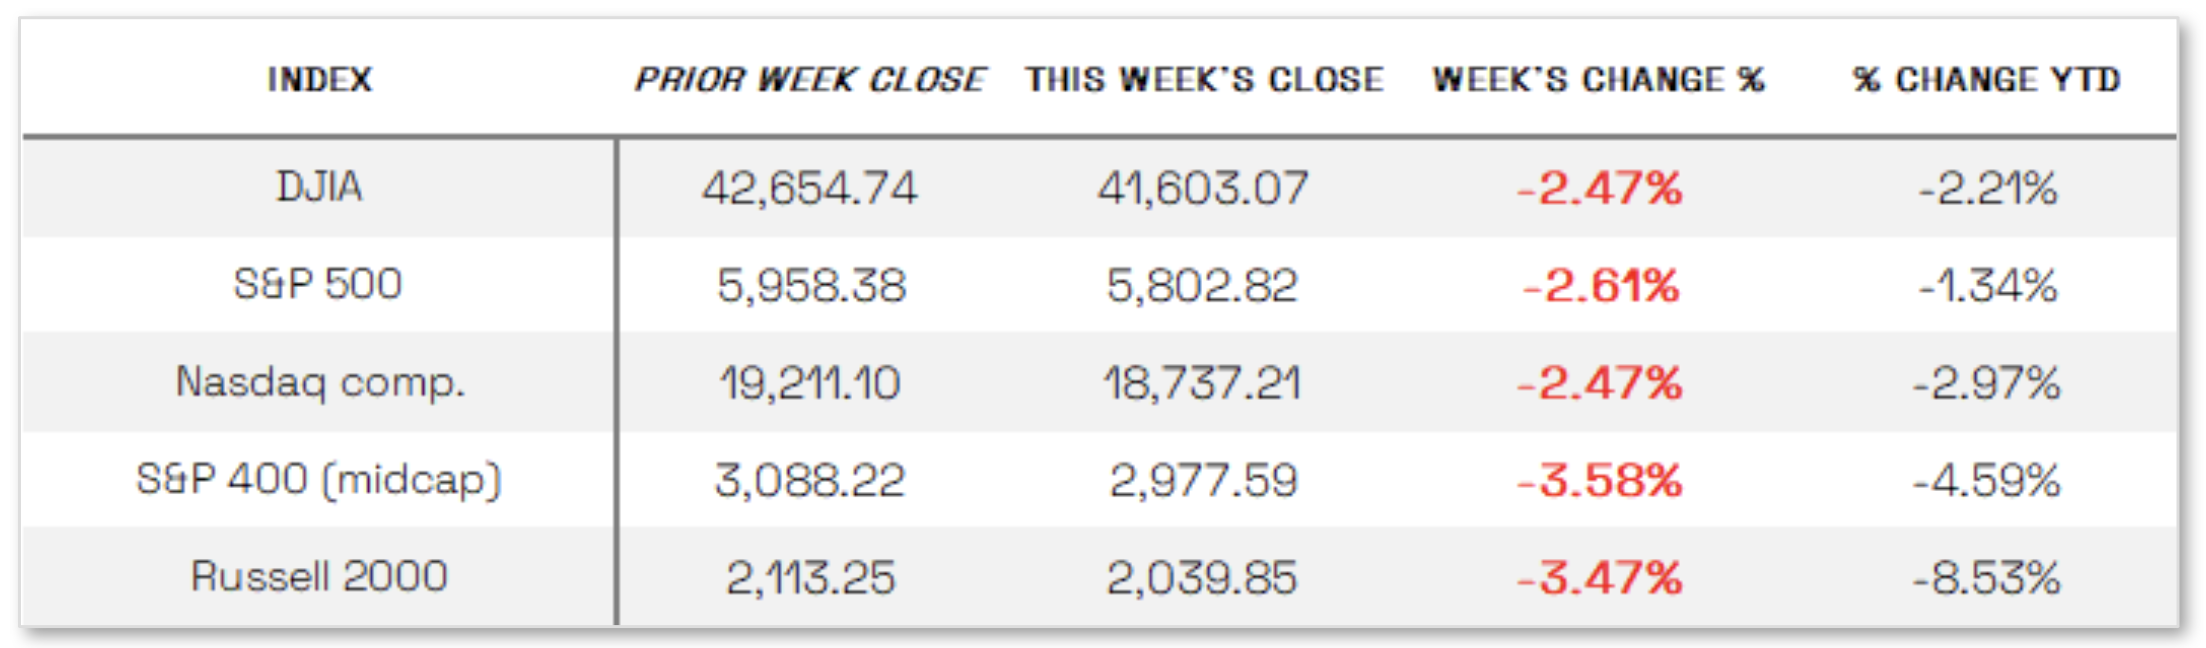
Stocks ended the week lower amid heightened Treasury market volatility and renewed tariff threats, with small- and mid-cap indexes underperforming and the S&P 500 and Dow Jones Industrial Average slipping back into negative territory for the year. The Nasdaq Composite fared better but still declined 2.47%. Market weakness intensified midweek after a disappointing 20-year Treasury bond auction drove long-term yields higher, with the 30-year yield reaching its highest level since 2023 before partially retreating. The selloff in Treasuries was linked to Moody’s recent downgrade of U.S. sovereign debt due to growing fiscal concerns, which was further exacerbated by the House’s passage of President Trump’s tax bill, projected to expand federal deficits. Equities fell further on Friday following Trump’s announcement of a 50% tariff on European Union imports starting June 1 and a threat to impose 25% tariffs on iPhones unless Apple relocates production to the U.S., causing Apple’s stock to drop over 3%. U.S. markets will be closed Monday for Memorial Day.
Looking at the US Indexes:
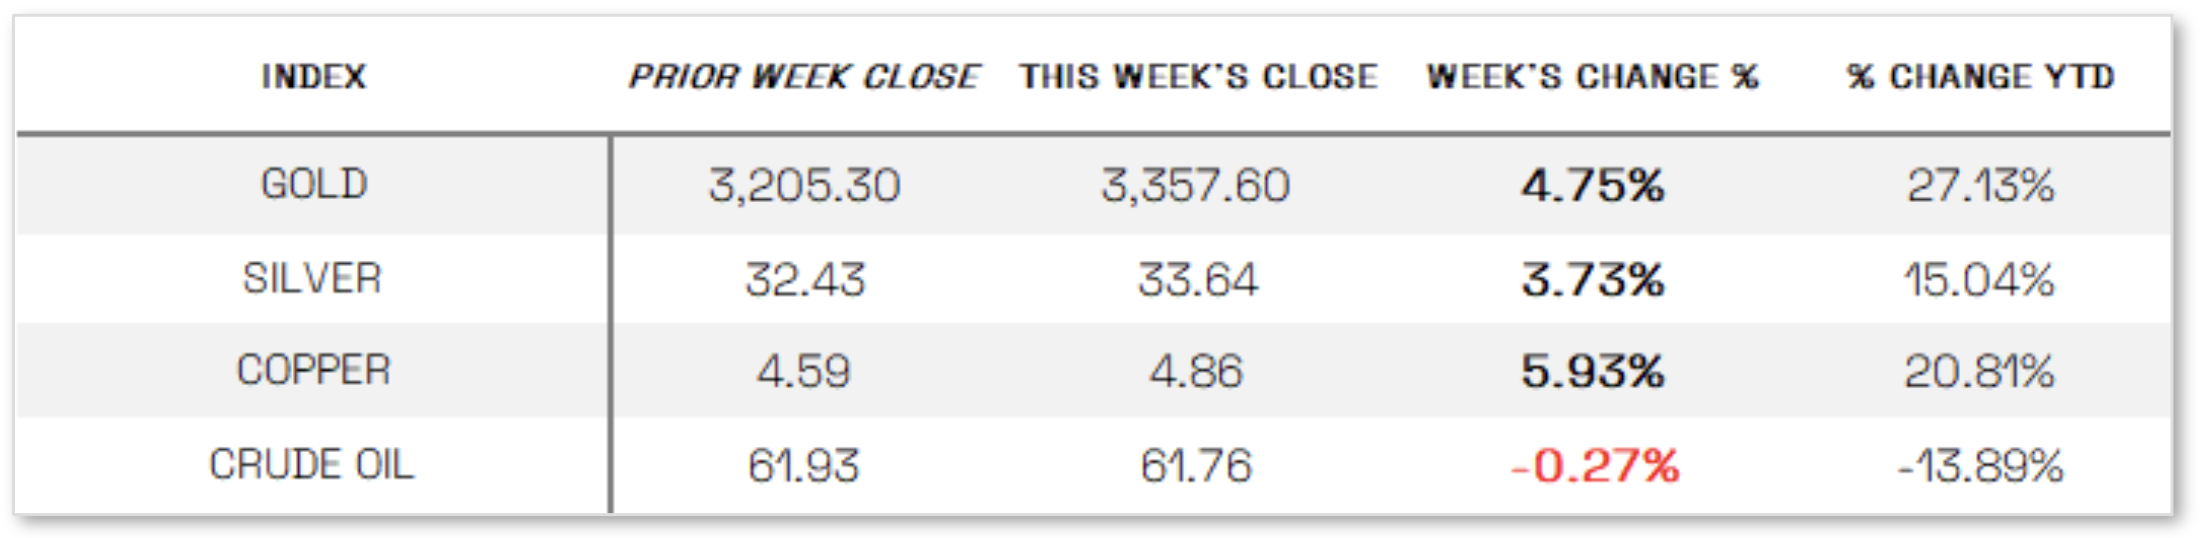
U.S. Commodities/Futures:
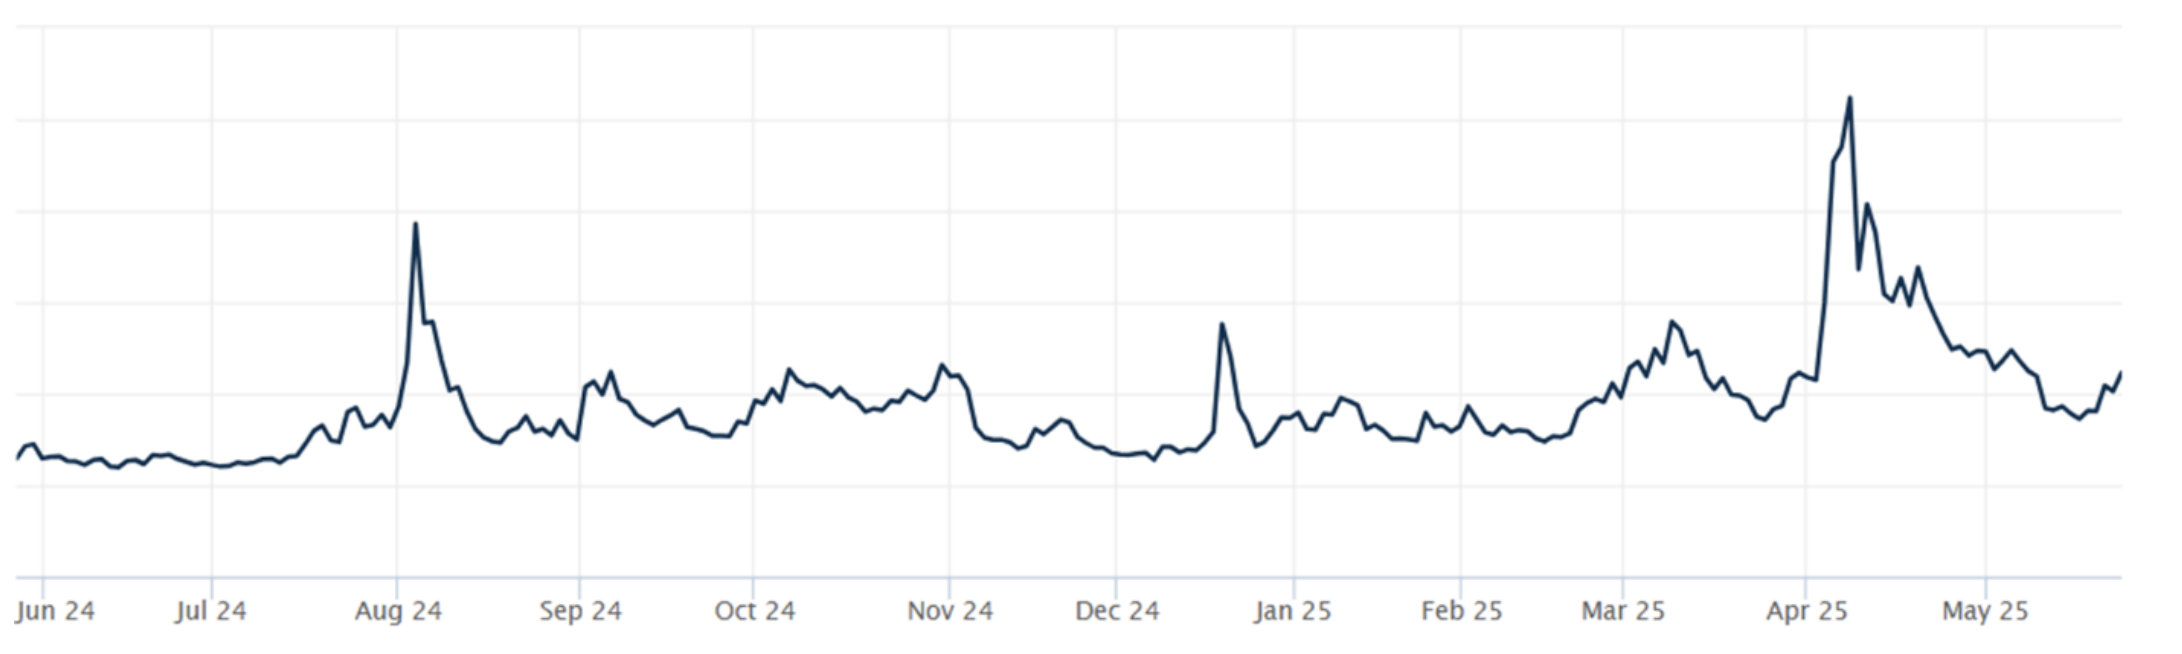
THE VOLATILITY INDEX (VIX) closed at 22.29 this week, a 29.3% increase vs last week’s close of 17.24.
International Markets:
THIS WEEK’S ECONOMIC NEWS
U.S. Economic News:
Mixed Economic Data: U.S. business activity rebounded in May after hitting a 16-month low in April, with S&P Global’s Flash PMI showing both the services and manufacturing sectors improving to readings of 52.3, exceeding expectations and signaling moderate expansion. Business sentiment also picked up from April’s two-and-a-half-year low to its highest level since January, driven in part by easing trade tensions, though concerns remained as prices rose at the fastest pace since August 2022—largely due to tariffs—while export orders declined and supply chain delays worsened. S&P Global’s Chris Williamson noted that some of May’s rebound may reflect businesses and customers rushing to act ahead of potential new tariffs. In the housing market, April existing home sales fell 0.5% to a seasonally adjusted annual rate of 4 million—the lowest April level since 2009—despite a median sales price increase to $414,000, marking the 22nd straight month of year-over-year gains. NAR’s Chief Economist Lawrence Yun highlighted persistent but unrealized pent-up demand, suggesting lower mortgage rates could unlock activity, as 30-year mortgage rates climbed to their highest since mid-February. Meanwhile, new home sales rose unexpectedly to an annual rate of 743,000 in April, far surpassing estimates, while the median sales price dropped 2% year-over-year to $407,200.
International Economic News:
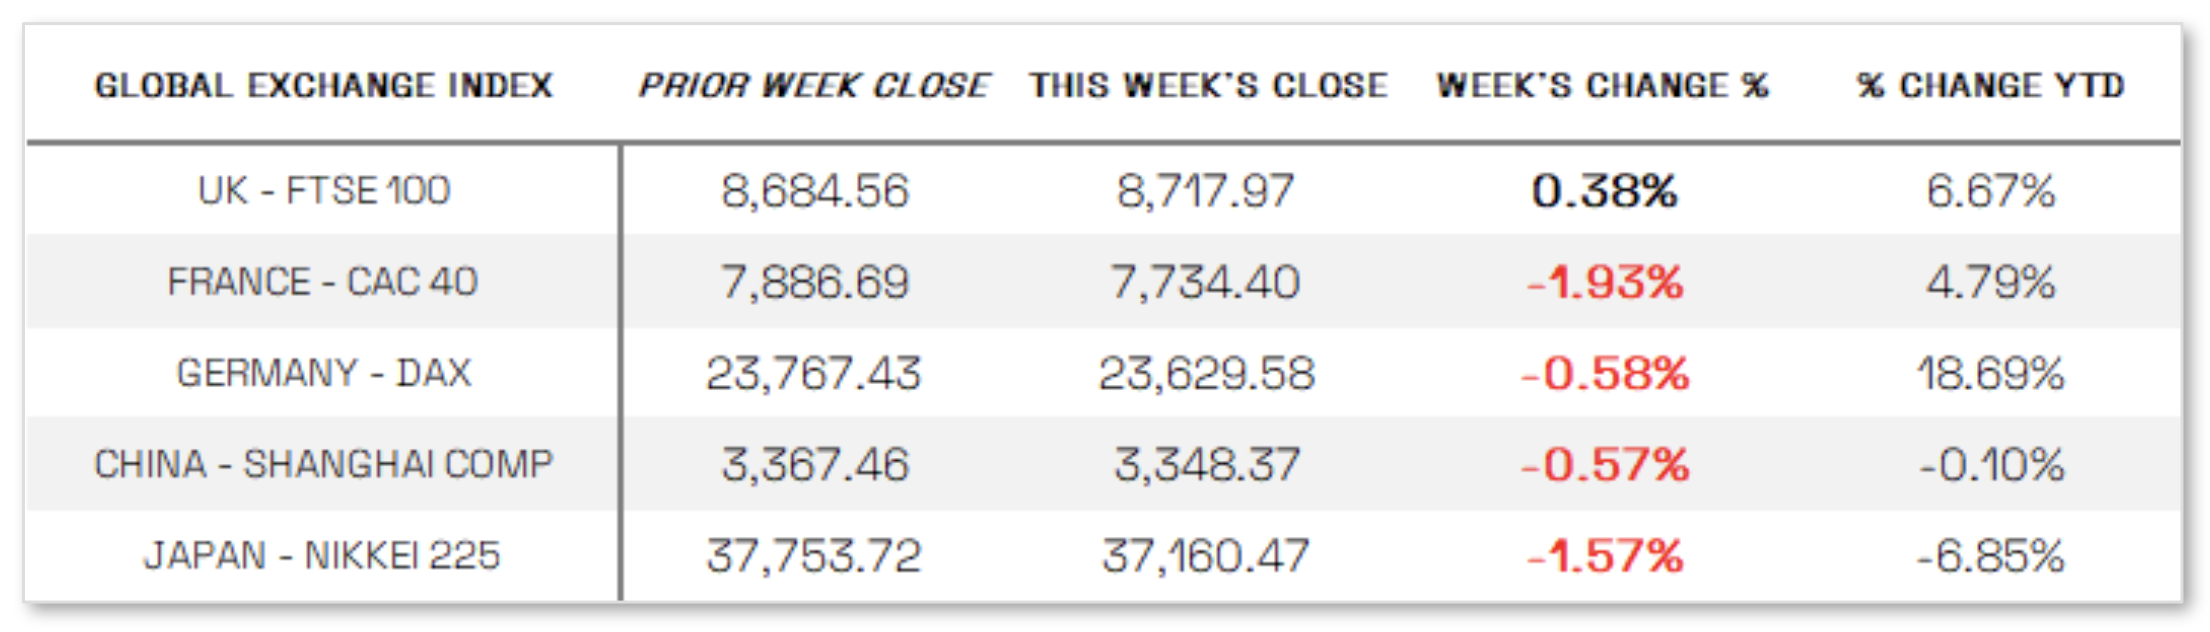
EUROPE: In local currency terms, the pan-European STOXX Europe 600 Index fell 0.75%, ending a five-week winning streak after U.S. President Donald Trump proposed a 50% tariff on European Union goods, dragging major indexes lower—Germany’s DAX slipped 0.58%, France’s CAC 40 lost 1.93%, and Italy’s FTSE MIB dropped 2.90%—while the UK’s FTSE 100 managed a 0.38% gain. Eurozone business activity unexpectedly contracted in May, with the HCOB Composite PMI falling to 49.5 from 50.4 due to a sharp services sector decline, as Germany and France both saw shrinking output. Reflecting mounting trade policy uncertainty and rising tariffs, the European Commission downgraded its 2025 growth forecast to 0.9% from 1.3%, though it now expects inflation to hit the ECB’s 2% target by mid-2025, sooner than previously projected. In contrast, Germany’s first-quarter GDP was revised sharply higher to 0.4% growth, driven by strong household spending, investment, and trade—the best performance since Q3 2022. In the UK, inflation rose more than expected to 3.5% in April, retail sales surged 1.2% month-over-month and 5.0% year-over-year, and consumer confidence ticked up in May; however, private sector activity contracted for the second month in a row, as gains in services were offset by a steep decline in manufacturing.
JAPAN: Japan’s stock markets declined over the week, with the Nikkei 225 falling 1.57% and the TOPIX slipping 0.18%, as stronger-than-expected inflation data fueled expectations of further monetary tightening by the Bank of Japan. The 10-year Japanese government bond yield rose to 1.55%—its highest level since 2008—on growing rate-hike bets, while the yen strengthened to 143.6 against the U.S. dollar, marking a two-week high, supported in part by concerns over the U.S. fiscal outlook. In trade news, Japan’s lead negotiator Ryosei Akazawa reiterated calls for broader tariff exemptions as he prepared for a third round of talks in Washington. Meanwhile, Finance Minister Katsunobu Katō noted that exchange rate levels were not discussed with U.S. Treasury Secretary Scott Bessent during the G7 meetings, in an apparent effort to downplay speculation of joint currency intervention.
CHINA: Mainland Chinese stock markets declined as investor focus returned to the domestic economy following a temporary trade truce between Beijing and Washington, with the CSI 300 Index down 0.18% and the Shanghai Composite slipping 0.57% in local currency terms, according to FactSet, while Hong Kong’s Hang Seng Index gained 1.10%. Economic data released during the week painted a mixed picture: industrial output rose a stronger-than-expected 6.1% year-over-year in April, but retail sales growth slowed to 5.1% from March’s 5.9%, missing forecasts, and fixed asset investment increased just 4% in the January–April period, falling short of estimates due to a sharp decline in property investment.
Sources:
>> All index and returns data from Norgate Data and Commodity Systems Incorporated and Wall Street Journal.
>> News from Reuters, Barron’s, Wall St. Journal, Bloomberg.com, ft.com, guggenheimpartners.com, zerohedge.com, ritholtz.com, markit.com, financialpost.com, Eurostat, Statistics Canada, Yahoo! Finance, stocksandnews.com, marketwatch.com, visualcapitalist.com, wantchinatimes.com, BBC, 361capital.com, pensionpartners.com, cnbc.com, FactSet, Morningstar/Ibbotson Associates, Corporate Finance Institute.
>> Commentary from T Rowe Price Global markets weekly update — https://www.troweprice.com/personal-investing/resources/insights/global-markets-weekly-update.html
Disclosures: This material and any mention of specific investments is provided for informational purposes only and is not intended to be investment advice or a recommendation to take any action. The forecasts or forward-looking statements are based on assumptions, may not materialize, and are subject to revision without notice. The market indexes discussed are unmanaged, and generally, considered representative of their respective markets. Index performance is not indicative of the past performance of a particular investment. Indexes do not incur management fees, costs, and expenses. Individuals cannot directly invest in unmanaged indexes. Past performance does not guarantee future results.
