


THE COMPLETE PICTURE
>> Four indicators across three time frames.
>> When the Sherman Portfolios indicators are not all the same status, we read the market as being in a Mixed Market.
1. DELTA-V — Negative since April 4, 2025
2. GALACTIC SHIELD — Positive since April 1, 2023
3. STARFLUX— Negative since March 10, 2025
4. STARPATH — Negative since March 7, 2025
The shorter term picture:
>> GALACTIC SHIELD — POSITIVE, for Q2 2025, indicating positive prospects for equities in the first quarter of 2025. This indicator is based on the combination of U.S. and International Equities trend statuses at the start of each quarter.
>> STARFLUX— NEGATIVE, Starflux ended the week at -7.70 (down 16.84% last week) This short-term indicator measures U.S. Equities.
>> STARPATH — NEGATIVE, This indicator measures the interplay on dual timeframes of our Type 1s + the Russell 3000 + our four most ‘pro-cyclical’ Type 3s, vs. Cash.
The big picture:
The ‘big picture’ is the (typically) years-long timeframe, the same timeframe in which Cyclical Bulls and Bears operate.
>> The Sherman Portfolios DELTA-V Indicator measuring the Bull/Bear cycle finished the week in BEAR status at 41.50, down 1.45% from the prior week’s 42.11. It has signaled Bearl since April 4, 2025.
>> The Sherman Portfolios DELTA-V Bond Indicator measuring the Bull/Bear cycle finished the week in BULL status at 60.08, down 0.99% from the prior week’s 60.68. It has signaled Bull since December 15, 2023.
THIS WEEK IN THE MARKETS
U.S. Markets:
Tech slide brings markets down:
During a holiday-shortened trading week, major stock indexes ended mixed, with markets closed on Friday for Good Friday. Smaller-cap indexes outperformed, as the S&P MidCap 400 and Russell 2000 posted gains, while the Dow Jones Industrial Average, S&P 500, and Nasdaq Composite declined. Large-cap tech stocks lagged, particularly in the information technology sector, which dropped after news that the U.S. government would impose new restrictions on chip exports to China, escalating trade tensions between the two countries. This development weighed on shares of companies with significant AI exposure, such as NVIDIA and Advanced Micro Devices. Additionally, comments from Federal Reserve Chair Jerome Powell contributed to negative sentiment later in the week; speaking at the Economic Club of Chicago, he highlighted that tariff increases had been more substantial than expected and warned of their inflationary impact and potential to slow growth. Powell also emphasized that the Fed is in a position to wait for more clarity before making policy changes, which some market participants interpreted as a signal against imminent rate cuts.
Looking at the US Indexes:
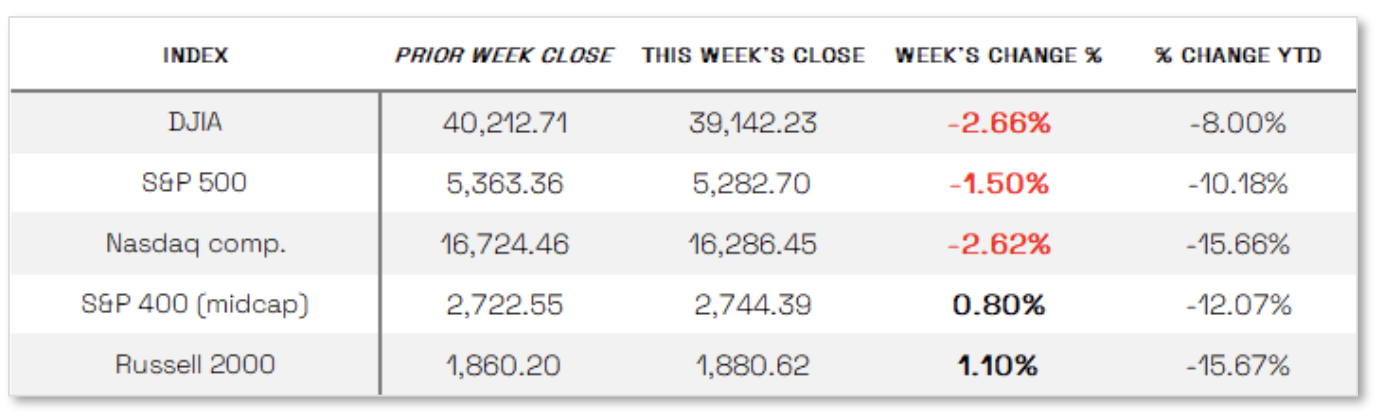
> The Dow Jones Industrial Average (DJIA) is the oldest continuing U.S. market index with over 100 years of history and is made up of 30 highly reputable “blue-chip” U.S. stocks (e.g. Coca-Cola Co., Microsoft). The Dow ended the week down 2.66% at 39,142.23 vs the prior week of 40,212.71.
> The Nasdaq Composite Index tracks most of the stocks listed on the Nasdaq Stock Market – the second-largest stock exchange in the world. Over half of all stocks on the NASDAQ are tech stocks. The tech-driven Nasdaq ended the week down 2.62%, closing at 16,286.45 vs. the prior week of 16,724.46.
> The S&P 500 large-cap index is a market-capitalization-weighted index of 500 leading publicly traded companies in the U.S. The S&P 500 is regarded as one of the best gauges of prominent American equities’ performance, and by extension, that of the stock market overall. The S&P 500 ended the week down 1.50%, closing at 5,282.70 compared to last week’s 5,363.36.
> The S&P 400 mid-cap index is the benchmark index made up of 400 stocks that broadly represent companies with midrange market capitalization between $3.6 billion and $13.1 billion. It is used by investors as a gauge for market performance and directional trends in U.S. stocks. The S&P 400 mid-cap ended the week up 0.80%, closing at 2,744.39 compared to last week’s 2,722.55.
> The Russell 2000 (RUT) small-cap index measures the performance of the 2,000 smaller companies included in the Russell 3000 Index. The Russell 2000 is managed by London’s FTSE Russell Group and is widely regarded as a leading indicator of the U.S. economy because of its focus on smaller companies that focus on the U.S. market. The Russell 2000 ended the week up 1.10%, closing at 1,880.62 compared to last week’s 1,860.20.
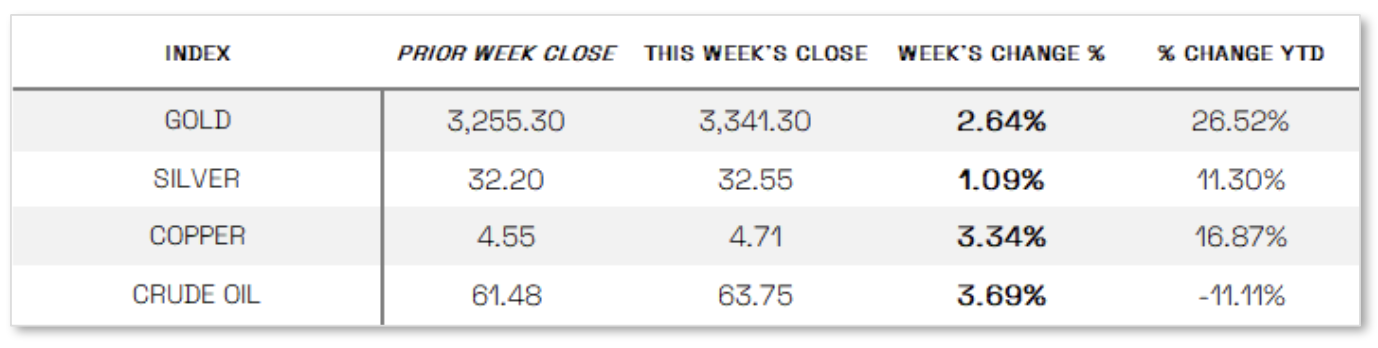
U.S. Commodities/Futures:
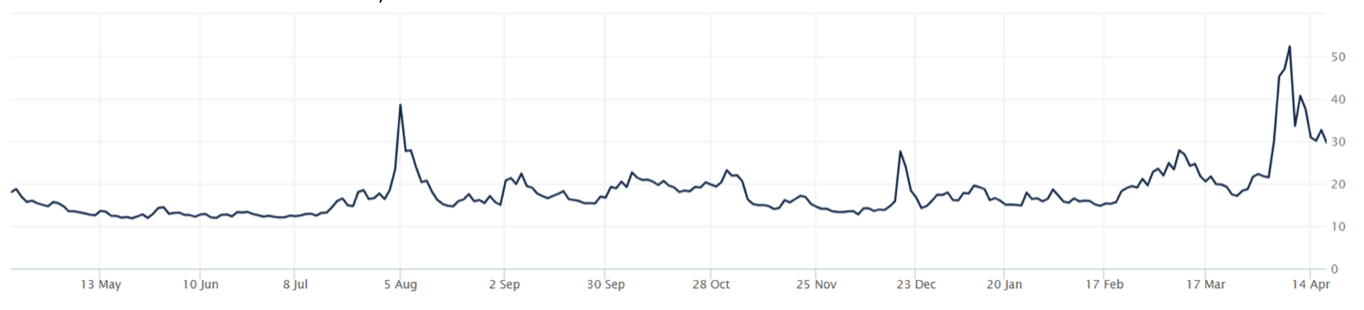
THE VOLATILITY INDEX (VIX) closed at 29.65 this week, a 21.1% decrease vs last week’s close of 37.56.
International Markets:
THIS WEEK’S ECONOMIC NEWS
U.S. Economic News:
Housing turbulence echoes market volatility: Policy uncertainty continued to weigh on the U.S. housing market, as reflected in several economic data releases during the week. The NAHB Housing Market Index edged up slightly to 40 in April but remained below the neutral threshold of 50, signaling ongoing pessimism among homebuilders. NAHB Chief Economist Robert Dietz attributed this to policy uncertainty, which he said hampers builders’ ability to price homes and make key business decisions. This sentiment was echoed in housing starts data released Thursday, showing a more than 11% drop in new home construction in March to an annualized rate of 1.32 million, well below expectations. Homebuilder D.R. Horton also pointed to a slower-than-expected start to the 2025 spring selling season, citing affordability concerns and declining consumer confidence, and subsequently lowered its revenue and closings guidance for the year. Meanwhile, retail sales rose 1.4% in March—the largest monthly gain in over two years—as consumers appeared to accelerate purchases ahead of anticipated tariff hikes, particularly in autos, where sales at motor vehicle and parts dealers jumped 5.3%. Sales also rose in categories such as building materials, sporting goods, and electronics.
International Economic News:
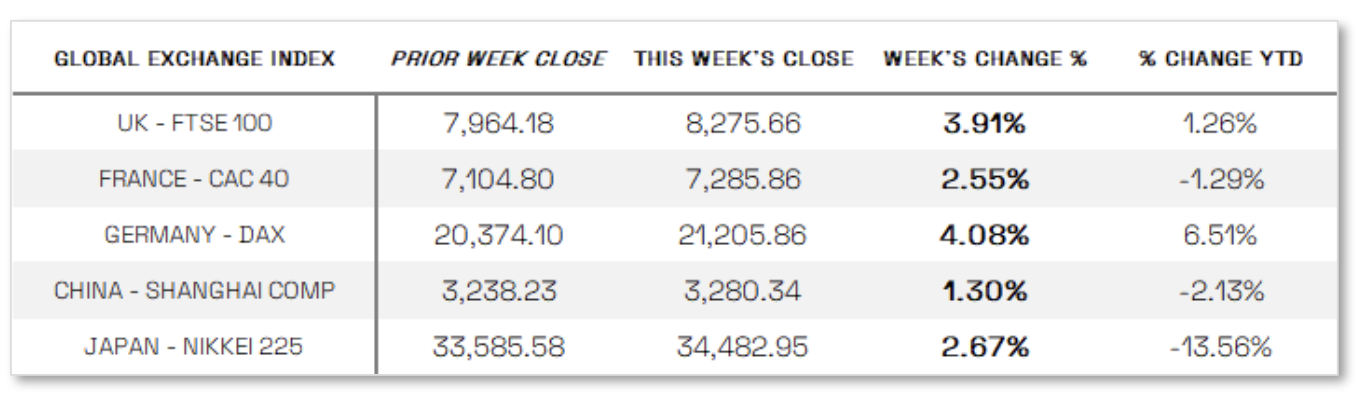
EUROPE: In local currency terms, the pan-European STOXX Europe 600 Index, recoved some of its earlier April losses as investor sentiment improved following President Trump’s decision to delay higher tariffs and signals from the European Central Bank (ECB) that further interest rate cuts are likely. Major European stock indexes also posted gains during the period, with Germany’s DAX rising 4.08%, France’s CAC 40 adding 2.55%, and the UK’s FTSE 100 climbing 3.91%. As expected, the ECB cut its key deposit rate by 25 basis points to 2.25% and removed language indicating that policy was becoming less restrictive. Reaffirming its data-dependent, meeting-by-meeting approach, the ECB emphasized it was not precommitting to a specific rate path, while acknowledging that disinflation is progressing but growth prospects have worsened due to ongoing trade policy uncertainty. The ECB’s message suggests a desire to push borrowing costs significantly below the neutral rate—potentially down to 1.5% or lower—exceeding current market expectations.
JAPAN: Japan’s stock markets advanced in the week ended Thursday, with the Nikkei 225 Index climbing 2.67%, according to Bloomberg data. Investor sentiment improved late in the week amid signs of progress in U.S.-Japan trade talks, where Japan is seeking a review of existing tariffs and more favorable terms. On the monetary policy front, the Bank of Japan (BoJ) maintained a cautious tone, with Governor Kazuo Ueda suggesting that ongoing uncertainties, including the impact of tariffs, may justify continued policy support and potentially delay the next rate hike. The BoJ reiterated that it would raise rates only if its economic and inflation forecasts are met. The yield on the 10-year Japanese government bond fell to around 1.31% from 1.36% the previous week. Meanwhile, escalating U.S.-China trade tensions drove demand for safe-haven assets, pushing the yen to the higher end of the JPY 142 range against the dollar, despite foreign exchange not being part of current U.S.-Japan trade discussions. On the economic front, Japan’s exports rose 3.9% year over year in March, missing expectations and slowing from February’s 11.4% growth, weighed down by U.S. tariffs and weaker demand from Europe and China. Imports increased 2.0%, below the expected 3.1%, but rebounded from a decline in February.
CHINA: Mainland Chinese stock markets rose for the week ended Thursday amid growing expectations that Beijing will ramp up stimulus efforts to cushion the blow from higher U.S. tariffs, with the Shanghai Composite rising 1.30% in local currency terms, according to FactSet; Hong Kong’s Hang Seng Index also advanced 2.30%. China’s GDP grew 5.4% year over year in the first quarter, beating expectations, though analysts noted the figure was largely boosted by front-loaded exports ahead of new U.S. tariffs and does not reflect the full impact of the recent hikes, which raised total tariffs on most Chinese goods to 145%. As the effects of the trade escalation become more pronounced in the coming months, many global banks have revised down their 2025 growth forecasts, expressing skepticism over China’s ability to meet its official 5% target. However, the likelihood of additional near-term stimulus has increased, with analysts anticipating clarity following the upcoming Politburo meeting at the end of April. Economists believe China has sufficient fiscal flexibility to counteract the negative effects of the tariffs through expanded government support.
Sources:
>> All index and returns data from Norgate Data and Commodity Systems Incorporated and Wall Street Journal.
>> News from Reuters, Barron’s, Wall St. Journal, Bloomberg.com, ft.com, guggenheimpartners.com, zerohedge.com, ritholtz.com, markit.com, financialpost.com, Eurostat, Statistics Canada, Yahoo! Finance, stocksandnews.com, marketwatch.com, visualcapitalist.com, wantchinatimes.com, BBC, 361capital.com, pensionpartners.com, cnbc.com, FactSet, Morningstar/Ibbotson Associates, Corporate Finance Institute.
>> Commentary from T Rowe Price Global markets weekly update — https://www.troweprice.com/personal-investing/resources/insights/global-markets-weekly-update.html
Disclosures: This material and any mention of specific investments is provided for informational purposes only and is not intended to be investment advice or a recommendation to take any action. The forecasts or forward-looking statements are based on assumptions, may not materialize, and are subject to revision without notice. The market indexes discussed are unmanaged, and generally, considered representative of their respective markets. Index performance is not indicative of the past performance of a particular investment. Indexes do not incur management fees, costs, and expenses. Individuals cannot directly invest in unmanaged indexes. Past performance does not guarantee future results.
